. 1996 Jul 1;16(13):4240-9.
doi: 10.1523/JNEUROSCI.16-13-04240.1996.

Stimulus specificity of phase-locked and non-phase-locked 40 Hz visual responses in human

Affiliations

Stimulus specificity of phase-locked and non-phase-locked 40 Hz visual responses in human

C Tallon-Baudry et al. J Neurosci. .

Abstract

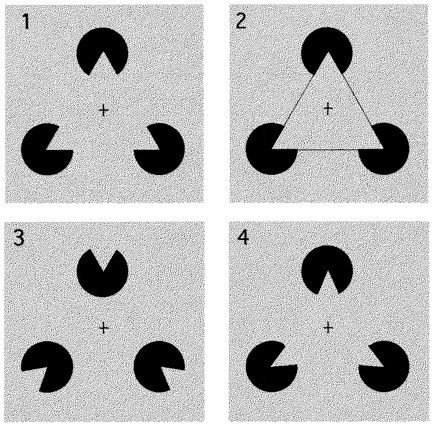
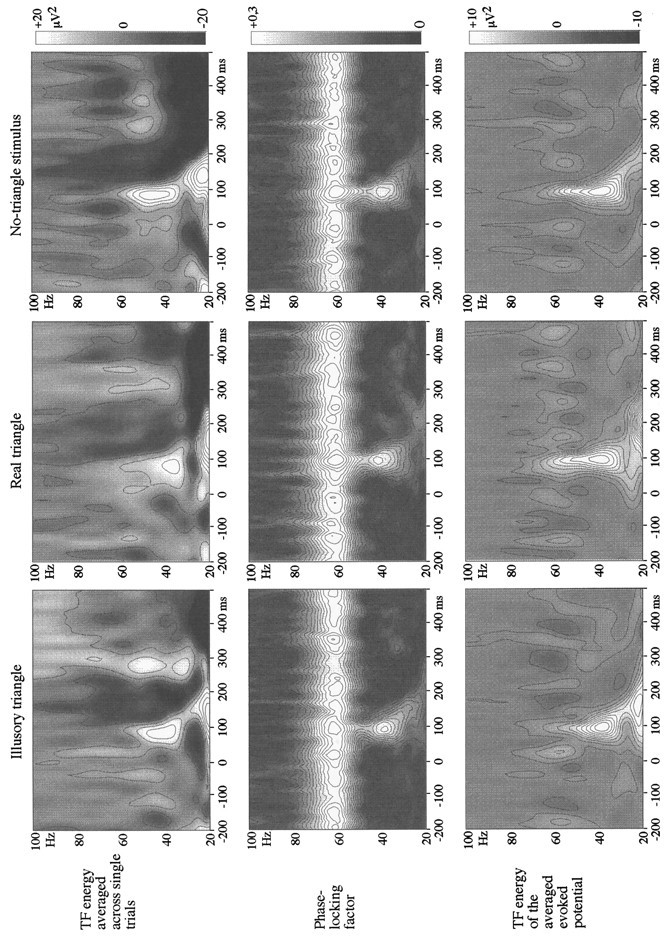
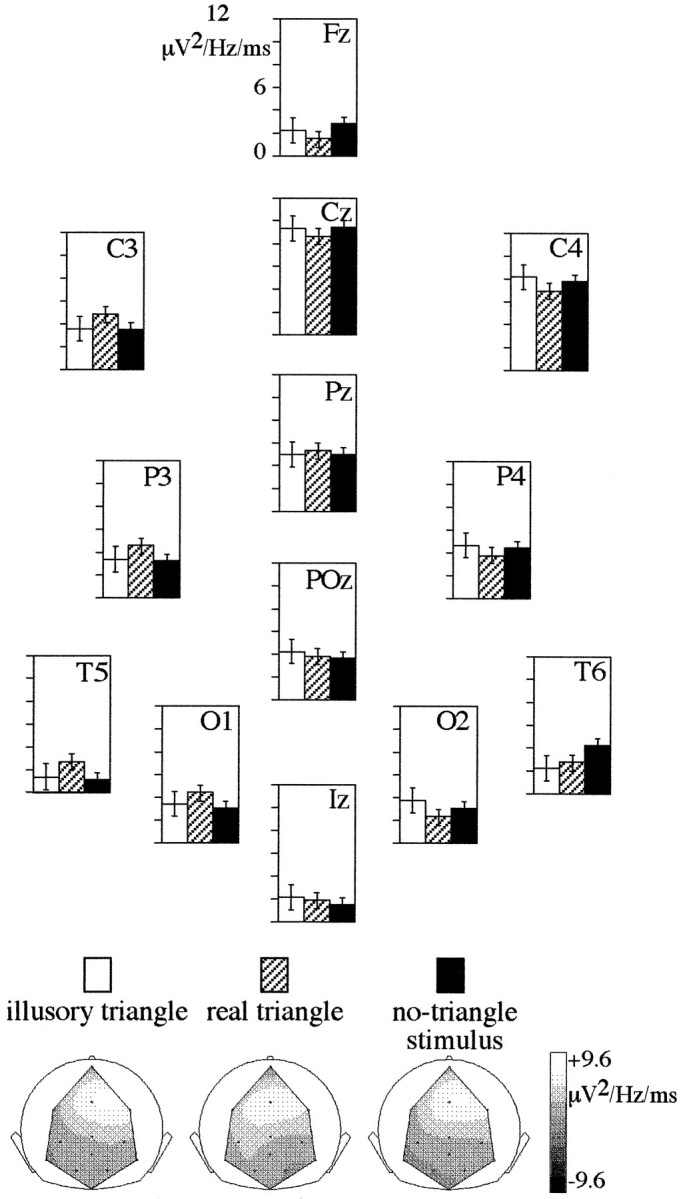
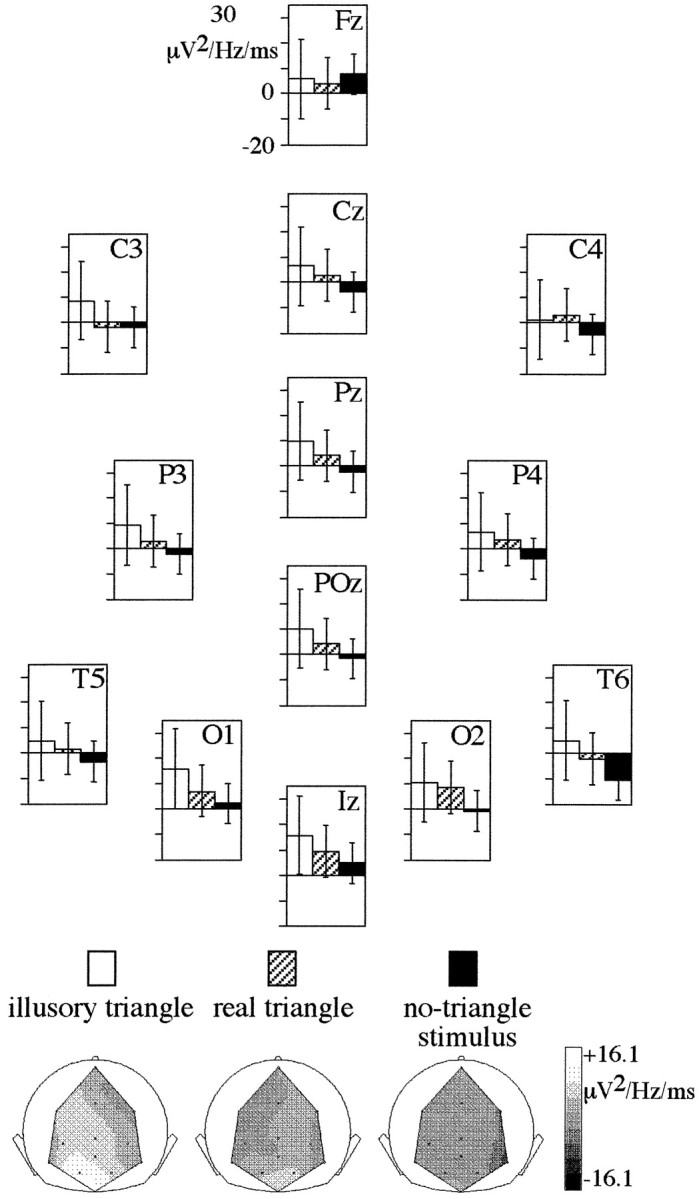
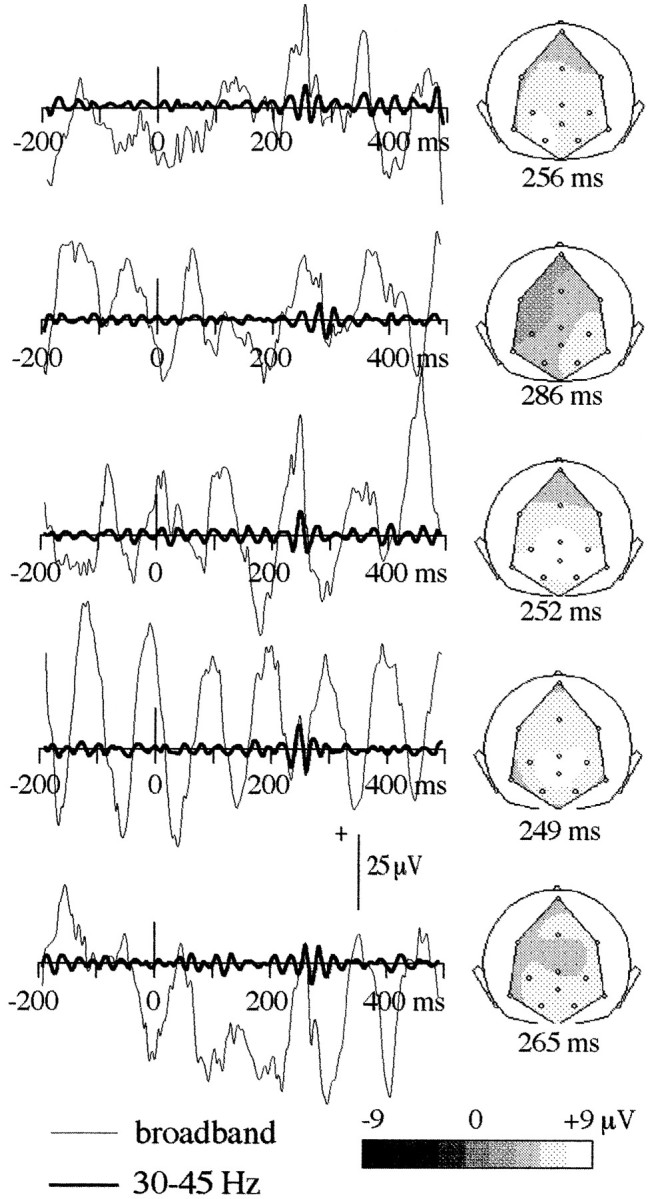
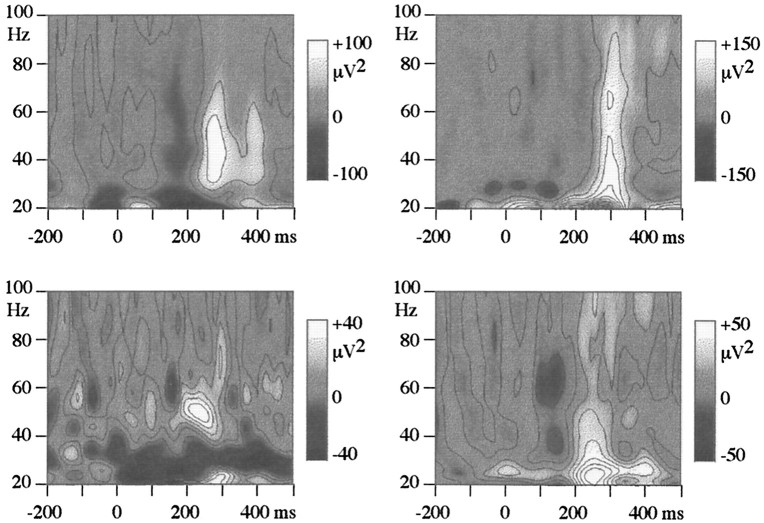
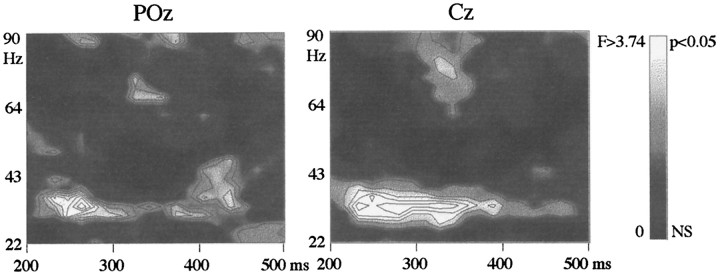
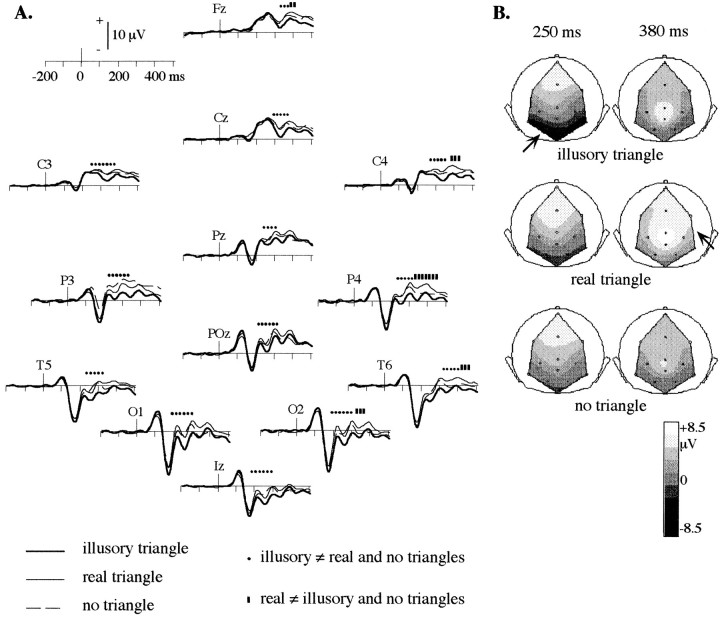
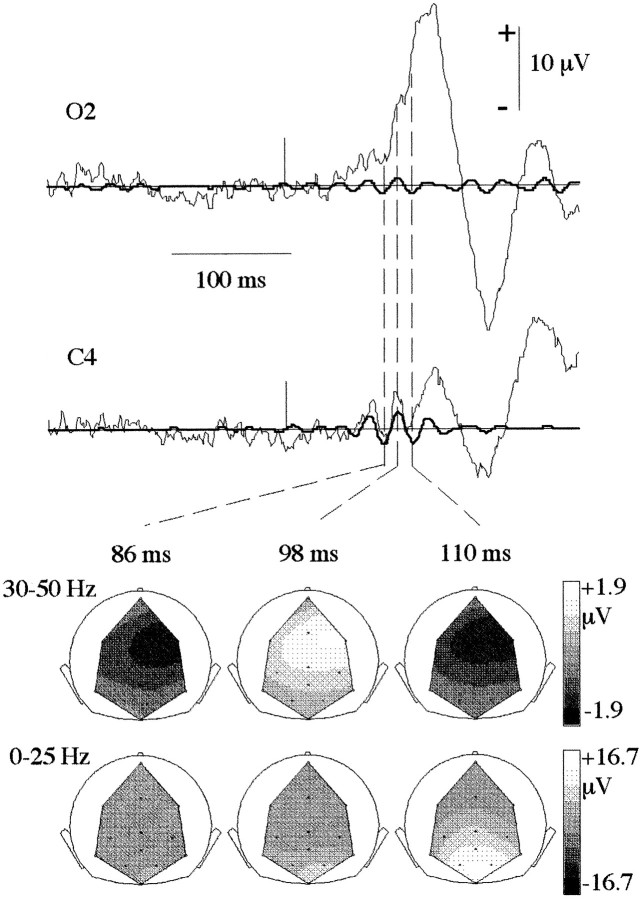
Considerable interest has been raised by non-phase-locked episodes of synchronization in the gamma-band (30-60 Hz). One of their putative roles in the visual modality is feature-binding. We tested the stimulus specificity of high-frequency oscillations in humans using three types of visual stimuli: two coherent stimuli (a Kanizsa and a real triangle) and a noncoherent stimulus ("no-triangle stimulus"). The task of the subject was to count the occurrences of a curved illusory triangle. A time-frequency analysis of single-trial EEG data recorded from eight human subjects was performed to characterize phase-locked as well as non-phase-locked high-frequency activities. We found in early phase-locked 40 Hz component, maximal at electrodes Cz-C4, which does not vary with stimulation type. We describe a second 40 Hz component, appearing around 280 msec, that is not phase-locked to stimulus onset. This component is stronger in response to a coherent triangle, whether real or illusory: it could reflect, therefore, a mechanism of feature binding based on high-frequency synchronization. Because both the illusory and the real triangle are more target-like, it could also correspond to an oscillatory mechanism for testing the match between stimulus and target. At the same latencies, the low-frequency evoked response components phase-locked to stimulus onset behave differently, suggesting that low- and high-frequency activities have different functional roles.


Figures

Fig. 1.
Fig. 1.
Stimuli. We used three types of nontarget stimuli: an illusory triangle (Kanizsa triangle) (1), a real triangle (2), and what we called a “no-triangle stimulus” (3). Subjects were instructed to count silently the occurrences of an additional target distractor, a curved illusory triangle (4). This task, when correctly performed, ensured that subjects perceived illusory contours.
Fig. 2.
Fig. 2.
Time–frequency analysis at electrode Cz, grand average across subjects. Top row, TF energy averaged across single trials. This type of averaging sums phase-locked as well as non-phase-locked activities. Results are baseline-corrected (subtraction of the prestimulus levels in each frequency band), thus producing positive and negative values. Two successive increases of TF energy can be observed: a first one around 90 msec and a second one around 280 msec. Middle row, Phase-locking factor. The first gamma-band component (90 msec) is phase-locked to stimulus onset, whereas the second one (280 msec) disappears: it is not phase-locked. Data are not baseline-corrected: the artifact created by our video monitor, therefore, is prominent (continuous component at 62 Hz, video frame rate). Bottom row, Baseline-corrected TF energy of the averaged evoked potential. Only phase-locked components of the response can be seen, but with a better signal-to-noise ratio. There are no TF energy differences between stimulation types for the 40 Hz, 90 msec component.
Fig. 3.
Fig. 3.
Energy of the first component, considered as the mean value between 70 and 120 msec and 30 and 50 Hz of the TF energy of the averaged evoked potential. The topography of this component is rather focal, with a clear maximum at electrodesCzC4. No variation with stimulation type can be observed.
Fig. 4.
Fig. 4.
Energy of the second component, considered as the mean value between 250 and 350 msec and 30 and 70 Hz of the TF energy averaged across single trials. The topography of this component is widespread, with a weak maximum at occipital electrodes (O1,Iz, O2). There seems to be a maximum of energy in response to the illusory triangle, an intermediate value in response to the real triangle, and a small one in response to the no-triangle stimulus.
Fig. 5.
Fig. 5.
30–45 Hz filtered (thick lines) and broad-band (thin lines) single trials at electrode POz and topography of each 30–45 Hz filtered response at the latency of the maximal positive peak. Oscillatory episodes are rather brief (from 100 to 150 msec) and of high amplitude (up to 10 μV), even though the amplitude of the broad-band response is higher. They are not phase-locked to stimulus onset (indicated by the vertical bar at 0 msec). Their topography is widespread, without any polarity inversion; a maximum is usually located at occipital or parietal electrodes.
Fig. 6.
Fig. 6.
TF energy averaged across single trials of four different subjects, at electrode POz, in response to the illusory triangle. Note the strong intersubject variability of the non-phase-locked, 280 msec component (energy of the maximum ranging from 40 to 150 μV2 and frequency from 25 to 65 Hz).
Fig. 7.
Fig. 7.
Quade test: F-values at electrodesPOz and Cz. A Quade test was performed on the energy averaged across single trials, on 100 msec × 15 Hz moving time–frequency windows. F > 3.74 (inwhite) at x msec and y Hz indicates a significant effect (p < 0.05) of the stimulation type in the 100 msec × 15 Hz time–frequency window centered in (x,y). The duration of the significant effect may vary from electrode to electrode, but the effect is always confined to the 30–40 Hz range.
Fig. 8.
Fig. 8.
A, 0–25 Hz filtered averaged evoked potentials. We performed a Quade test and Conover procedures on the averaged evoked potential, computed over 100 msec time windows regularly shifted by 20 msec. Two successive effects can be found. They are plotted on the figure as dots or barsindicating the center of the 100 msec time window on which an effect has been found. A first effect occurs on all of the electrodes between 200 and 300 msec; it corresponds to potentials more negative for the illusory triangle than for the two others (dots). The second effect concerns a more limited set of electrodes and appears between 300 and 400 msec. It corresponds to a greater positivity in response to the real triangle than the two others (bars). B, Topography of the 0–25 Hz averaged evoked potential (grand average across subjects) at two latencies (250 and 380 msec) in each condition. At 250 msec, the response to the illusory triangle shows a more pronounced negativity at occipital and parietal electrodes. At 380 msec, the real triangle elicits a more positive response than the two others on the right side of the scalp.
Fig. 9.
Fig. 9.
Comparison of the first 40 Hz component to the low-frequency P1 of the evoked response. The broad-band averaged evoked potential (thin line) of a typical subject is presented at two electrodes, superimposed with the 30–50 Hz filtered evoked potential (thick lines). The vertical barindicates stimulus onset. The oscillatory 40 Hz event occurs atC4, whereas the low-frequency P1 is rising at O2. Note the amplitude difference between the two events. The topographies of the 30–50 Hz and 0–25 filtered evoked potential are shown at three latencies: they are clearly distinct.

References

    1. Bertrand B, Pantev C. Stimulus frequency dependence of the transient oscillatory auditory evoked responses (40 Hz) studied by electric and magnetic recordings in human. In: Pantev C, Elbert T, Lütkenhöner B, editors. Oscillatory event-related brain dynamics. Plenum; New York: 1994. pp. 135–146.
    1. Bragin A, Jandó G, Nádasky Z, Hetke J, Wise K, Buzsáki G. Gamma (40–100 Hz) oscillation in the hippocampus of the behaving rat. J Neurosci. 1995;15:47–60. - PMC - PubMed
    1. Brosch M, Bauer R, Eckhorn R. Synchronous high-frequency oscillations in cat area 18. Eur J Neurosci. 1995;7:86–95. - PubMed
    1. Chatrian GE, Bickford RG, Uihlein A. Depth electrographic study of a fast rhythm evoked from the human calcarin region by steady illumination. Elec Clin Neurophysiol. 1960;12:167–176. - PubMed
    1. Conover WJ. Wiley; New York: 1980. Practical nonparametric statistics, 2nd Ed.

LinkOut - more resources