. 1996 Jul 1;16(13):4261-74.
doi: 10.1523/JNEUROSCI.16-13-04261.1996.

Three-dimensional statistical analysis of sulcal variability in the human brain

Affiliations

Three-dimensional statistical analysis of sulcal variability in the human brain

P M Thompson et al. J Neurosci. .

Abstract

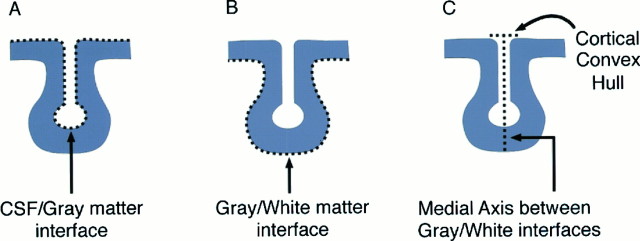
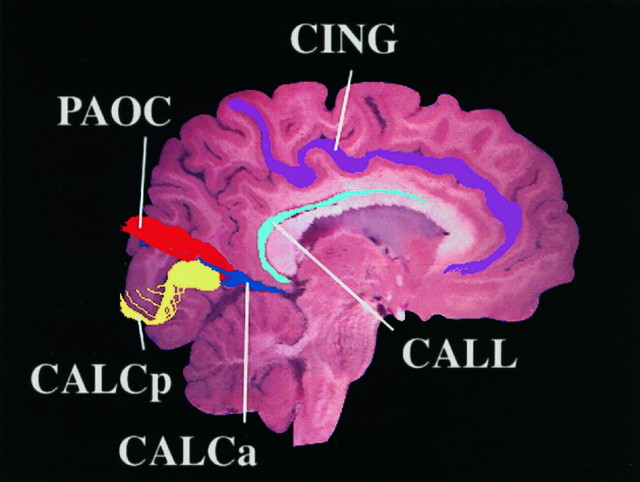
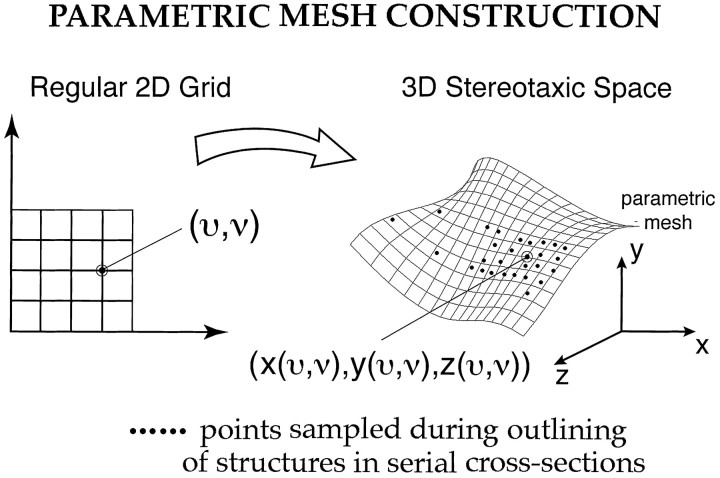
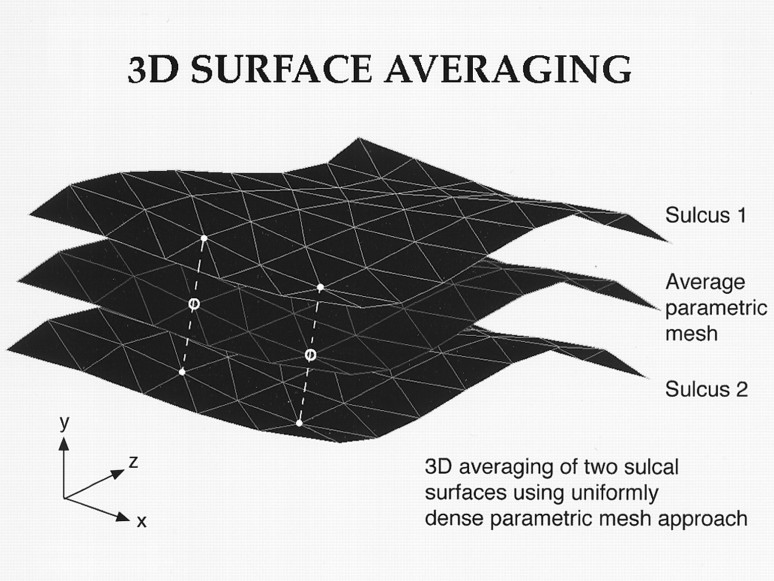
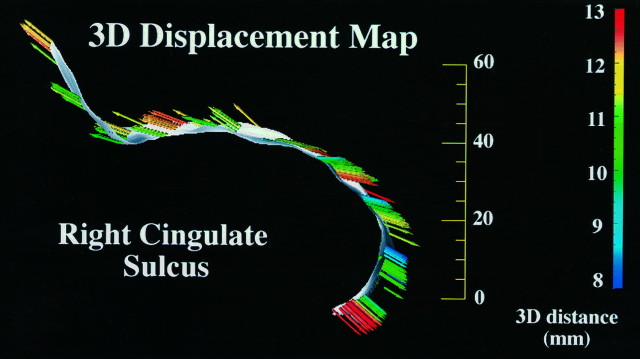
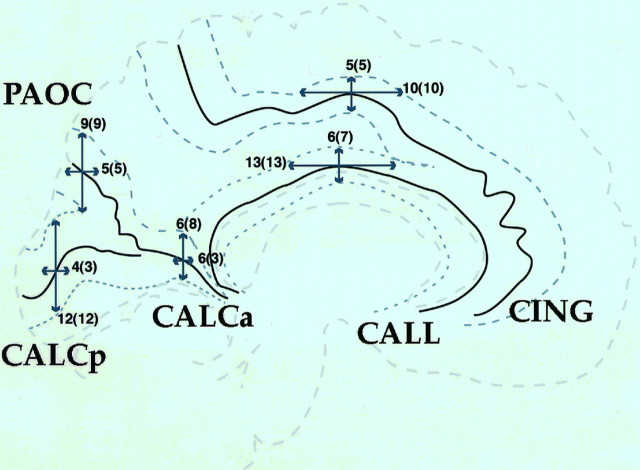
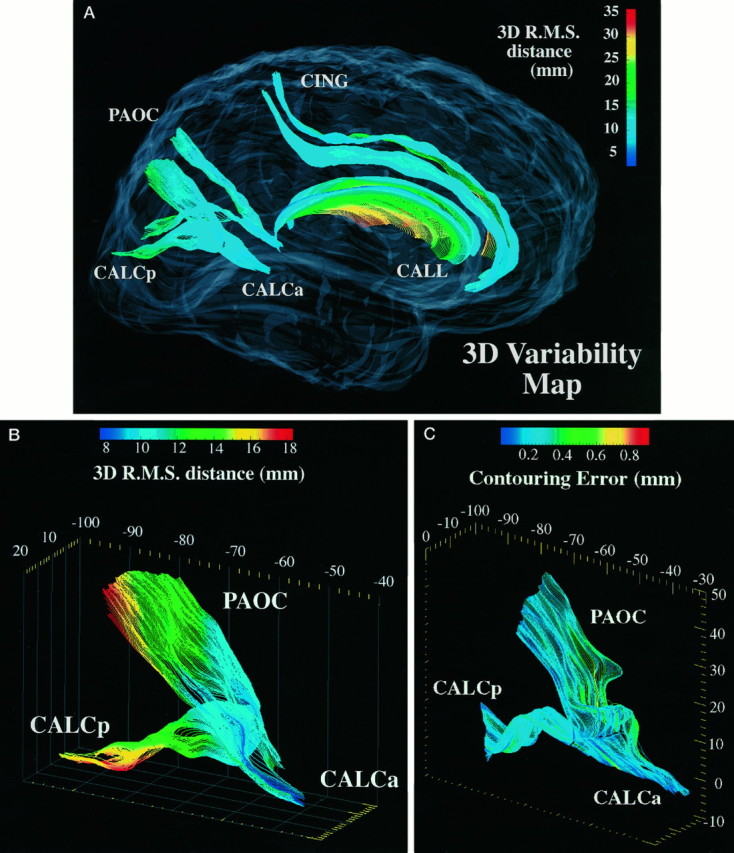
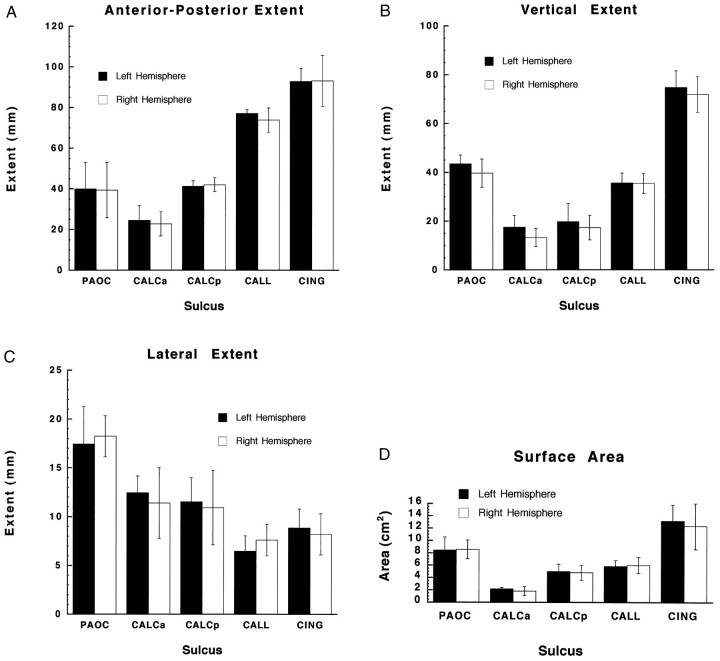
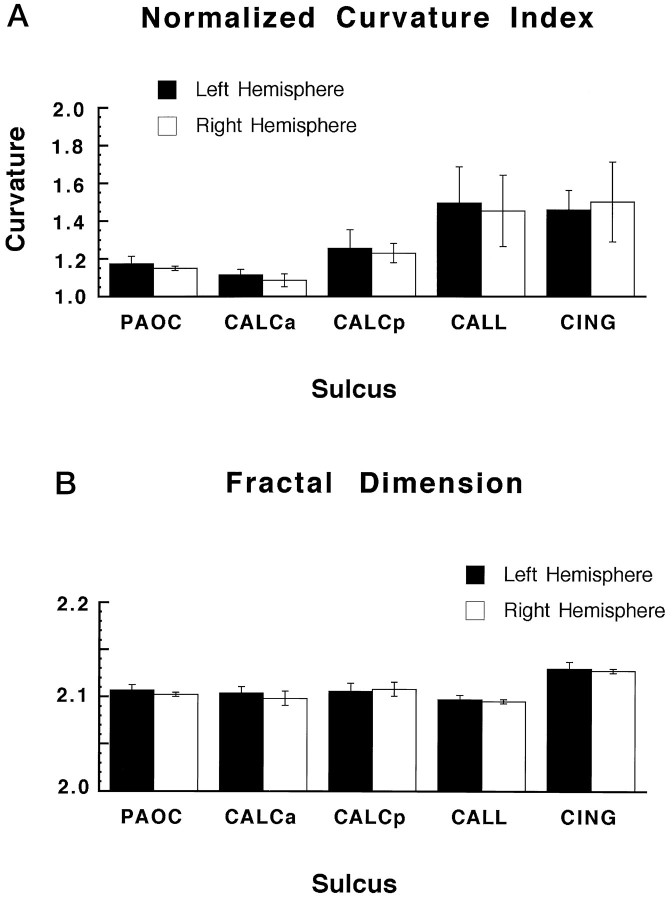
Morphometric variance of the human brain is qualitatively observable in surface features of the cortex. Statistical analysis of sulcal geometry will facilitate multisubject atlasing, neurosurgical studies, and multimodality brain mapping applications. This investigation describes the variability in location and geometry of five sulci surveyed in each hemisphere of six postmortem human brains placed within the Talairach stereotaxic grid. The sulci were modeled as complex internal surfaces in the brain. Heterogeneous profiles of three-dimensional (3D) variation were quantified locally within individual sulci. Whole human heads, sectioned at 50 micrometer, were digitally photographed and high-resolution 3D data volumes were reconstructed. The parieto-occipital sulcus, the anterior and posterior rami of the calcarine sulcus, the cingulate and marginal sulci, and the supracallosal sulcus were delineated manually on sagittally resampled sections. Sulcal outlines were reparameterized for surface comparisons. Statistics of 3D variation for arbitrary points on each surface were calculated locally from the standardized individual data. Additional measures of surface area, extent in three dimensions, surface curvature, and fractal dimension were used to characterize variations in sulcal geometry. Paralimbic sulci exhibited a greater degree of anterior-posterior variability than vertical variability. Occipital sulci displayed the reverse trend. Both trends were consistent with developmental growth patterns. Points on the occipital sulci displayed a profile of variability highly correlated with their 3D distance from the posterior commissure. Surface curvature was greater for the arched paralimbic sulci than for those bounding occipital gyri in each hemisphere. On the other hand, fractal dimension measures were remarkably similar for all sulci examined, and no significant hemispheric asymmetries were found for any of the selected spatial and geometric parameters. Implications of cortical morphometric variability for multisubject comparisons and brain mapping applications are discussed.


Figures

Fig. 1.
Fig. 1.
Rules for delineating sulci. The ability to resolve neuroanatomic boundaries is critical for accurate structure delineation. Three methods are shown for defining the interior course of sulci in cryosection images. The densitometric gradient afforded by 24-bit full-color images provides excellent color pigment differentiation and texture contrast at the exterior surface of the cortical laminae (A) and at gray-white matter interfaces flanking the sulci (B). Nevertheless, a medial axis definition (C), adopted here, provides a fundamental laminar path into the brain for each primary sulcus, the structural integrity of which is not compromised in regions where secondary sulci branch away, or at points of confluence with other sulci. In addition, methodC is adaptable for use with other anatomic imaging modalities such as MRI, in which cellular interfaces are blurred out or more diffusely represented. The course of medial axis is not affected by any purely symmetrical errors, which occur in identifying the opposing sulcal banks. It can therefore be identified in an accurate and reproducible way, even in low-contrast imaging modalities.
Fig. 2.
Fig. 2.
Sagittal projection of the full set of sulcal contours traced in the left hemisphere of a single brain. These sets of contours were derived from the full series of sectional images spanning the left hemisphere of one brain specimen. Orthogonally projected contours of the anterior and posterior rami of the calcarine sulcus (CALCa and CALCp), as well as the cingulate (CING), supracallosal (CALL), and parieto-occipital (PAOC) sulci, are shown overlaid on one representative sagittal section.
Fig. 3.
Fig. 3.
Parametric mesh construction. The outlining process generates a densely sampled set of points, which are known to be located on the internal surface of a sulcus (indicated byisolated points, above right). These points, however, are not distributed uniformly on the sulcal surface. Isolation of points that correspond geometrically involves the molding of a lattice-like mesh onto the geometric profile of the surface so that each point on the mesh can be averaged with its counterparts on other surfaces. The concept is similar to that of a regular net being stretched over an object. Under certain strict conditions, the imposition of regular grids onto biological surfaces permits cross-subject comparisons by specifying a computed correspondence along the outline arcs and within the interior of the structures (Bookstein, 1985). The imposition of an identical regular structure on surfaces from different specimens allows surface statistics to be derived. Local statistical comparisons are then made by associating points with identical grid locations within their respective surfaces. One condition that must hold for the comparisons to be valid is that landmark points and curves known to the anatomist appear in corresponding locations in each parametric grid. The appendix describes a battery of tests that were performed to confirm that this condition was satisfied. Mesh partitioning strategies (see ) were also used to ensure the accuracy of the computed correspondences at complex anatomic boundaries.
Fig. 4.
Fig. 4.
3D surface averaging. To determine the discrepancy between two surfaces in the same stereotaxic system, a mesh construction algorithm generates a structured pattern of sample points at corresponding positions on surfaces outlined in different specimens, before examining the distances between the sets of corresponding points (Sclaroff and Pentland, 1994). Because the resolution of the meshes is standardized, the averaging of the 3D position vectors of corresponding nodes on meshes from each specimen yields an average surface representation for each sulcus.
Fig. 5.
Fig. 5.
A 3D displacement map shown on a 3D representation of the average right cingulate sulcus. Local discrepancies between individual sulci and their respective average surface can readily be calculated. Both the magnitude and direction of such surface discrepancies are indicated by arrows that originate at points defined by the mesh. The map shown displaces the average representation of the right cingulate sulcus onto the equivalent surface in a randomly selected specimen brain. Notice that the mesh in this figure contains a reduced number of points for the convenience of illustration. The coronal plane through the anterior commissure (y = 0) divides the anatomical architecture into two regions, which are subjected, by the Talairach transform, to different scaling transformations in the anterior–posterior direction. This aspect of the stereotaxic transform may explain why the directional bias of local anatomic variation differs considerably for sulcal points on each side of this coronal plane.
Fig. 6.
Fig. 6.
A, Sulcal variability expressed as a 3D distance in stereotaxic space. This summary measure of variability is obtained as follows. The map, which displaces the sulcal surface in a given specimen onto the average representation for that sulcus, assigns a 3D displacement vector to each node in the specimen surface. Comparison of the six specimen surface maps yields a variance value for the magnitude of the displacement vector assigned by each map to a given node. The square root of this measure gives the positional SD of each node as a distance in stereotaxic space. The mean and SD of these nodal values are shown here for each sulcus. This final numeric value gives a global indication of the stereotaxic variability of each sulcus when all the nodes on its surface are taken into account. Notice the relatively heterogeneous profile of variation exhibited by the callosal sulcus in both hemispheres. Rapidly changing profiles of thecallosal genu were observed from one section to the next during delineation of this sulcus. This factor undoubtedly contributed to the high intersubject variance in the anterior segment of the structure. B, Resolution of sulcal variability into directional components. Displacement maps are used to encode the spatial relations of sulci in different individuals. These maps may then be analyzed into orthogonal components along each of the three axes of stereotaxic space. When the discrepancies among the sulci are considered separately along each orthogonal dimension of Talairach space, several directional biases become apparent. All six occipital sulci (PAOC, CALCa, CALCp) vary most prominently in the vertical direction, whereas the four paralimbic sulci (CALL, CING) display the greatest variation in the anterior–posterior direction (L and Rdenote structures in the left and right hemispheres, respectively). Lateral components of variability are consistently the lowest of all. Consequently, spatial variability in the internal anatomy of the sulci is not isotropic, exhibiting inherent directional biases characteristic of each individual sulcus.
Fig. 7.
Fig. 7.
Inherent directional biases in sulcal variability. Components of sulcal variability in both the anterior–posterior and vertical directions are illustrated schematically (arrows) on a single sagittal section. Numerical values for these components, in millimeters, are also shown. For each pair of values given, the first value refers to structures in the left hemisphere; values inparentheses indicate structures in the right hemisphere. Confidence regions for structure identification are represented in the vicinity of each sulcus (internal dotted lines). Portions of sulci falling outside these designated regions are dislocated by >1 SD from the average sulcal surface in both of the chosen directions.
Fig. 8.
Fig. 8.
A, Average surface representations and 3D variability maps for major sulci in both hemispheres. 3D modeling and surface reconstruction techniques allow visualization of sulcal topography and greatly enhance the ability to appreciate complex spatial relationships. 3D representations are shown for all 10 average sulci from corresponding hemispheres of the six specimen brains. In this case, local variability is shown in color, on an average representation of each sulcus in Talairach stereotaxic space. The color encodes the rms magnitude of the displacement vectors required to map the surfaces from each of the six specimens onto the average, according to standard parametric criteria. B, 3D variability maps for major sulci of the occipital lobe. This oblique right-hand side view illustrates the course of the parieto-occipital sulcus from its anteroventral junction with the medial surface of the calcarine sulcus, which it divides into anterior and posterior segments. The posterior calcarine sulcus is shown joining it inferiorly. Notice the pronounced increase in variability toward the exterior occipital surface. Such surface models can be rotated and magnified interactively by the viewer to enhance the appreciation of complex spatial relationships. C, Error maps showing reliability of structure delineation in multiple trials. The reliability of the contouring process was evaluated by repeatedly delineating the same structures in a randomly selected brain. Algorithms developed for calculating variability across subjects were used to map out local discrepancies, which occurred when contouring the same structure in multiple trials (n = 6). 3D surface models of the parieto-occipital, anterior, and posterior calcarine sulci are derived from the left hemisphere of the randomly selected brain. The color encodes the rms magnitude of the displacement vectors required to map the surface obtained in each trial onto the average of the surfaces obtained in multiple trials. Notice that the colorscale represents a range of variations 20 times smaller in magnitude than the intersubject variations shown in B. Note also the greater error in regions of higher differential curvature. Stability of individual geometric parameters across multiple trials, in conjunction with error maps of these and other structures, indicates that the variability in delineating sulcal trajectories represented a negligible fraction of the overall variability between subjects.
Fig. 9.
Fig. 9.
A–D, Stereotaxic extents of sulcal surfaces and their surface areas. These graphs illustrate the overall trends in spatial extent and area for the sulcal surfaces under examination. A–C, The total extent of each sulcus along each orthogonal dimension of Talairach space was measured in both left and right hemispheres. Error bars indicate SD measures. Note the marked symmetry of results for both hemispheres, as expected for the structures examined. Surface area measures are illustrated inD.
Fig. 10.
Fig. 10.
A, B, Indices of normalized curvature and fractal dimension for each sulcus. Trends in surface curvature and geometric complexity are shown for each sulcus. Fractal dimension is an extremely compact measure of surface complexity, condensing all the details of surface shape into a single numeric value, which summarizes the irregularity of the sulcal course inside the brain. Briefly, the measure reflects the rate at which the surface area of the sulcus increases as the scale of measurement is reduced. Despite differences in surface curvature, the paths into the brain of all of the primary sulci examined are strikingly similar in complexity.

Similar articles

Cited by

References

    1. Andreasen NC, Arndt S, Swayze V, Cizadlo T, Flaum M, O’Leary D, Ehrhardt JC, Yuh WTC. Thalamic abnormalities in schizophrenia visualized through magnetic resonance image averaging. Science. 1994;266:294–298. - PubMed
    1. Bailey P, von Bonin G (1951) The isocortex of man. Urbana: University of Illinois.
    1. Bookstein FL (1995) Proposal for a biometrics of the cortical surface: a statistical method for relative surface distance metrics. In: Proceedings of the SPIE Conference on Vision Geometry, Vol 2573, pp 312–323.
    1. Bookstein F, Chernoff B, Elder R, Humphries J, Smith G, Strauss R (1985) Morphometrics in evolutionary biology, Special publication 15. Academy of Natural Sciences of Philadelphia.
    1. Burzaco J. Stereotaxic pallidotomy in extrapyramidal disorders. Appl Neurophysiol. 1985;48:283–287. - PubMed

Publication types

LinkOut - more resources