Comparative Study
. 1996 Aug 15;16(16):5154-67.
doi: 10.1523/JNEUROSCI.16-16-05154.1996.

Neural mechanisms of visual working memory in prefrontal cortex of the macaque

Affiliations
Comparative Study

Neural mechanisms of visual working memory in prefrontal cortex of the macaque

E K Miller et al. J Neurosci. .

Abstract

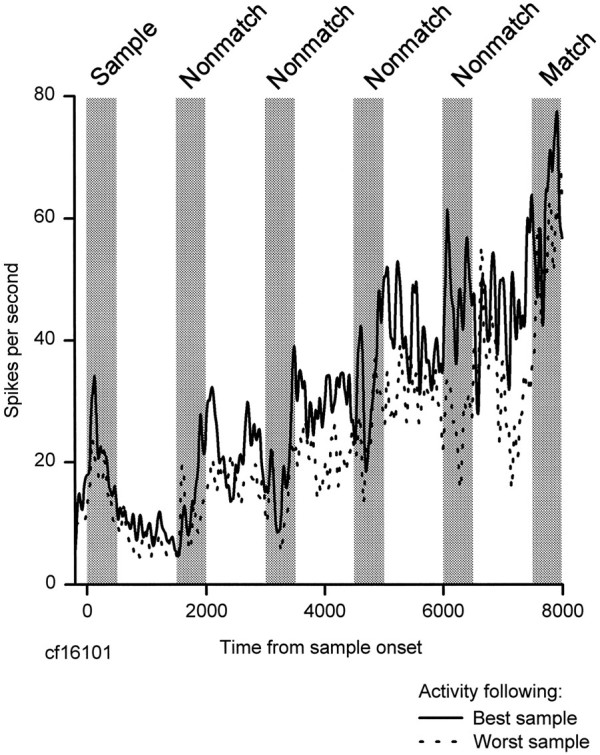
Prefrontal (PF) cells were studied in monkeys performing a delayed matching to sample task, which requires working memory. The stimuli were complex visual patterns and to solve the task, the monkeys had to discriminate among the stimuli, maintain a memory of the sample stimulus during the delay periods, and evaluate whether a test stimulus matched the sample presented earlier in the trial. PF cells have properties consistent with a role in all three of these operations. Approximately 25% of the cells responded selectively to different visual stimuli. Half of the cells showed heightened activity during the delay after the sample and, for many of these cells, the magnitude of delay activity was selective for different samples. Finally, more than half of the cells responded differently to the test stimuli depending on whether they matched the sample. Because inferior temporal (IT) cortex also is important for working memory, we compared PF cells with IT cells studied in the same task. Compared with IT cortex, PF responses were less often stimulus-selective but conveyed more information about whether a given test stimulus was a match to the sample. Furthermore, sample-selective delay activity in PF cortex was maintained throughout the trial even when other test stimuli intervened during the delay, whereas delay activity in IT cortex was disrupted by intervening stimuli. The results suggest that PF cortex plays a primary role in working memory tasks and may be a source of feedback inputs to IT cortex, biasing activity in favor of behaviorally relevant stimuli.


Figures

Fig. 1.
Fig. 1.
Outline of the DMS task. An example of a standard trial is illustrated in the top row, and an example of anABBA trial is shown in the bottom row. The number of nonmatching test items between the sample and the matching test item was random from trial to trial, ranging from zero to four. Although the stimuli are shown as line drawings, the actual stimuli in the experiment were color digitized pictures.
Fig. 2.
Fig. 2.
Location of recording sites in both monkeys.amt, Anterior middle temporal sulcus; sts, superior temporal sulcus; ls, lateral sulcus; cs, central sulcus; as, arcuate sulcus; ps, principal sulcus; orb, orbital sulcus. Scale bar, 1 cm. Shaded areas indicate extent of recording sites.
Fig. 3.
Fig. 3.
Example of fixation-related responses. Thetop histogram is from a cell with a phasic response at the time that the animal fixated the fixation target (time = 0). Thebottom histogram is from a cell with a sustained change in firing rate after fixation. Bin width, 10 msec. The horizontal line indicates time of sample presentation. Time is in milliseconds.
Fig. 4.
Fig. 4.
Response histograms of a PF neuron showing sample-selective delay activity. The gray bars indicate when each of the stimuli was presented. Time 0 indicates onset of the sample. Bin width, 10 msec. The baseline firing rate of this neuron was 13 spikes/sec.
Fig. 5.
Fig. 5.
Response histograms for a population of 40 PF neurons that had significant sample-selective delay activity. Responses are shown separately for trials in which the “best” stimulus was used as the sample and trials in which the “worst” stimulus was used as the sample. Bin width, 40 msec. The average baseline firing rate was 10 spikes/sec.
Fig. 6.
Fig. 6.
Distribution of indices showing the difference in delay activity after “best” and “worst” samples for the 40 PF neurons that showed significant sample-selective delay activity. The index is the difference in response to the best and worst sample divided by the sum of the two responses.
Fig. 7.
Fig. 7.
Average activity in the delay intervals in PF cortex and IT cortex when the “best” stimulus had been used as the sample and when the “worst” stimulus had been used as the sample. For this figure, “best” and “worst” were determined by the level of activity in the second delay interval. The error bars indicate the SEM. A shows the average delay activity for the 40 PF neurons with sample-selective delay activity; B shows the data for 25 IT neurons with sample-selective delay activity. The average baseline firing rate for the IT neurons was 5.5 spikes/sec.
Fig. 8.
Fig. 8.
Average stimulus responses and delay activity of two PF neurons with sample-selective delay activity. The hatched bars show the average responses to each of the six complex stimuli, and the open bars show the average activity in the delays when those stimuli were used as samples. The error bars indicate the SEM. The rank orders of stimulus responses and delay activity were in good correspondence for the cell illustrated in A, but in poor correspondence for the cell illustrated in B. The baseline firing rate for the cell in A was 10.3 spikes/sec, and for the cell in B 24.3 spikes/sec.
Fig. 9.
Fig. 9.
Examples of four different profiles of delay activity, taken from four different PF neurons. The top of the figure is a distribution of indices showing the difference in delay activity between the first and second halves of each delay interval for the 82 PF neurons that showed activity in the delays that was significantly above baseline firing rate. The index is the activity in the first half of the delay minus the activity in the second half of the delay divided by their sum. AD, Index values for the four single-cell examples shown in the bottomof the figure. The gray bars indicate nonmatch stimulus presentation intervals. The delay intervals illustrated were the intervals immediately after the first nonmatch stimulus in the sequence. Bin width, 10 msec. Baseline firing rates for these cells were 6.4 spikes/sec (A), 12.8 spikes/sec (B), 12 spikes/sec (C), and 5 spikes/sec (D).
Fig. 10.
Fig. 10.
Examples of three PF neurons with “climbing” delay activity (AC) and a neuron that showed the opposite trend, i.e., “decreasing” delay activity (D). The gray bars indicate stimulus presentation intervals. S, Sample; NM, nonmatch; M, match. Shown are data from trials in which three nonmatches intervened between the sample and final match. Bin width, 40 msec. The baseline firing rates for these neurons were 13.2 spikes/sec (A), 5.1 spikes/sec (B), 13.6 spikes/sec (C), and 10.4 spikes/sec (D).
Fig. 11.
Fig. 11.
Average responses across cells to the same set of stimuli appearing as samples and as matches and nonmatches after different numbers of intervening stimuli. Zero intervening stimuli refers to the first test stimulus after the sample in the sequence. The error bars indicate the SEM. A, Average responses to stimuli that elicited match enhancement. B, Average responses to stimuli that elicited match suppression.
Fig. 12.
Fig. 12.
Population average histograms for the matches, nonmatches, and repeated nonmatches for stimuli that elicited match enhancement. Bin width, 10 msec.
Fig. 13.
Fig. 13.
Distribution of indices showing the strength of the match-enhancement effect (A) and match-suppression effect (B) in PF cortex and IT cortex. The index is the absolute value of the difference between match and nonmatch responses divided by their sum.

References

    1. Andersen RA. Encoding of intention and spatial location in the posterior parietal cortex. Cereb Cortex. 1995;5:457–469. - PubMed
    1. Bauer RH, Fuster JM. Delayed-matching and delayed-response deficit from cooling dorsolateral prefrontal cortex in monkeys. J Comp Physiol Psychol. 1976;90:293–302. - PubMed
    1. Barash S, Bracewell RM, Fogassi L, Gnadt JW, Andersen RA. Saccade-related activity in the lateral intraparietal area. I. Temporal properties. J Neurophysiol. 1991a;66:1095–1108. - PubMed
    1. Barash S, Bracewell RM, Fogassi L, Gnadt JW, Andersen RA. Saccade-related activity in the lateral intraparietal area. II. Spatial properties. J Neurophysiol. 1991b;66:1109–1124. - PubMed
    1. Baylis GC, Rolls ET. Responses of neurons in the inferior temporal cortex in short term and serial recognition memory tasks. Exp Brain Res. 1987;65:614–622. - PubMed

Publication types

LinkOut - more resources