

Morphology and physiology of cortical neurons in layer I
- PMID: 8757242
- PMCID: PMC6578880
- DOI: 10.1523/JNEUROSCI.16-17-05290.1996
Morphology and physiology of cortical neurons in layer I
Abstract
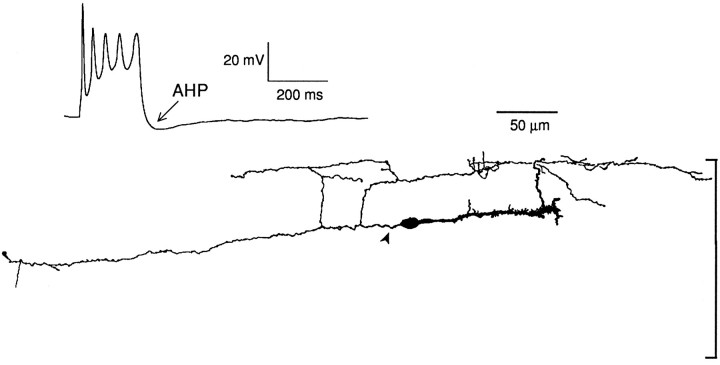
The electrophysiological and morphological properties of layer I neurons were studied in visual cortex slices from 7- to 19-d-old rats using whole-cell recording and biocytin labeling. A heterogeneous population of small, nonpyramidal neurons was found. Approximately one third of the cells we recorded were neurogliaform cells; another third were multipolar neurons with axons descending out of layer I. The remaining cells were heterogeneous and were not classified. In slices from 7- to 10-d-old animals only, we identified Cajal-Retzius cells. Neurogliaform neurons had a very dense local axonal field, which was largely contained within layer I. Cells with descending axons had a relatively sparse local axonal arbor and projected at least to layer II and sometimes deeper. Spiking in neurogliaform neurons was followed by an afterdepolarizing potential, whereas spiking in cells with descending axons was followed by a slow after-hyperpolarizing potential (AHP). In addition, neurogliaform cells exhibited less spike broadening and a larger fast AHP after single spikes than did cells with descending axons. Generally, cells in layer I received synaptic inputs characterized as either GABA- or glutamate-mediated, suggesting the presence of excitatory and inhibitory inputs. With their output largely limited to layer I, neurogliaform cells could synapse with other layer I neurons, the most distal dendritic branches of pyramidal cells, or the dendrites of layer II/III interneurons, which invade layer I. Cells with descending axons could contact a wide variety of cortical cells throughout their vertical projection.
Figures


Similar articles
-
Axonal projection, input and output synapses, and synaptic physiology of Cajal-Retzius cells in the developing rat neocortex.J Neurosci. 2002 Aug 15;22(16):6908-19. doi: 10.1523/JNEUROSCI.22-16-06908.2002. J Neurosci. 2002. PMID: 12177189 Free PMC article.
-
Physiological subgroups of nonpyramidal cells with specific morphological characteristics in layer II/III of rat frontal cortex.J Neurosci. 1995 Apr;15(4):2638-55. doi: 10.1523/JNEUROSCI.15-04-02638.1995. J Neurosci. 1995. PMID: 7722619 Free PMC article.
-
Physiological and morphological identification of somatostatin- or vasoactive intestinal polypeptide-containing cells among GABAergic cell subtypes in rat frontal cortex.J Neurosci. 1996 Apr 15;16(8):2701-15. doi: 10.1523/JNEUROSCI.16-08-02701.1996. J Neurosci. 1996. PMID: 8786446 Free PMC article.
-
Synapses, axonal and dendritic patterns of GABA-immunoreactive neurons in human cerebral cortex.Brain. 1990 Jun;113 ( Pt 3):793-812. doi: 10.1093/brain/113.3.793. Brain. 1990. PMID: 2194628 Review.
-
Mining the jewels of the cortex's crowning mystery.Curr Opin Neurobiol. 2020 Aug;63:154-161. doi: 10.1016/j.conb.2020.04.005. Epub 2020 May 29. Curr Opin Neurobiol. 2020. PMID: 32480351 Free PMC article. Review.
Cited by
-
GABAergic Interneurons in the Neocortex: From Cellular Properties to Circuits.Neuron. 2016 Jul 20;91(2):260-92. doi: 10.1016/j.neuron.2016.06.033. Neuron. 2016. PMID: 27477017 Free PMC article. Review.
-
Expression of calcium-binding proteins in layer 1 reelin-immunoreactive cells during rat and mouse neocortical development.J Histochem Cytochem. 2014 Jan;62(1):60-9. doi: 10.1369/0022155413509381. Epub 2013 Oct 16. J Histochem Cytochem. 2014. PMID: 24134921 Free PMC article.
-
Comparison of the Upper Marginal Neurons of Cortical Layer 2 with Layer 2/3 Pyramidal Neurons in Mouse Temporal Cortex.Front Neuroanat. 2017 Dec 21;11:115. doi: 10.3389/fnana.2017.00115. eCollection 2017. Front Neuroanat. 2017. PMID: 29311847 Free PMC article.
-
Neocortical Layer 1: An Elegant Solution to Top-Down and Bottom-Up Integration.Annu Rev Neurosci. 2021 Jul 8;44:221-252. doi: 10.1146/annurev-neuro-100520-012117. Epub 2021 Mar 17. Annu Rev Neurosci. 2021. PMID: 33730511 Free PMC article.
-
Inhibitory Regulation of Dendritic Activity in vivo.Front Neural Circuits. 2012 May 25;6:26. doi: 10.3389/fncir.2012.00026. eCollection 2012. Front Neural Circuits. 2012. PMID: 22654734 Free PMC article.
References
-
- Amitai Y, Friedman A, Connors BW, Gutnick MJ. Regenerative activity in apical dendrites of pyramidal cells in neocortex. Cereb Cortex. 1993;3:26–38. - PubMed
-
- Anderson JC, Martin KAC, Picanço-Diniz CW. The neurons in layer 1 of cat visual cortex. Proc R Soc Lond [Biol] 1992;248:27–33. - PubMed
-
- Bayer SA, Altman J. Development of layer I and the subplate in the rat neocortex. Exp Neurol. 1990;107:48–62. - PubMed
-
- Beaulieu C, Colonnier M. A laminar analysis of the number of round-asymmetrical and flat-symmetrical synapses on spines, dendritic trunks, and cell bodies in area 17 of the cat. J Comp Neurol. 1985;231:180–189. - PubMed
-
- Beaulieu C, Campistron G, Crevier C. Quantitative aspects of the GABA circuitry in the primary visual cortex of the adult rat. J Comp Neurol. 1994;339:559–572. - PubMed
Publication types
MeSH terms
Grants and funding
LinkOut - more resources
Full Text Sources
Other Literature Sources