

Differential expression of CD22 (Lyb8) on murine B cells
- PMID: 8757957
- PMCID: PMC2859887
- DOI: 10.1093/intimm/8.7.1121
Differential expression of CD22 (Lyb8) on murine B cells
Abstract
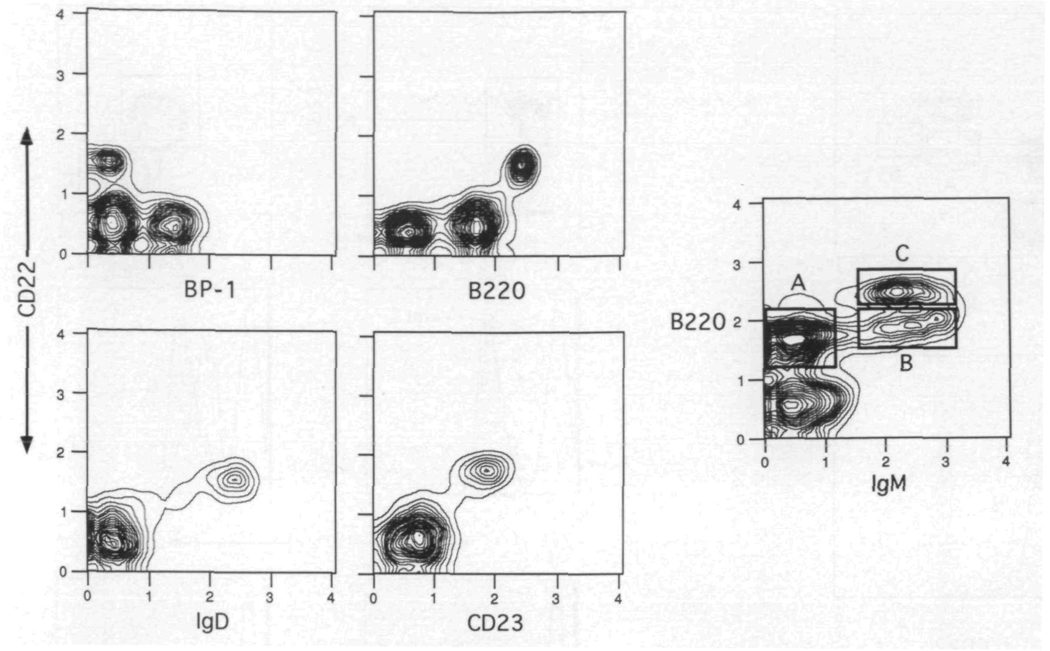
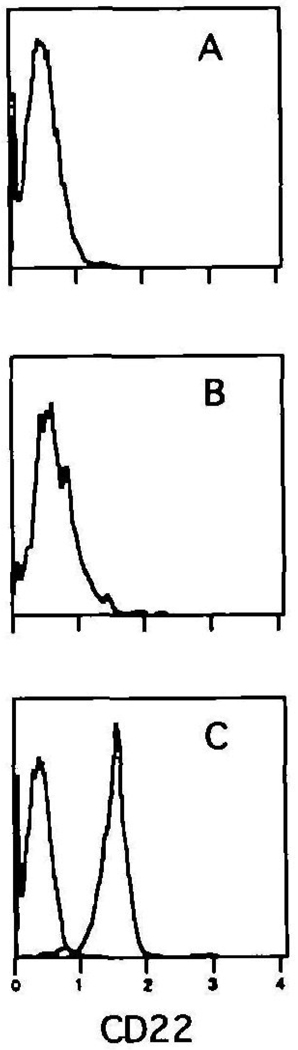
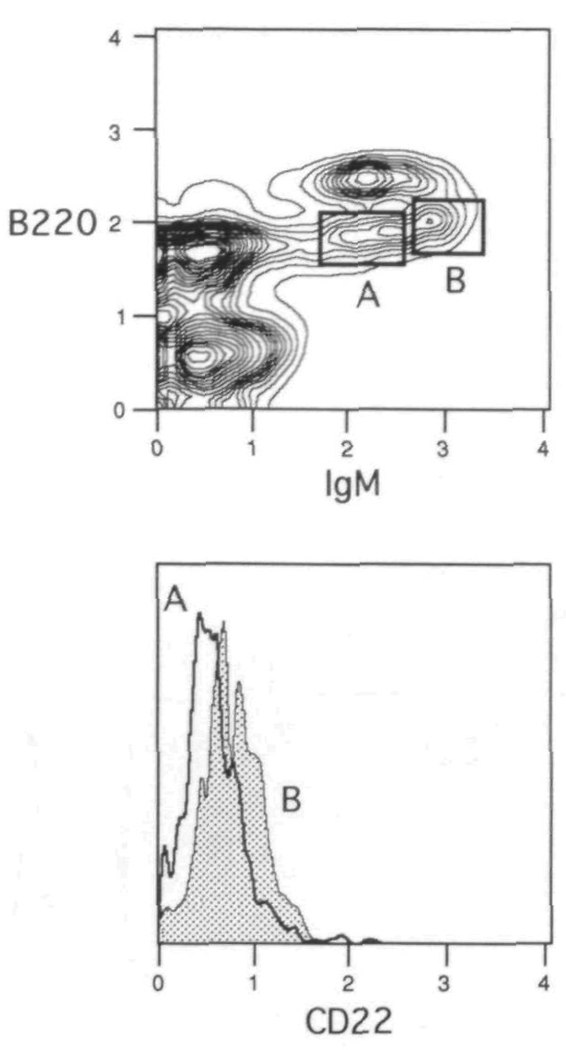
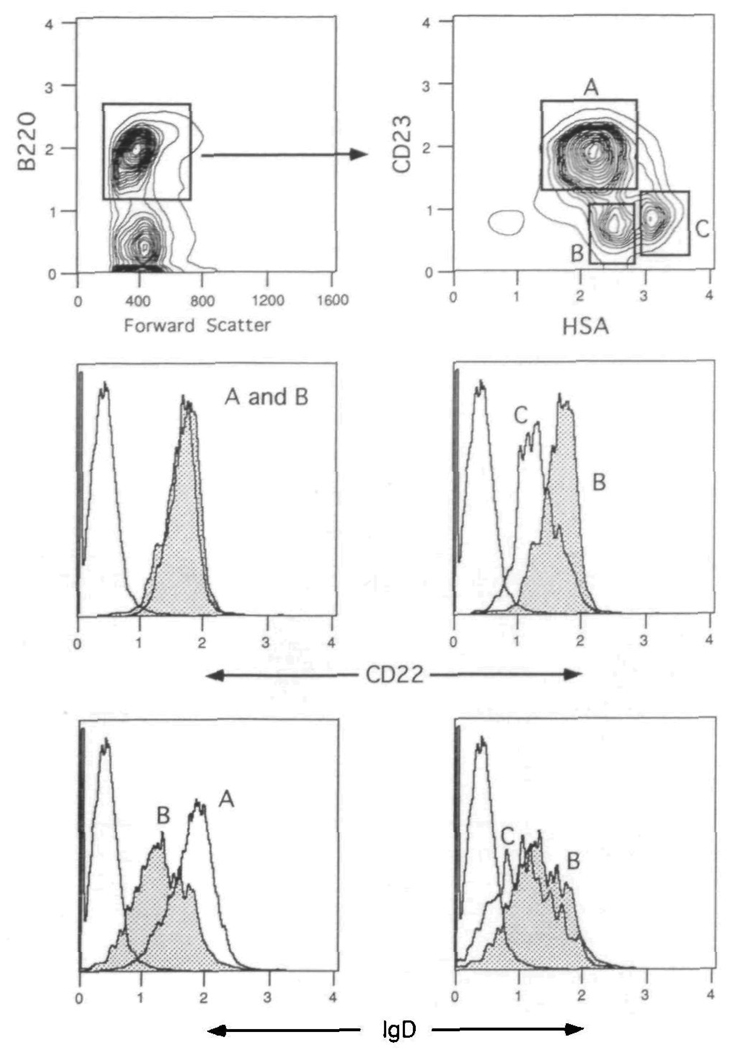
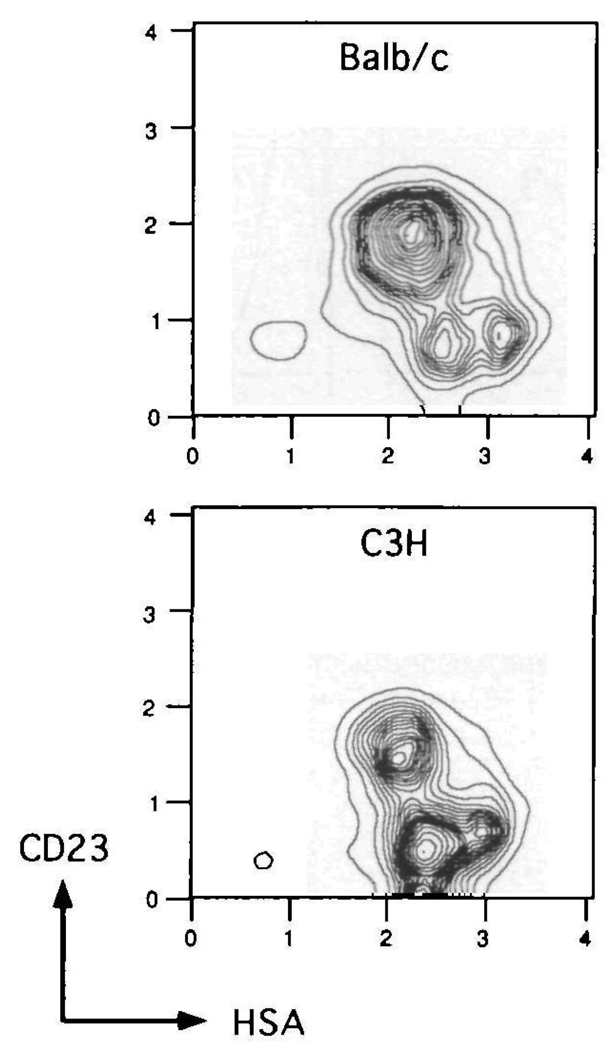
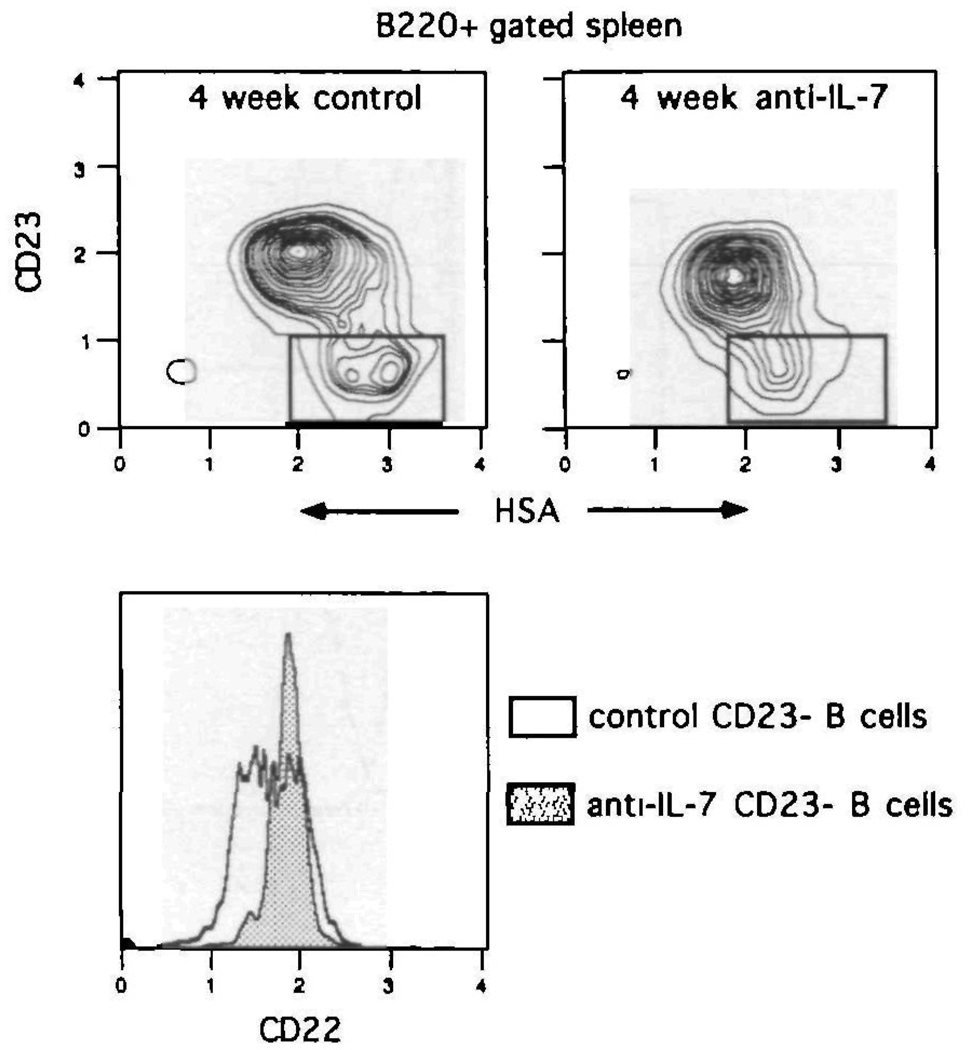
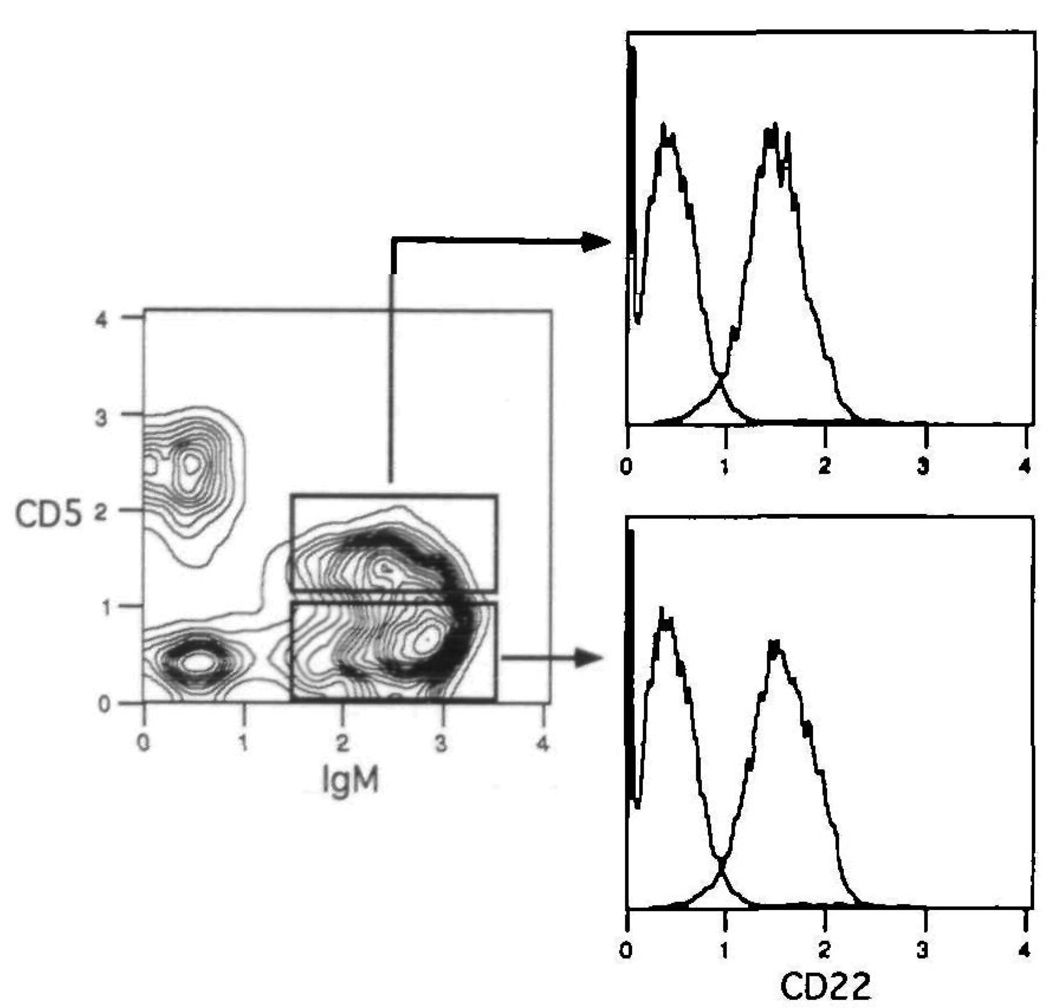
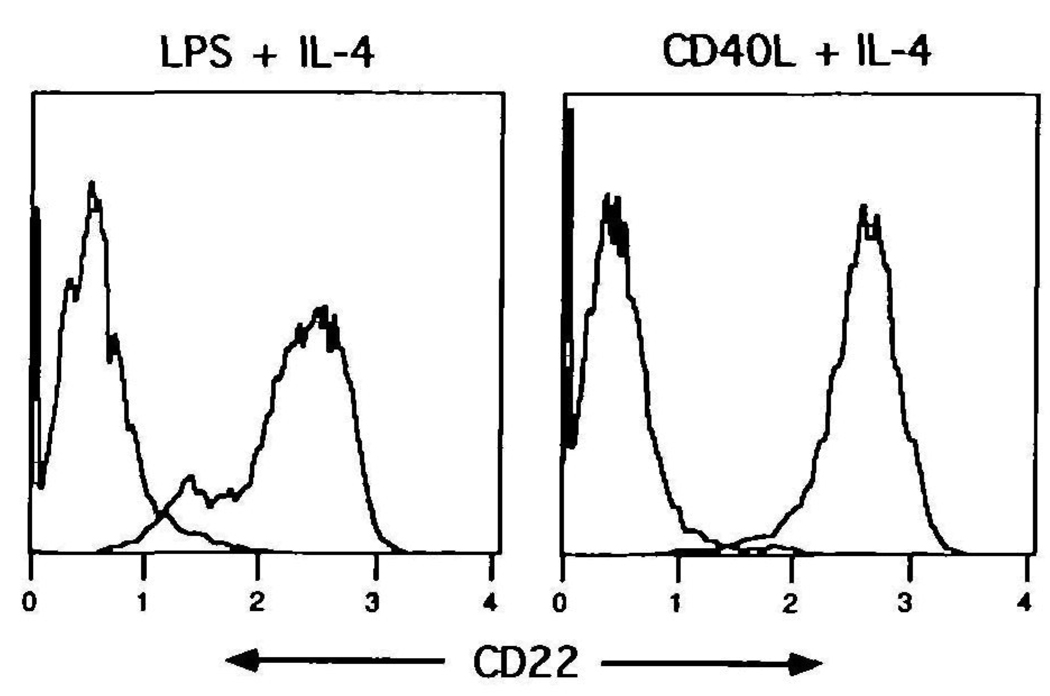
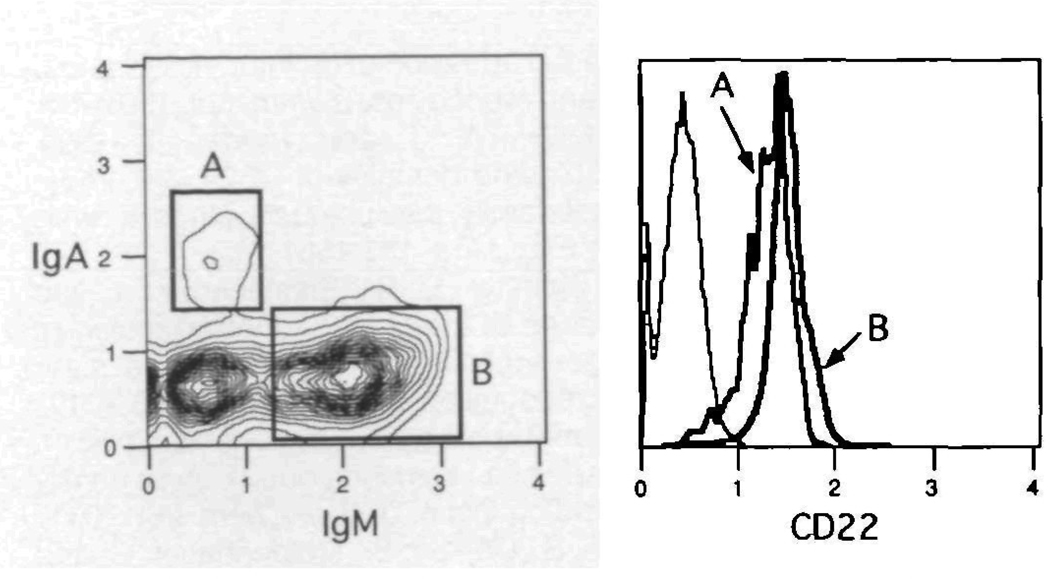
Previous studies have established the distribution, biochemistry and functional attributes of human CD22, a B cell-restricted glycoprotein. Recently, molecular cloning of the murine CD22 equivalent revealed this molecule to be the same as the previously described Lyb8 alloantigen. Using the anti-Lyb8 mAb Cy34.1.2, the present report documents the expression patterns of CD22 within the murine B cell compartment. The results demonstrate that in the bone marrow, murine CD22 is absent on the surface of pro-B cells, pre-B cells and newly emerging IgM+ B cells. CD22 is present at a low density on immature IgMhi B cells and fully expressed on mature recirculating B cells. In the periphery, murine CD22 is expressed at mature levels on all B cell subsets including follicular, marginal zone, B1 and switched B cells. Further studies showed CD22 to be retained on activated murine B cells for extended periods. Finally, in combination with CD23 and heat stable antigen, CD22 can be used to delineate the immature splenic B cells, and distinguish them from follicular and marginal zone cells. Together, the results demonstrate murine CD22 to be a useful pan marker for all mature B cell subsets.
Figures
Similar articles
-
Differentially regulated expression and function of CD22 in activated B-1 and B-2 lymphocytes.J Immunol. 2002 Jun 15;168(12):6078-83. doi: 10.4049/jimmunol.168.12.6078. J Immunol. 2002. PMID: 12055217
-
Identification of CD22 ligands on bone marrow sinusoidal endothelium implicated in CD22-dependent homing of recirculating B cells.J Exp Med. 1999 May 3;189(9):1513-8. doi: 10.1084/jem.189.9.1513. J Exp Med. 1999. PMID: 10224292 Free PMC article.
-
CD22 antigen: biosynthesis, glycosylation and surface expression of a B lymphocyte protein involved in B cell activation and adhesion.Int Immunol. 1991 Jul;3(7):623-33. doi: 10.1093/intimm/3.7.623. Int Immunol. 1991. PMID: 1716973
-
CD22, a B lymphocyte-specific adhesion molecule that regulates antigen receptor signaling.Annu Rev Immunol. 1997;15:481-504. doi: 10.1146/annurev.immunol.15.1.481. Annu Rev Immunol. 1997. PMID: 9143697 Review.
-
Regulation of lymphocyte activation by the cell-surface molecule CD22.Immunol Today. 1994 Sep;15(9):442-9. doi: 10.1016/0167-5699(94)90275-5. Immunol Today. 1994. PMID: 7945784 Review.
Cited by
-
Impact of Siglecs on autoimmune diseases.Mol Aspects Med. 2023 Apr;90:101140. doi: 10.1016/j.mam.2022.101140. Epub 2022 Aug 30. Mol Aspects Med. 2023. PMID: 36055802 Free PMC article. Review.
-
CD22 blockade aggravates EAE and its role in microglia polarization.CNS Neurosci Ther. 2024 May;30(5):e14736. doi: 10.1111/cns.14736. CNS Neurosci Ther. 2024. PMID: 38739106 Free PMC article.
-
A gammaherpesvirus Bcl-2 ortholog blocks B cell receptor-mediated apoptosis and promotes the survival of developing B cells in vivo.PLoS Pathog. 2014 Feb 6;10(2):e1003916. doi: 10.1371/journal.ppat.1003916. eCollection 2014 Feb. PLoS Pathog. 2014. PMID: 24516386 Free PMC article.
-
Immunodeficiency due to a unique protracted developmental delay in the B-cell lineage.Clin Diagn Lab Immunol. 1999 Mar;6(2):161-7. doi: 10.1128/CDLI.6.2.161-167.1999. Clin Diagn Lab Immunol. 1999. PMID: 10066647 Free PMC article.
-
Ectopic expression of a novel CD22 splice-variant regulates survival and proliferation in malignant T cells from cutaneous T cell lymphoma (CTCL) patients.Oncotarget. 2015 Jun 10;6(16):14374-84. doi: 10.18632/oncotarget.3720. Oncotarget. 2015. PMID: 25957418 Free PMC article.
References
-
- Clark EA. CD22, a B cell-specific receptor, mediates adhesion and signal transduction. J Immunol. 1993;150:4715. - PubMed
-
- Law CL, Sidorenko SP, Clark EA. Regulation of lymphocyte activation by the cell-surface molecule CD22. Immunol. Today. 1994;15:442. - PubMed
-
- Dörken B, Moldenhauer G, Pezzutto A, Schwartz R, Feller A, Kiesel S, Nadler LM. HD39 (B3), a B lineage-restricted antigen whole cell surface expression is limited to resting and activated human B lymphocytes. J Immunol. 1986;136:4470. - PubMed
-
- Moldenhauer G, Schwartz R, Dǒrken B, Hämmerling GJ. Biochemical characterization and epitope analysis of B-lymphocyte-specific surface antigens defined by clustering workshop monoclonal antibodies. In: McMichael AJ, editor. Leucocyte Typing III White Cell Differentiation Antigens. Oxford: Oxford University Press; 1987. p. 378.
-
- Boué DR, Lebien TW. Structural characterization of the human B lymphocyte-restricted differentiation antigen CD22 Comparison with CD21 (complement receptor type 2/Epstein-Barr virus receptor) J. Immunol. 1988;140:192. - PubMed
Publication types
MeSH terms
Substances
Grants and funding
LinkOut - more resources
Full Text Sources
Other Literature Sources
Molecular Biology Databases
