. 1996 Aug 1;16(15):4617-24.
doi: 10.1523/JNEUROSCI.16-15-04617.1996.

Selective G-protein regulation of neuronal calcium channels

Affiliations

Selective G-protein regulation of neuronal calcium channels

P T Toth et al. J Neurosci. .

Abstract

We examined the properties and regulation of Ca channels resulting from the expression of human alpha1B and alpha1E subunits stably expressed in KEK293 cells. The ancillary subunits beta1B and alpha2/delta were also stably expressed in these cell lines. Ca currents in alpha1B-expressing cells had the properties of N-type currents. Ca currents in cells expressing alpha1E exhibited a novel profile that was similar to the properties of the "R type" Ca current. Introduction of GTP-gamma-S into alpha1B cells greatly enhanced the extent of prepulse facilitation of the Ca current, whereas it had only a very small effect in alpha1E-expressing cells. Activation of somatostatin receptors endogenous to HEK293 cells or kappa opioid receptors, expressed in the cells after transfection, inhibited Ca currents in alpha1B-expressing cells. This inhibition was blocked by pertussis toxin and was partially relieved by a depolarizing prepulse. In contrast, no inhibitory effects were noted in cells expressing alpha1E channels under the same circumstances. HEK293 cells normally contained G-proteins from all of the four major families. Inhibition of Ca currents by kappa agonists in alpha1B-expressing cells was enhanced slightly by the cotransfection of several G-protein alpha subunits. kappa agonists, however, had no effect in alpha1E-containing cells, even after overexpression of different G-protein alpha-subunits. In summary, these results demonstrate that there is a large difference in the susceptibility of alpha1B- and alpha1E-based Ca channels to regulation by G-proteins. This is so despite the fact that the two types of Ca channels show substantial similarities in their primary sequences.


Figures

Fig. 1.
Fig. 1.
Ca currents in HEK293 cells expressing the α1B and α1E Ca channel subunits. A, Run-up with intracellular GTP using Ca (5 mm) as the charge carrier in HEK293 cells expressing the α1B Ca channel subunit. Currents were evoked from a holding potential of −90 mV by 200 msec depolarizing pulses to +10 mV every 20 sec. B, Average normalized current with 1 mm GTP (▪) or 0.3 mm GTP-γ-S (▴) in the patch pipette. The run-up of currents from individual experiments was normalized with respect to the first peak current obtained. The normalized values were then averaged, and the mean ± SEM was plotted (1 mm GTP, n = 11; 0.3 mm GTP-γ-S, n = 6). C, D, Relief of GTP-γ-S-induced inhibition of α1B Ca currents by an intervening prepulse depolarization. Ca currents were evoked using a double-pulse protocol without (C, lower trace) or with (D,lower trace) a depolarizing prepulse using GTP-γ-S (0.3 mm) in the patch pipette. The intervening depolarization increased the current amplitude during the second pulse (D, lower trace). Upper lines inC and D are the voltage templates (HP = −90 mV; TP = +10 mV; TP duration = 25 msec; prepulse depolarization potential = +80 mV; duration = 50 msec). P1 and P2 denote the current integrals during the first and second test pulses and are used as such in Figure 2. E, Characteristics of Ca current run-up in cells expressing α1Esubunit. Plot of averaged Ca current amplitude (mean ± SEM) in the presence of GTP-γ-S (▴, 0.3 mm;n = 15) or GTP (▪, 1 mm;n = 6). Calculations as in B. F, Superimposed Ca2+ current traces evoked by the double-pulse voltage protocol with or without a depolarizing prepulse (1 mm GTP in the patch pipette). The Ca current following the prepulse depolarization was actually smaller than without it in the cell line expressing α1Esubunit.
Fig. 2.
Fig. 2.
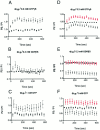
Comparison of the effect of different GTP analogs on the α1B (A–C) and α1E (D–F) Ca current using the double-pulse protocol (see Fig. 1C,D). Currents were evoked every 20 sec in HEK293 cells expressing the α1Bsubunit by applying the double-pulse voltage protocol with GTP-γ-S (A), GDPβS (B), or GTP (C) in the patch pipette. The P2/P1 ratios from individual cells were calculated, and then the isochronal values were averaged during the time course of the experiments from cells in which experiments were carried out under identical conditions. The mean ± SE is plotted; ▪ denotes the P2/P1 ratio without the prepulse, ▴ denotes the ratio with the prepulse. GTP analogs were applied in the following concentrations: GTP-γ-S (0.3 mm; n = 5); GDPβS (0.3 mm; n = 7); GTP (1 mm; n = 11). D–F, Effect of GTP analogs on α1E Ca currents using the double-pulse protocol. Plot of the average P2/P1 ratios in the presence of GTP-γ-S, 0.3 mm (n = 15; D), GDPβS, 0.3 mm(n = 7; E), and GTP, 1 mm (n = 6; F). Note that the values of P2/P1 ratios after prepulse application (▴) fell below those of P2/P1 values obtained without the prepulse depolarization (▪) (black data sets on D–F).D–F, ▴ red data sets show P2/P1 ratios with prepulse after “subtraction” of voltage-dependent inactivation obtained from data with GDPβS in the patch pipette.
Fig. 3.
Fig. 3.
Effect of SOM on α1B-type and α1E Ca currents. A, Plot of α1B-type Ca current versus time showing a typical SOM (300 nm) response. Cell was depolarized from −90 HP to +10 TP every 20 sec. Inset shows Ca currents recorded before and during SOM application. Bshows α1B-type Ca currents evoked by the double-pulse protocol in the presence of SOM (300 nm). Decreased inhibition can be seen after the prepulse. C, Plot of α1E-type Ca current versus time: SOM had little or no effect on the Ca current.D, Average responses (mean ± SEM) to SOM (300 nm) application. The number in parentheses represents the number of experiments.
Fig. 4.
Fig. 4.
Effects of the κ receptor-selective agonist U69593 on κ receptor-transfected HEK293 cells expressing α1B and α1E Ca channels. Average responses (mean ± SEM) to U69593 (200 nm); n = number of cells showing response to κ receptor agonist application (left to right, bars 1, 3, and 4) or all cells tested (bars 2 and 5). In experiments in which the blocking effect of nor-BNI was examined, cells were also transfected with the α subunit of Go (see below). In the experiments examining the blocking effect of PTX (200 ng/ml overnight), cells were also transfected with the α-subunit of Gi2 (see text).
Fig. 5.
Fig. 5.
Effect of G-protein α subunit overexpression on Ca current inhibition by κ receptor activation in cells expressing α1B Ca channels. A–C, Plots of Ca current versus time. Insets show Ca current traces at the points indicated before and during the application of the κ receptor agonist U69593 (200 nm). HEK293 cells were transfected with only the κ receptor (A), κ receptor + Giα1 (B), κ receptor + G (C), and κ receptor + Giα3 (D). D, Superimposed control and inhibited (U69593; 200 nm) Ca current traces from a cell expressing the α1B Ca channel, κ receptor, and Giα3. The U69593 inhibition was partially relieved by a prepulse depolarization (see Fig. 2).
Fig. 6.
Fig. 6.
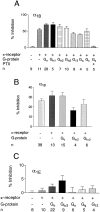
A, Average inhibition (mean ± SEM) of α1B Ca currents by U69593 (200 nm) in HEK293 cells expressing α1B Ca channels, different G-protein α subunits, and the κ opioid receptor. n denotes the number of cells showing agonist responses, except the first and last bars, where all of the responses were averaged. B, Inhibitory effects (mean ± SEM) of SOM (300 nm) in HEK293 cells expressing α1B Ca channels, κ receptors, and various G-protein α subunits. n denotes the number of responsive cells. C, Average inhibition (mean ± SEM) of the Ca current by U69593 (200 nm) in HEK293 cells expressing α1E Ca channels, κ receptors, and different G-protein α subunits. n = total number of cells.

Similar articles

Cited by

References

    1. Andersson S, Davis DL, Dahlback H, Jornvall H, Russell DW. Cloning, structure and expression of the mitochondrial cytochrome P-450 sterol 25-hydroxylase, a bile acid biosynthetic enzyme. J Biol Chem. 1989;264:8222–8229. - PubMed
    1. Ausubel FM, Brent R, Kingston RE, Moore DD, Seidman JG, Smith JA, Struhl K. Current protocols in molecular biology, Wiley; New York: 1993. Transfection of DNA into eukaryotic cells. pp. 9.1.1–9.1.7.
    1. Avidor-Reiss T, Zippel R, Levy R, Saya D, Ezra V, Barg J, Matus-Leibovitch N, Vogel Z. κ-opioid receptor transfected cell lines: modulation of adenylyl cyclase activity following acute and chronic opioid treatment. FEBS Lett. 1995;361:70–74. - PubMed
    1. Bean BP. Neurotransmitter inhibition of neuronal calcium channels by changes in channel voltage dependence. Nature. 1989;340:153–156. - PubMed
    1. Berrow NS, Campbell V, Fitzgerald EM, Brickley K, Dolphin AC. Antisense depletion of β subunits modulates the biophysical and pharmacological properties of neuronal calcium channels. J Physiol (Lond) 1995;482:481–491. - PMC - PubMed

Publication types

LinkOut - more resources