. 1996 Sep 15;16(18):5567-82.
doi: 10.1523/JNEUROSCI.16-18-05567.1996.

Multiple channel types contribute to the low-voltage-activated calcium current in hippocampal CA3 pyramidal neurons

Affiliations

Multiple channel types contribute to the low-voltage-activated calcium current in hippocampal CA3 pyramidal neurons

R B Avery et al. J Neurosci. .

Abstract

Hippocampal neurons exhibit low-voltage-activated (LVA) and high-voltage-activated (HVA) calcium currents. We characterized the LVA current by recording whole-cell Ca2+ currents from acutely isolated rat hippocampal CA3 pyramidal neurons in 2 mM Ca2+. Long depolarizing steps to -50 mV revealed two components to the LVA current: transient and sustained. The transient phase had a fast decay time constant of 59 msec. The sustained phase persisted throughout the depolarization, even for steps lasting several seconds. The transient current was inhibited by the classic T-type channel antagonists Ni2+ and amiloride. The anticonvulsant phenytoin preferentially blocked the sustained phase, but ethosuximide had no effect. Steady-state inactivation of the transient component was half-maximal at -80 mV. Nimodipine, an L-type channel antagonist, partly inhibited the sustained current. BayK-8644, an L-type channel agonist, potentiated the sustained current. Calciseptine, another L-type channel antagonist, inhibited the sustained component. omega-Conotoxin-MVIIC, a nonselective toxin for HVA channels, had no effect on either of the LVA current components. omega-Grammotoxin-SIA, another nonselective toxin, partially inhibited the sustained component. The voltage dependence of activation of the nimodipine-sensitive current could be fit with a single Boltzmann, consistent with a homogenous population of L-type channels in CA3 neurons. Half-maximal activation of the nimodipine-sensitive current occurred at -30 mV, considerably more negative than the remaining HVA current. These results suggest that in physiologic Ca2+ more than one type of Ca2+ channel contributes to the LVA current in CA3 neurons. The transient current is carried by T-type channels. The sustained current is carried, at least in part, by dihydropyridine-sensitive channels. Thus, the designation "low-voltage-activated" should not be limited to T-type channels. These findings challenge the traditional designation of L-type channels as exclusively HVA and reveal a possible role in subthreshold Ca2+ signaling.


Figures
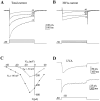
Fig. 1.
Fig. 1.
Ca2+ currents in CA3 pyramidal neurons. A, Currents elicited from a holding potential of −80 mV. Currents had a prominent inactivating component. B, Currents elicited from a holding potential of −50 mV were smaller and showed much less inactivation during 600 msec steps. C, I–Vplot for cell shown in A. The peak of the current is plotted as a function of the test potential for holding potentials of −80 mV (•) and −50 mV (○). Note the shoulder at negative potentials, indicating activation of LVA channels. On average, the maximum amplitude of current evoked from −80 mV was 413 pA and occurred at −8 mV. The peak of the I–V from a holding potential of −50 mV averaged 224 pA and occurred at −9 mV (n = 13).D, Steps to −50 mV elicited an LVA current with two components: transient and sustained. The decay during the transient phase could be best fit with two exponentials. The faster term had an average decay time constant of 59 msec. The second term averaged 217 msec but was quite variable. The bottom trace shows the sustained current persisting throughout a 3 sec depolarization.
Fig. 2.
Fig. 2.
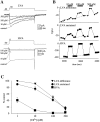
Strategy for measuring components of the Ca2+ current. A, LVA currents were evoked by holding at −80 mV and depolarizing to −50 mV. The noninactivating current was measured as the amplitude of the current remaining at the end of a 600 msec step. This was called the sustainedcomponent. The amplitude of the inactivating component was estimated by taking the difference between the peak of the LVA current and the sustained current. This was called the difference component. The mean amplitude of the difference component was 34 ± 19 pA, and the mean amplitude of the sustained component was 23 ± 11 pA (n = 68). B, HVA currents were isolated by holding at −50 mV and stepping to 0 mV. The peak of the HVA current averaged 224 ± 125 pA (n = 63). C, Tail currents upon repolarizing to −80 mV. Cells were held at either −50 or −80 mV, stepped to 0 mV for 30 msec, and then repolarized to −80 mV. When held at −50 mV, the amplitude of the slow component averaged 2.3% of the total tail amplitude (n = 7), indicating that T-type channels do not contribute significantly to the measure of HVA current. The first 200 μsec of repolarization has been blanked out. D, Pharmacology of the HVA current. Sequential applications of nimodipine, ω-conotoxin-GVIA + nimodipine, ω-agatoxin-IVA + nimodipine, and ω-conotoxin-MVIIC + nimodipine are indicated. When adjusted for the estimated current rundown, the average block of each of these antagonists was 41% for nimodipine (10 μm), 28% for ω-CTx-GVIA (5 μm), 15% for ω-AgaTx-IVA (200 nm), and 8% for ω-CTx-MVIIC (10 μm), with 7% resistant to all blockers (n = 3).
Fig. 3.
Fig. 3.
Cd2+ was less effective at blocking LVA currents. A, Current traces taken in the presence of control, 10, 100, and 500 μmCd2+. The top set of traces shows LVA currents.Bottom traces show the effects of the same applications on HVA currents. For the HVA current, the 100 and 500 μmtraces are indistinguishable. Note the initial transient in the 10 μm trace (arrow), indicating time-dependent equilibration of the block to the new membrane potential. B, Time course of current component amplitudes from the same cell as inA. The amplitude of the LVA difference component(top), LVA sustained component (middle), and HVA peak (bottom) are plotted as a function of time, with 0 corresponding to the start of whole-cell recording. Dotted lines during the 100 μm exposure demonstrate how the baseline was extrapolated for measurements. C, Dose–response relationship for Cd2+ for the measured current components. Current amplitudes are normalized to the estimated baseline amplitude. The percent of the control amplitude of the LVA difference (▾), LVA sustained (•), and HVA components (▪) are plotted as a function of Cd2+ concentration. Error bars in all figures represent SEM. The HVA current was much more sensitive (IC50 < 1 μm) to Cd2+ than the two LVA current components, which were equally sensitive (IC50 ≈ 100 μm). The amplitude of the current (as a percent of the control value) in the presence of Cd2+ was 1 μm: LVA difference 106%, LVA sustained 95% (n = 6), HVA 44% (n = 6); 10 μm: LVA difference 97%, LVA sustained 78% (n = 8), HVA 10% (n = 9); 100 μm: LVA difference 50%, LVA sustained 42% (n = 8), HVA 2% (n = 9); 500 μm: LVA difference 12%, LVA sustained 22% (n = 8), HVA 4% (n = 10).
Fig. 4.
Fig. 4.
Ni2+ preferentially inhibited the LVA difference component. A, Current traces taken in the presence of control, 10, 50, and 500 μm Ni2+. The top set of traces shows LVA currents. Bottomtraces show the effects of the same applications on HVA currents. At a given concentration, Ni2+ was most effective at blocking the transient component of the LVA current (for example, see the 50 μm trace). B, Time course of current component amplitudes from the same cell in A. The amplitude of the LVA difference component (top), LVA sustained component(middle), and HVA peak (bottom) are plotted as a function of time. Dotted lines during the 50 μm exposure demonstrate how the baseline was extrapolated for measurements. C, Dose–response relationship for Ni2+ for the measured current components. Effects on LVA difference (▾), LVA sustained (•), and HVA components (▪) are plotted as a function of Ni2+ concentration. The LVA difference component was more sensitive than the other current components, with 10 μm < IC50 < 50 μm. The LVA sustained and HVA components shared similar sensitivities to Ni2+, with 100 μm < IC50 < 500 μm. The amplitude of the current (as a percent of the control value) in the presence of Ni2+was 10 μm: LVA difference 69%, LVA sustained 93% (n = 6), HVA 90% (n = 8); 50 μm: LVA difference 33%, LVA sustained 77% (n = 6), HVA 89% (n = 5); 100 μm: LVA difference 25%, LVA sustained 63% (n = 6), HVA 77% (n = 7); 500 μm: LVA difference 6%, LVA sustained 32% (n = 6), HVA 33% (n = 6).
Fig. 5.
Fig. 5.
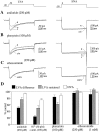
Effects of putative T-channel blockers.A, Traces showing the effects of amiloride (250 μm). LVA currents are shown on the left. HVA currents from the same application are on the right. Traces are labeled as control (c), drug (d), or wash(w). The inactivating component of the LVA current was affected most strongly by amiloride. B, Effects of phenytoin (100 μm). Phenytoin most strongly blocked the LVA sustained current. C, Effect of ethosuximide (250 μm). No current components were affected. D, Summary data for putative T-channel blockers. The bar heightindicates the amplitude of the current as a percentage of the control amplitude. Bars represent LVA difference (black), LVA sustained (gray), and HVA (white) current components. Amiloride, either alone or with Ni2+, most strongly blocked the LVA difference component. The amplitude of the current (as a percent of the control value) in the presence of drug was 250 μm: LVA difference 51%, LVA sustained 77% (n = 5), HVA 95% (n = 7); amiloride (250 μm) + Ni2+ (50 μm): LVA difference 24%, LVA sustained 70%, HVA 75% (n = 3). Phenytoin (100 μm) affected all components but had its greatest effect on the LVA sustained component (LVA difference 84%, LVA sustained 62%, HVA 88%; n = 6). Ethosuximide, at concentrations up to 1 mm, had no effect on any current component. The amplitude of the current in the presence of ethosuximide was 250 μm: LVA difference 96%, LVA sustained 103%, HVA 98% (n = 3); 1 mm: LVA difference 92%, LVA sustained 106%, HVA 96% (n = 3).
Fig. 6.
Fig. 6.
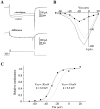
Steady-state inactivation of T-type Ca2+ channels.  A, Traces showing the dependence of LVA currents on the holding potential. The membrane potential was stepped to −50 mV from holding potentials ranging from −70 to −120 mV. The amplitude of the difference component increased steeply with holding potentials negative to −70 mV. B, Steady-state inactivation curve. Steady-state inactivation was determined from experiments like that shown in A. The amplitude of the difference component of the LVA current was measured as a function of holding potential. The amplitude of the current was normalized to the maximum difference current. The symbols (▪) represent pooled data from eight cells. The curve is a least-squares fit to the Boltzmann function: G/Gmax = 1/[1 + exp((V − V1/2)/k)], in whichV1/2 is the half-maximum voltage andk is the slope factor. The best fit was achieved withV1/2 = −80 mV and k = −6.4 mV.
Fig. 7.
Fig. 7.
A, Traces showing the effects of nimodipine (10 μm). LVA currents are shown on the left. HVA currents from the same application are on the right. Traces are labeled as control (c) or drug (d). Nimodipine partially inhibited the LVA sustained component without affecting the LVA difference component. The HVA current was also partially reduced. B, Effects of BayK-8644 (1 μm). BayK-8644 potentiated the LVA sustained current and the HVA current, but the LVA difference current was insensitive.C, Summary data for nimodipine and BayK-8644. Amplitudes of each current component during the application are plotted as a fraction of their control values. DHPs had no effect on the LVA difference component, but the LVA sustained component was modulated similarly to the HVA current. Both were reduced by nimodipine and enhanced by BayK [10 μm nimodipine: LVA difference 100%, LVA sustained 64% (n = 8); HVA 72% (n = 20); 1 μm BayK-8644: LVA difference 95%, LVA sustained 134% (n = 3); HVA 113%, (n = 6)]. The block by coapplying Ni2+ (100 μm) and nimodipine (10 μm) was nearly additive (when compared to their individual effects), indicating that they blocked different types of channels [LVA difference 23%, LVA sustained 31% (n = 4); HVA 52% (n = 6)].
Fig. 8.
Fig. 8.
Activation of nimodipine-sensitive current.A, Example of data used to generate the plot inC. Top traces show currents recorded in control and nimodipine (10 μm) with steps to 0 mV.Bottom trace is the difference of the top traces, representing the nimodipine-sensitive current. The amplitude of the nimodipine-sensitive current was determined for each test potential by measuring the amplitude of the difference current at 120 msec(arrows). B, I–V relations for nimodipine-sensitive and insensitive currents in a single cell. As shown in A, cells were held at −100 mV and stepped to potentials between −70 and +20 mV. The series was repeated in the presence of 10 μm nimodipine and after several minutes of washing. The amplitude of the nimodipine-sensitive current was measured at each step potential by subtracting the amplitude of the current in nimodipine from the average of the control and wash currents.Solid line is the total current amplitude (control) at each test potential, measured at 120 msec. Dotted line is the current amplitude in the presence of 10 μm nimodipine.Filled circles (•) represent the difference current (nimodipine-sensitive). C, Steady-state activation curve for the nimodipine-sensitive current. The current amplitude was converted to a chord conductance by assuming a Ca2+reversal potential extrapolated from the linear, positive slope region of the I–V curve (approximately +25 mV for this cell). The chord conductance at each potential was normalized to the maximum conductance, and the normalized values were averaged for each step potential. The symbols (•) represent pooled data from six cells. The solid line is a least-squares fit to the Boltzmann function with V1/2 = −30 mV andk = 6.0 mV. The dotted line is the least-squares fit for the sustained current resistant to nimodipine (V1/2 = −19 mV, k = 6.3 mV).
Fig. 9.
Fig. 9.
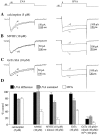
Toxins block the LVA sustained component.A, Effects of the L-channel antagonist calciseptine. LVA currents are shown on the left. HVA currents from the same application are on the right. Traces are labeled as control(c) or drug (d). Calciseptine (5 μm) partially inhibited the LVA sustained and HVA currents but did not affect the LVA difference current. B, Effects of the nonspecific HVA antagonist ω-conotoxin-MVIIC (μm). The LVA current was not affected, but the HVA current was strongly reduced. C, Effects of the HVA antagonist ω-grammotoxin-SIA (ω-GsTx-SIA, 10 μm). The LVA sustained current was partially inhibited. The HVA current was strongly reduced. D, Summary data for three toxins. Calciseptine reduced the LVA sustained component (78%,n = 4) and the HVA current (79%, n = 5) but spared the LVA difference component (94%, n = 4). ω-CTx-MVIIC did not affect the LVA current (LVA difference 98%, LVA sustained 101%; n = 7) but did reduce the HVA current (39%, n = 10). ω-GsTx-SIA partially reduced the LVA sustained component (74%, n = 3) and LVA difference component (84%, n = 3). The HVA current was also reduced (42%, n = 3). The combination of ω-GsTx-SIA (10 μm) + nimodipine (10 μm) + Ni2+ (100 μm) strongly blocked all current components (LVA difference 17%, LVA sustained 24%, HVA 5%;n = 3).

Similar articles

Cited by

References

    1. Armstrong CM, Matteson DR. Two distinct populations of calcium channels in a clonal line of pituitary cells. Science. 1985;227:65–67. - PubMed
    1. Artalejo CR, Dahmer MK, Perlman RL, Fox AP. Two types of Ca2+ currents are found in bovine chromaffin cells: facilitation is due to the recruitment of one type. J Physiol (Lond) 1991;432:681–707. - PMC - PubMed
    1. Bossu J-L, Feltz A. Inactivation of the low-threshold transient calcium current in rat sensory neurones: evidence for a dual process. J Physiol (Lond) 1986;376:341–357. - PMC - PubMed
    1. Brown AM, Tsuda Y, Wilson DL. A description of activation and conduction in calcium channels based on tail and turn-on current measurements in the snail. J Physiol (Lond) 1983;344:549–583. - PMC - PubMed
    1. Byerly L, Chase PB, Stimers JR. Calcium current activation kinetics in neurones of the snail Lymnaea stagnalis . J Physiol (Lond) 1984;348:187–207. - PMC - PubMed

Publication types

LinkOut - more resources