. 1996 Sep 15;16(18):5661-71.
doi: 10.1523/JNEUROSCI.16-18-05661.1996.

Determinants of the time course of facilitation at the granule cell to Purkinje cell synapse

Affiliations

Determinants of the time course of facilitation at the granule cell to Purkinje cell synapse

P P Atluri et al. J Neurosci. .

Abstract

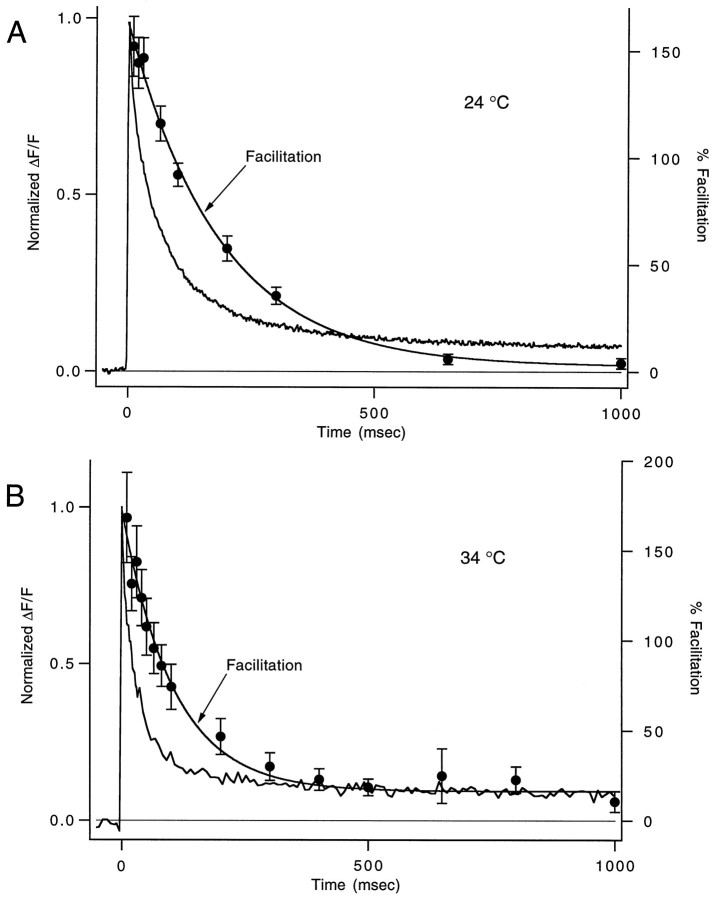
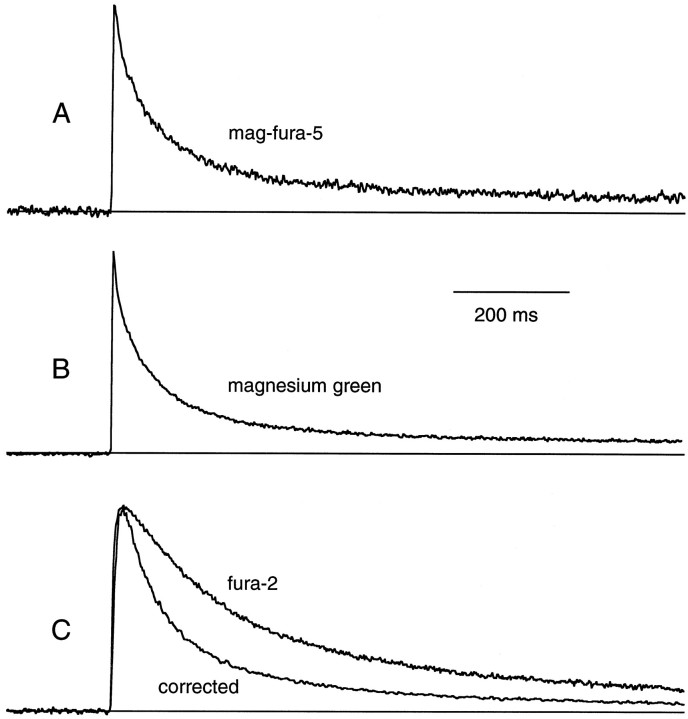
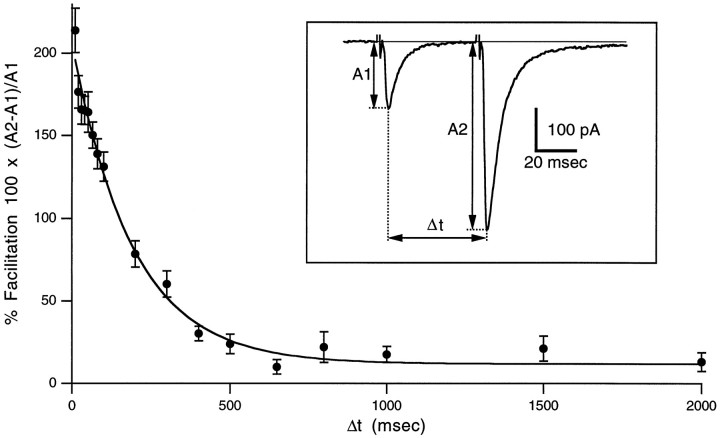
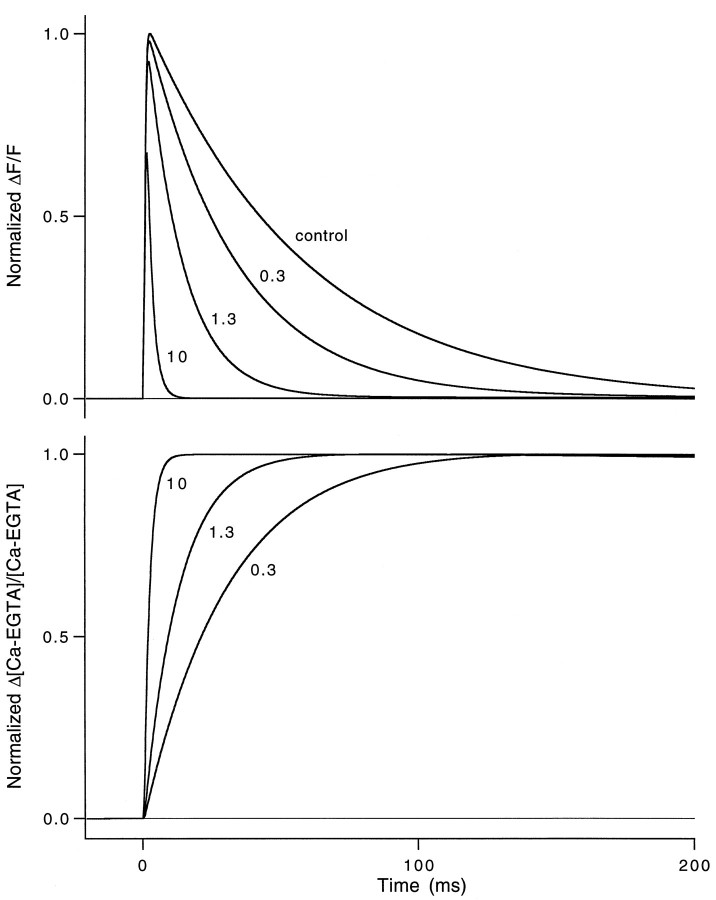
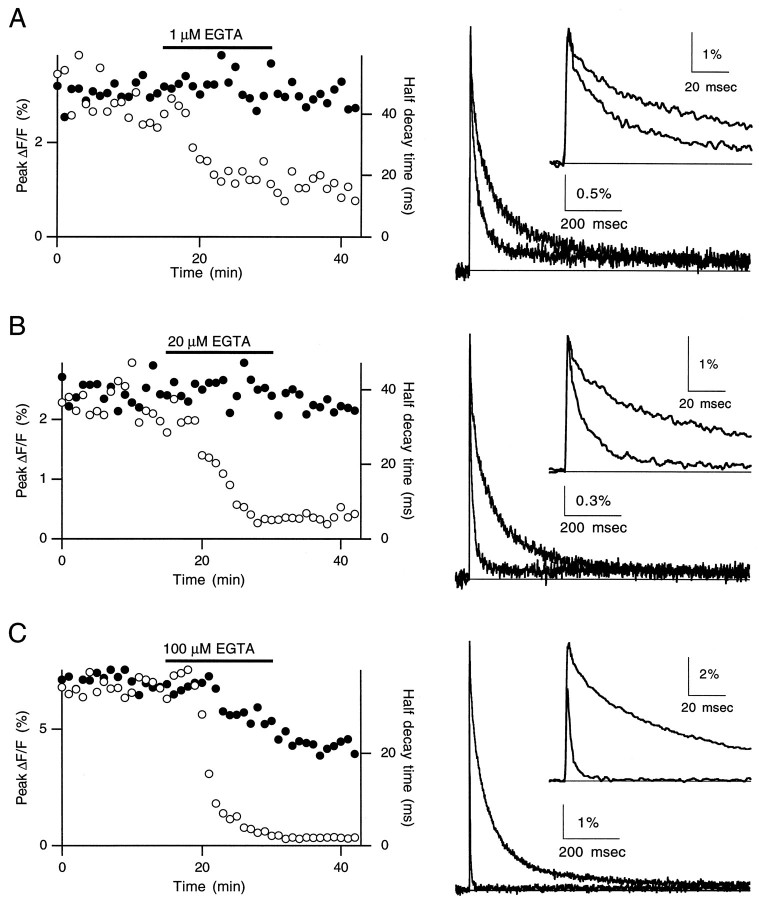
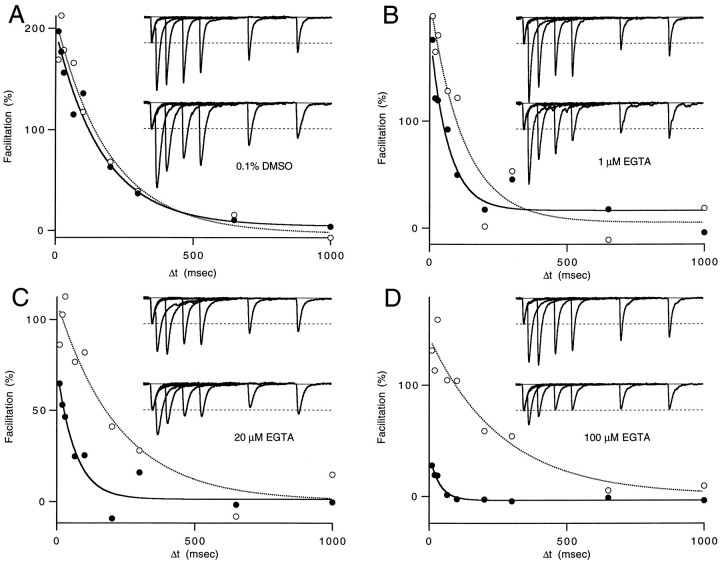
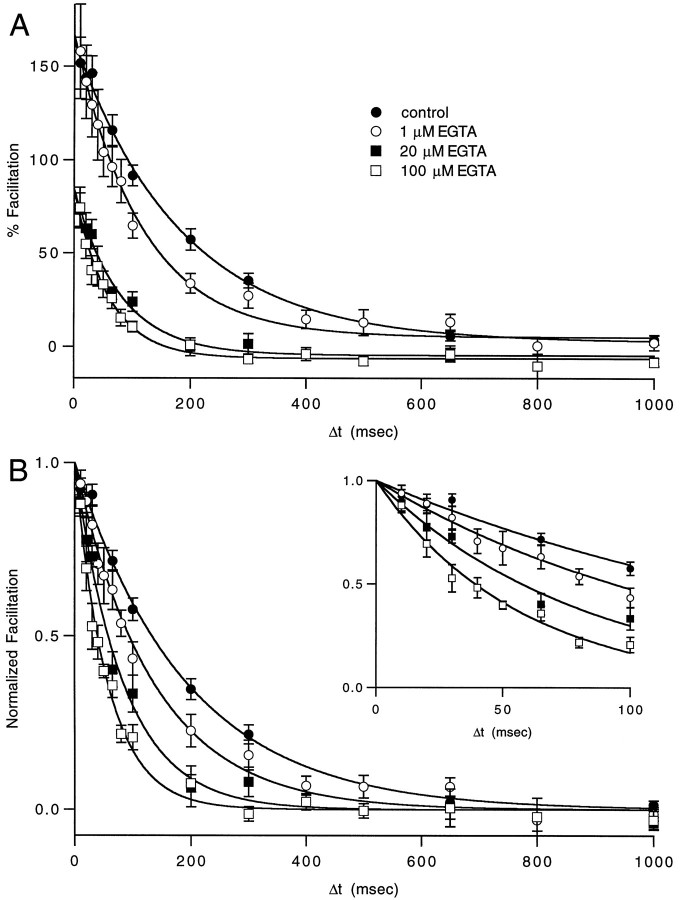
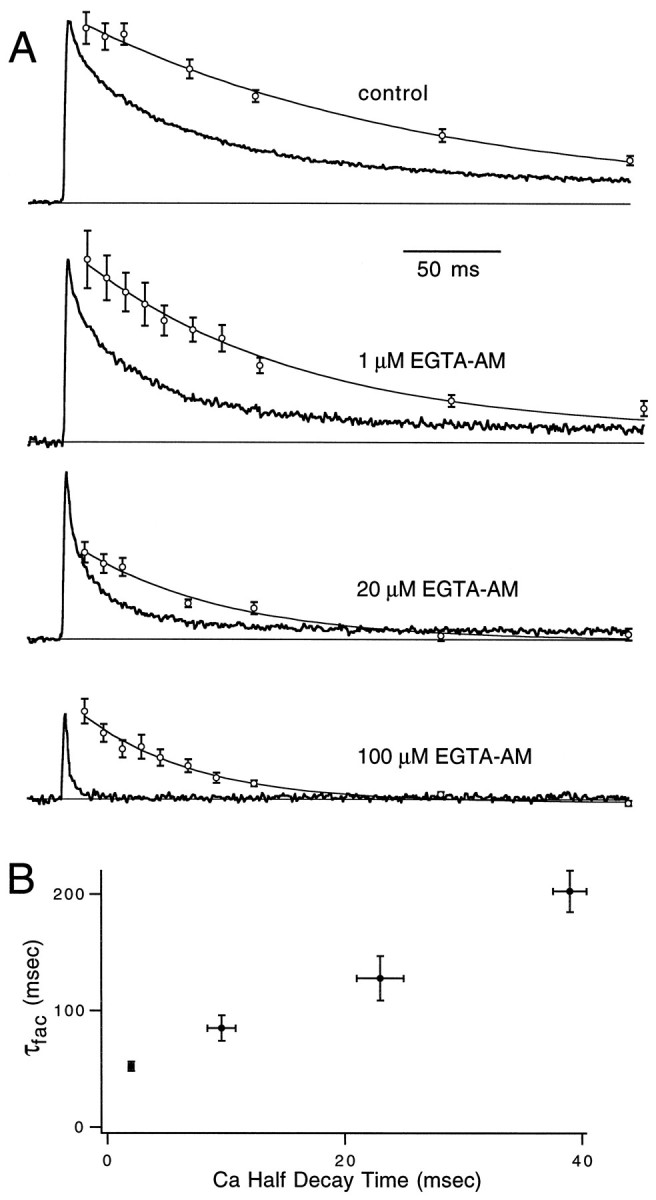
Short-term facilitation is a widely observed form of synaptic enhancement that is not well understood. Although presynaptic calcium has long been implicated in this process, its role is unclear, particularly at synapses in the mammalian brain. We tested the role of presynaptic residual free calcium ([Ca]res) in facilitation of synapses between granule cells and Purkinje cells in rat cerebellar slices. Paired-pulse facilitation of synaptic currents resulted in an approximately 2.5-fold enhancement that decayed with a time constant of approximately 200 msec, as assessed by voltage-clamp recordings. Measurements of [Ca]res using fluorescent calcium-sensitive indicators revealed that [Ca]res decayed more rapidly than did facilitation. Manipulation of [Ca]res dynamics by introducing EGTA into presynaptic terminals sped the decays of [Ca]res and facilitation in a dose-dependent manner. When [Ca]res was reduced to a brief impulse lasting several milliseconds, facilitation was still present, although reduced in amplitude and duration. Facilitation decayed with an intrinsic time constant of approximately 40 msec. These results suggest that facilitation at this synapse is produced by a calcium-driven process with a high affinity and a slow effective off-rate. A combination of [Ca]res dynamics and the properties of a calcium-driven reaction determine the time course and amplitude of facilitation.


Figures

Fig. 3.
Fig. 3.
Comparison of the decay times of calcium and facilitation for control conditions. The time courses of synaptic facilitation and normalized ΔF/Fchanges produced by single parallel fiber stimulation are shown for 24°C (A) and 34°C (B). ΔF/F traces are averages of 20 experiments at 24°C (t1/2 = 39 ± 1 msec) and four experiments at 34°C (t1/2 = 20 ± 2 msec). Facilitation points represent the average of 15 experiments at 24°C and 10 experiments at 34°C, and error bars represent SEM. The fits shown are to functions of the formC0 + C1e−(tfac). Fit parameters {C0,C1, τfac} were {2.4, 160, 184 msec} (A) and {16.3, 156, 104 msec} (B).
Fig. 2.
Fig. 2.
Detection of calcium transients evoked by single stimuli. Time courses of ΔF/F changes for mag-fura-5 (A), magnesium green (B), and fura-2 (C). The lower trace inC was corrected for distortions, as described in Materials and Methods. Traces are the averages of 8, 18, and 6 experiments, respectively, and were normalized to (ΔF/F)peak. For the experiments contributing to this figure, thet1/2 (the time taken for [Ca]res to decay from peak levels to 50% of peak levels) of ΔF/F changes was 52 ± 2 msec for mag-fura-5, 39 ± 1 msec for magnesium green, and 181 ± 32 msec for fura-2.
Fig. 1.
Fig. 1.
Paired-pulse facilitation at the granule cell to Purkinje cell synapse. Percentage facilitation as a function of interstimulus interval. Points are averages of 19 trials ± SEM.Inset, Synaptic currents evoked by extracellular stimulation with stimulus pulses separated by Δt = 50 msec; the trace is an average of 11 trials.
Fig. 10.
Fig. 10.
Simulations of the effect of EGTA on [Ca]res dynamics. A, Calcium transients were simulated as described in the text for control conditions and after the addition of 0.3, 1.3, and 10 mm EGTA. Thet1/2 of simulated transients is 40, 23, 10, and 2 msec, respectively. Peak amplitudes were reduced to 98, 92, and 67% of control, respectively. The t1/2 for Ca transients was similar to the half-rise times (21, 9, and 2 msec) of the Ca-EGTA complex (B) for low, medium, and high concentrations of EGTA. The ΔF/Ftransients (A) were normalized to the peak of the control trace, whereas each Ca-EGTA transient (B) was normalized to its own peak to emphasize the time course of EGTA equilibration with calcium.
Fig. 4.
Fig. 4.
Speeding the decay of calcium with EGTA-AM. The effects of 1 μm (A), 20 μm(B), and 100 μm EGTA-AM (C) on the peaks (solid circles) and time constants of decay (open circles) of the stimulus-evoked magnesium green ΔF/F changes are shown to theleft. Corresponding ΔF/Ftraces (averages) are shown to the right for control conditions and after the application of EGTA (traces with faster decays). Insets are the same traces shown on an expanded time scale.
Fig. 5.
Fig. 5.
Summary of the effect of EGTA loading on calcium transients. ΔF/F changes detected with magnesium green produced by a single stimulus of the parallel fibers for control and 1, 20, and 100 μm EGTA-AM on long (A) and short (B) time scales. Traces are averages from 20, 5, 5, and 5 experiments, respectively. Before averaging, each post-treatment trace was normalized to the pretreatment peak fluorescence.
Fig. 6.
Fig. 6.
Altering calcium dynamics changes the time course of facilitation. Facilitation before (open circles) and after (solid circles) 15 min applications of 0.1% DMSO and 0 EGTA-AM (A), 1 μm EGTA-AM (B), 20 μmEGTA-AM (C), and 100 μm EGTA-AM (D). Each point is the mean of two to four trials. The fits shown are to functions of the form C0 + C1e(tfac), with dashed and solid lines corresponding to open and solid circles, respectively. Before and after fit parameters {C0,C1, τfac} were {−3, 211, 199}, {4, 192, 174} (A); {5, 207, 124}, {17, 167, 67} (B); {1, 109, 224}, {1, 72, 65} (C); and {1, 142, 263}, {−3, 42, 36} (D). Each inset shows six superimposed average traces of conditioning and test EPSCs (Δt = 10, 30, 65, 100, 200, and 300 msec) obtained from a single Purkinje cell before (top) and after (bottom) application of the indicated solutions. In these experiments, the amplitudes (pA) of conditioning EPSCs before and after EGTA-AM application were 283 and 107 (A), 326 and 147 (B), 262 and 142 (C), and 348 and 203 (D). The reduction in amplitude observed in these long experiments was gradual, suggesting that it was not a product of either the DMSO or the EGTA-AM treatment.
Fig. 7.
Fig. 7.
Summary of the effect of EGTA-loading on facilitation. Averages of non-normalized (A) and normalized (B) facilitation in control solution and after treatment with 1, 20, or 100 μm EGTA-AM. For normalized curves, the facilitation curves from each cell were fit with a single exponential (which was not constrained to decay to 0), normalized to decay from 1 to 0, and then averaged with the other cells. Inset in B shows the same curves on an expanded time scale. Fit parameters for control, 1, 20, and 100 μm EGTA-AM in A were {2, 160, 184}, {5, 162, 114}, {−5, 89, 78}, and {−6, 90, 59}. τdecay for curves in B were 203, 138, 85, and 52 msec, respectively.
Fig. 8.
Fig. 8.
Comparison of calcium transients and facilitation.A, Time course of calcium transients (solid traces) and facilitation (open circles) for control conditions and after altering calcium dynamics with 15 min applications of 1, 20, and 100 μm EGTA-AM. Both calcium transients and facilitation from EGTA-AM experiments have been normalized to peaks from control conditions. Smooth curves are fits to the average facilitation. B, The time constant of decay of facilitation is plotted as a function of thet1/2 of calcium decay. Each point is the average ± SEM determined from 15, 14, 9, and 10 experiments, respectively, for facilitation, and 20, 5, 5, and 5 experiments for calcium.
Fig. 9.
Fig. 9.
Comparison of experimental and simulated facilitation. Experimentally determined and simulated time courses of facilitation for control conditions (solid circles, solid line) and after altering calcium dynamics with 15 min applications of 1 μm EGTA-AM (open circles, dotted line), 20 μm EGTA-AM (solid squares, solid line), and 100 μm EGTA-AM (open squares, dotted line). The simulations used the following properties for the facilitating molecule: k = 25 sec−1 and k+ = 1.5 × 108m−1 sec−1, corresponding to KD of 167 nm. Resting calcium was taken to be 40 nm, which corresponded to [CaX]/[Xtotal] = 0.19 at rest. For control simulations, peak [CaX]/[Xtotal] = 0.48.

Similar articles

Cited by

References

    1. Adler EM, Augustine GJ, Duffy SN, Charlton MP. Alien intracellular calcium chelators attenuate neurotransmitter release at the squid giant synapse. J Neurosci. 1991;11:1496–1507. - PMC - PubMed
    1. Augustine GJ, Neher E. Neuronal Ca2+signalling takes the local route. Curr Opin Neurobiol. 1992;2:302–307. - PubMed
    1. Bain AI, Quastel DM. Multiplicative and additive Ca2+-dependent components of facilitation at mouse end plates. J Physiol (Lond) 1992;455:383–405. - PMC - PubMed
    1. Bertram R, Sherman A, Stanley EF. Single-domain/bound calcium hypothesis of transmitter release and facilitation. J Neurophysiol. 1996;75:1919–1931. - PubMed
    1. Bittner GD. Synaptic plasticity at the crayfish opener neuromuscular preparation. J Neurobiol. 1989;20:386–408. - PubMed

Publication types

LinkOut - more resources