. 1996 Sep 15;16(18):5749-61.
doi: 10.1523/JNEUROSCI.16-18-05749.1996.

Development of an identified spinal commissural interneuron population in an amniote: neurons of the avian Hofmann nuclei

Affiliations

Development of an identified spinal commissural interneuron population in an amniote: neurons of the avian Hofmann nuclei

A L Eide et al. J Neurosci. .

Abstract

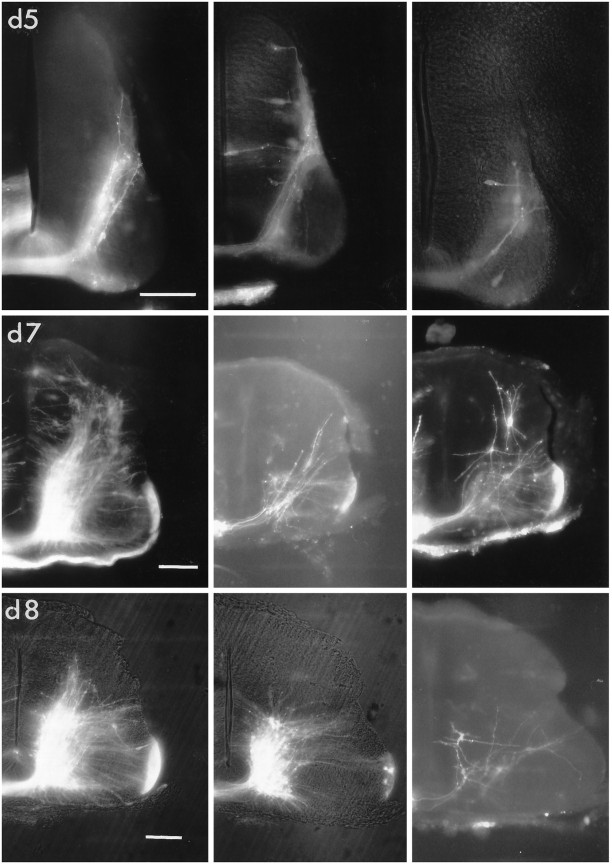
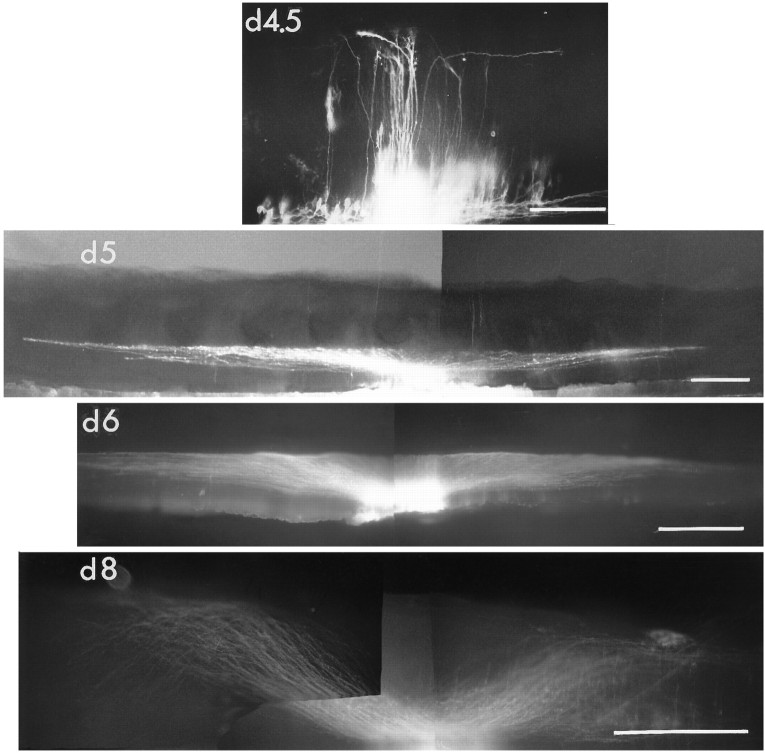
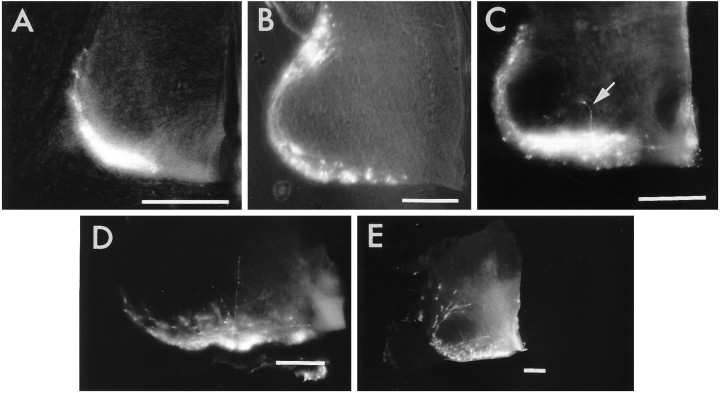
The commissural interneurons of the Hofmann nuclei (HN) of the avian spinal cord (The axonal projections of the Hofmann nuclei in the spinal cord of the late stage chicken embryo, Anat Embryol (Berl), A.L. Eide, 1996, Vol 193, pp 543-557) provide a unique opportunity to describe the development of an identified spinal commissural axon projection and its terminal collaterals in an amniote vertebrate. Here, we use the lipophilic tracer Dil to label these and other commissural projections anterogradely and retrogradely from the time the HN neurons are born. [3H]thymidine birthdating shows that the final mitoses of HN neurons occur at stages 21-24 [developmental day (d) 4]. By direct comparison, this follows the generation of motoneurons and of large, dorsally located commissural interneurons. The first HN neurons reach the ventrolateral margin of the spinal cord by d6 by a radial migration through the ventral horn. Radial migration occurs after the extension of HN axons across the midline. Thus, HN neurons are determined to be commissural interneurons before attaining their definitive locations. The HN neurons subsequently aggregate into segmentally iterated clusters at the ventrolateral margin of the spinal cord by d8. Also by d8 their logitudinal axons attain mature extent in the ventral funiculus of the contralateral side and begin to sprout collaterals. The collaterals are directed predominantly toward the medial aspect of the ventral horn at all stages, forming by d12 a dense thicket of terminals that thins out over several segments to each side of the HN of origin. The initial direction of collateral outgrowth is largely appropriate for the mature termination pattern of the HN. Terminal arbors, however, are less focused at early developmental stages than at later stages.


Figures

Fig. 1.
Fig. 1.
The different DiI application paradigms.A–D illustrate schematically the sites of DiI application (indicated by arrowheads and/ordots). E and F show representative examples of anterograde labeling from a single HN at d8.A, Anterograde tracing of the entire commissural projection from the level corresponding to a single HN in preparations from d4 to d8. DiI is applied to one side of the spinal cord between two ventral roots. The spinal cord is split along the midline except for between the two roots. This restricts the anterograde labeling to those axons crossing within this region. It also eliminates retrograde labeling of commissural interneurons on the contralateral side at all other levels. B, Retrograde tracing of commissural interneurons in preparations from d4 to d14. DiI is applied to the ventral and ventrolateral funiculi on one side midway between two ventral roots. The spinal cord is split along the midline at the same level. This eliminates anterograde labeling of commissural axons originating from the injected side. It also restricts retrograde labeling to commissural axons originating from the contralateral side of more rostral and caudal levels. This reveals the distribution of the commissural interneurons, including HN neurons, on the contralateral side, the longitudinal axons of which traverse the injected level.C, Selective anterograde tracing of the HN projection. DiI is applied selectively to one HN. The spinal cord is split along the midline except for the region in which the axons from the injected HN cross. This eliminates retrograde labeling of contralateral commissural interneurons rostral and caudal to the split and allows the HN axons and collaterals to be viewed in isolation. D, Retrograde tracing of the entire HN population. DiI is applied to one side of the spinal cord over many segments. This reveals the longitudinal disposition of the HN somata during the formation of the HN. E, Ventral view of a whole-mount spinal cord at d8 in which DiI has been applied to a single HN. The HN axons are visible along their commissural and longitudinal trajectories.F, Transverse section through a similar preparation showing the HN axon trajectory directed radially toward the ventral pole of the central canal and then crossing in the ventral commissure. Note that labeling extends all the way to the ventricular surface. This represents the ventricular attachments of radial glia that extend to the HN, not ventricular attachments of the HN neurons themselves (see text). Scale bars: 500 μm in E and 200 μm inF.
Fig. 2.
Fig. 2.
The development of the HN in the context of the morphometric changes occurring in the spinal cord during the developmental period studied. For each developmental stage, we show: (1) a drawing of a ventral view of the lumbar region of the spinal cord (the series of drawings is at the same scale to illustrate relative size); (2) a photomicrograph of a ventral view of one side of the spinal cord showing the disposition of the HN (first distinctly visible from d8); and (3) a photomicrograph of a transverse section through the lumbar spinal cord at the level of an HN (arrows). Scale bars: 2 mm in all drawings, 500 μm in the left photomicrographs, and 200 μm in the right photomicrographs.
Fig. 3.
Fig. 3.
[3H]thymidine birthdating of HN neurons and other neuron populations. A, Autoradiographic transverse section from the spinal cord of a d15 embryo labeled with [3H]thymidine at stage 23 (early d4).Circles enclose the regions shown in B,C, and F. B, Intermingled labeled and unlabeled HN neurons; the latter were born before [3H]thymidine application. C, All motoneurons in the lateral motor column are unlabeled, demonstrating that this neuron population is born before the HN cells.D, Retrograde labeling of a large dorsal commissural interneuron at d7. E, Retrograde labeling of a large dorsal commissural interneuron at d15. F, Large dorsal interneurons of the same size, shape, and location as inE are unlabeled (arrow), demonstrating that this neuron population is born before the HN neurons. Scale bars: 500 μm in A, 50 μm in B,C, E, and F, and 200 μm inD.
Fig. 4.
Fig. 4.
Lateral migration of HN neurons. Transverse sections through the ventral spinal cord showing the distribution of retrogradely labeled commissural interneurons at d7 (A) and d6 (B, C) after DiI application to the right side as shown in D. A, The labeling pattern is different on the injected (right) and contralateral (left) sides immediately caudal to the level of injection. Radial processes extending through the lateral motor column are present only on the side contralateral to the injection and represent the retrogradely labeled axons of the HN neurons.B and C show examples of somata (presumed HN somata) associated with these axons. D summarizes schematically the distribution of axons and cell bodies labeled by this DiI application procedure. The small black ellipsesrepresent interneurons, HN neurons on the left side and an ipsilaterally projecting interneuron on the right, the latter lying lateral to longitudinal axons. Hatchingindicates the DiI application site, and arrowheadsindicate the location of the sections shown in A–C. Scale bars, 100 μm.
Fig. 5.
Fig. 5.
The longitudinal aggregation of HN neurons. Ventral views of the spinal cord at the indicated developmental stages. All HN neurons have been retrogradely labeled as shown in Figure1D. Scale bars, 500 μm.
Fig. 6.
Fig. 6.
Retrograde labeling of the entire commissural interneuron population located between LS5 and LS6 at the indicated developmental stages (DiI application as in Fig. 1B). Each row of plates shows the pattern of labeling at the same indicated stage, with distance rostrad increasing from left toright over a distance of about two to three segments. Scale bars, 100 μm.
Fig. 7.
Fig. 7.
The progressive longitudinal growth of axonal projections from commissural interneurons. Ventral views of the spinal cord at the indicated developmental stages. At d8, a single HN is labeled selectively; at earlier stages, the entire commissural axon population is labeled. Scale bars: 100 μm (d4.5), 500 μm (all subsequent stages).
Fig. 8.
Fig. 8.
The progressive longitudinal growth of axonal projections from the entire commissural interneuron population located between LS5 and LS6 (points and solid lines) or from HN-LS5/6 (dashed lines). Axon extent is expressed in terms of segmental reach (A) and absolute length (B) at the indicated developmental stages. Points represent maximum extents observed in single preparations, whereas the solid lines represent averages of these. Points are only shown for the early stages when maximum extents are more variable. For the entire commissural axon population, average extents are derived from three, seven, and four preparations at d4, d5, and d6, respectively. For the HN commissural axon population, average extents are derived from three preparations at each of d8 and d14.
Fig. 9.
Fig. 9.
Early development of axon collaterals from the entire commissural interneuron population located between LS5 and LS6. Transverse sections through the contralateral side of the spinal cord. The commissural axon population has bifurcated to extend longitudinally in the ventral and ventrolateral white matter at d5 (A) and d6 (B), but collaterals first appear at d7 (C, arrow). By d8 (D,E), only a few unbranched collaterals have been elaborated. All sections are from the region just rostral to the DiI application site (DiI applied as in Fig. 1A). Scale bars, 100 μm.
Fig. 10.
Fig. 10.
The development of axon collaterals from a single HN-LS5/6 at successively greater distances rostral to the HN (DiI application as in Fig. 1C). Each row of plates shows the pattern of labeling at the same indicated stage, with distance rostrad increasing from left to right over a distance of about four segments. Note the change in the mediolateral location of the longitudinal axons with increasing distance and the corresponding change in angle of collateral ingrowth. Scale bars, 100 μm.

References

    1. Berkenblit MB, Feldman AG, Fukson OI. Wiping reflex in the frog: movement patterns, receptive fields, and blends. In: Ewert J-P, Arbib MA, editors. Visuomotor coordination: amphibians, comparisons, models and robots. Plenum; New York: 1989. pp. 615–630.
    1. Bizzi E, Mussa-Ivaldi FA, Giszter S. Computations underlying the execution of movement: a biological perspective. Science. 1991;253:287–291. - PubMed
    1. Colamarino SA, Tessier-Lavigne M. The role of the floor plate in axon guidance. Annu Rev Neurosci. 1995;18:497–529. - PubMed
    1. Dale N, Roberts A, Ottersen OP, Storm-Mathisen J. The morphology and distribution of “Kolmer-Agduhr cells,” a class of cerebrospinal-fluid-contacting neurons revealed in the frog embryo spinal cord by GABA immunocytochemistry. Proc R Soc Lond [Biol] 1987;232:193–203. - PubMed
    1. Davis B, Frank E, Johnson F, Scott S. Development of central projections of lumbosacral sensory neurons in the chick. J Comp Neurol. 1989;279:556–566. - PubMed

Publication types

LinkOut - more resources