. 1996 Sep 15;16(18):5830-43.
doi: 10.1523/JNEUROSCI.16-18-05830.1996.

Cellular organization of an antennal mechanosensory pathway in the cockroach, Periplaneta americana

Affiliations

Cellular organization of an antennal mechanosensory pathway in the cockroach, Periplaneta americana

J A Burdohan et al. J Neurosci. .

Abstract

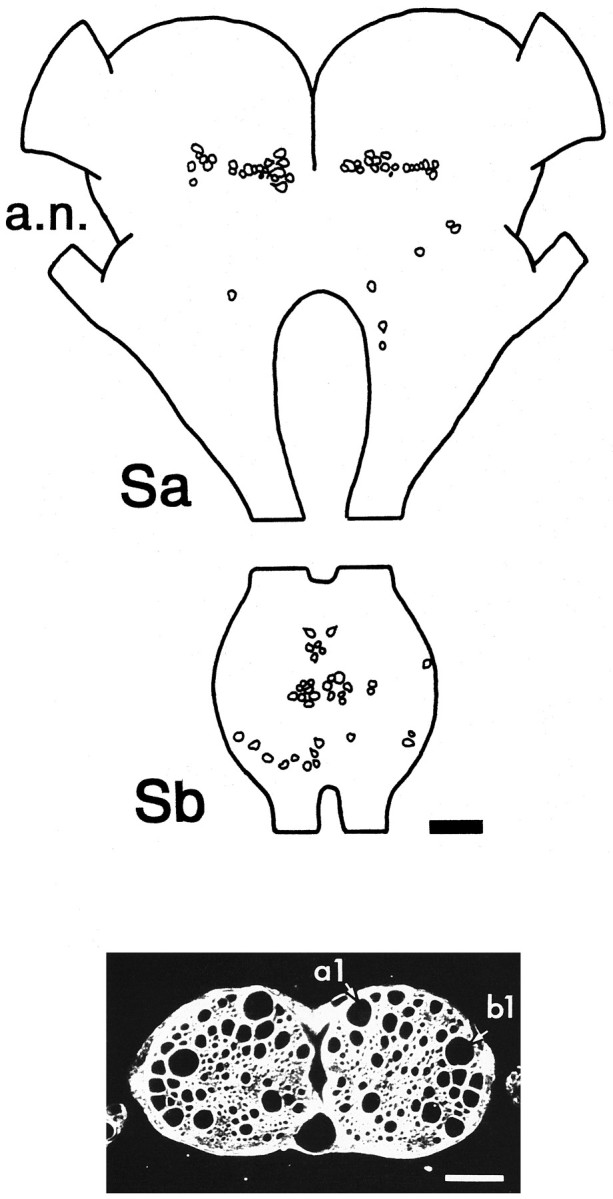
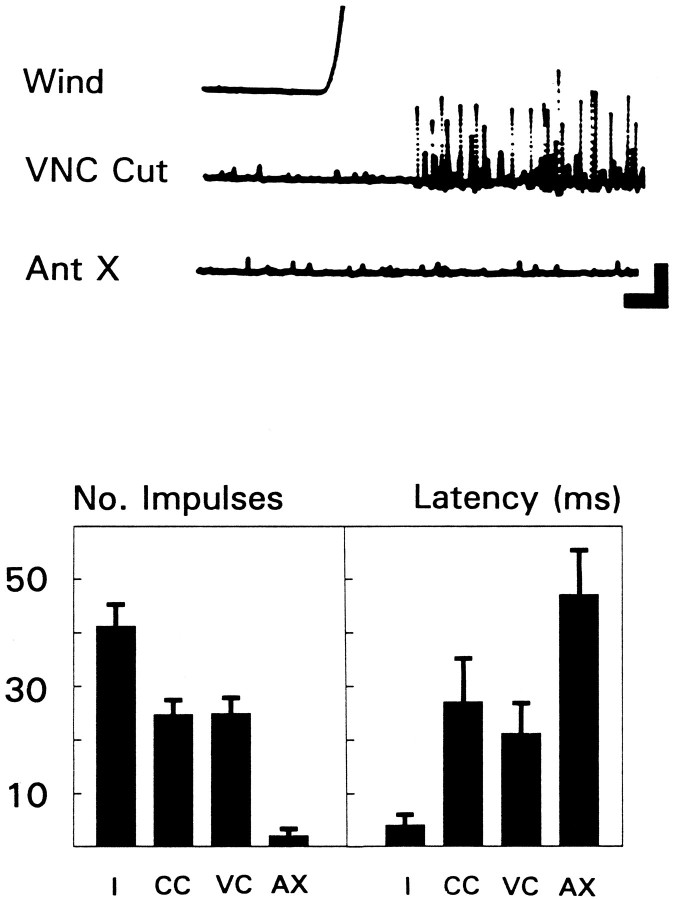
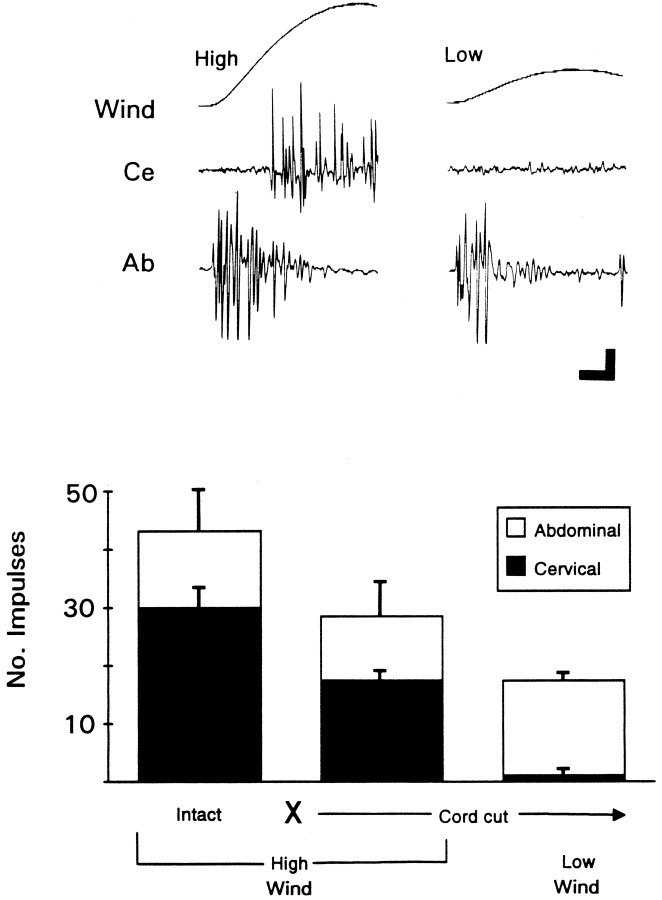
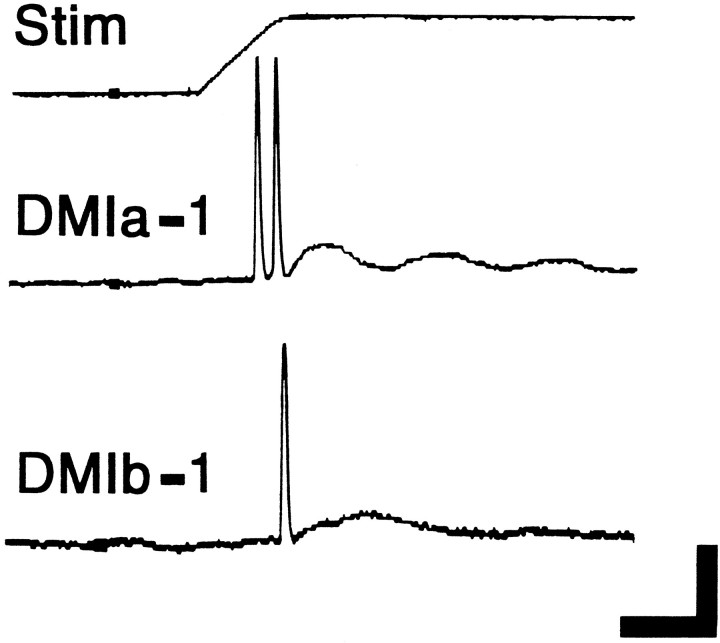
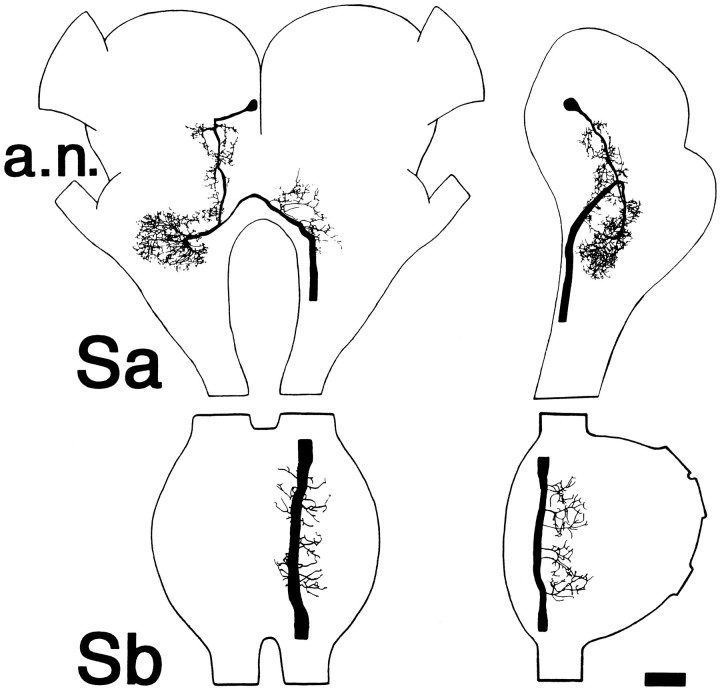
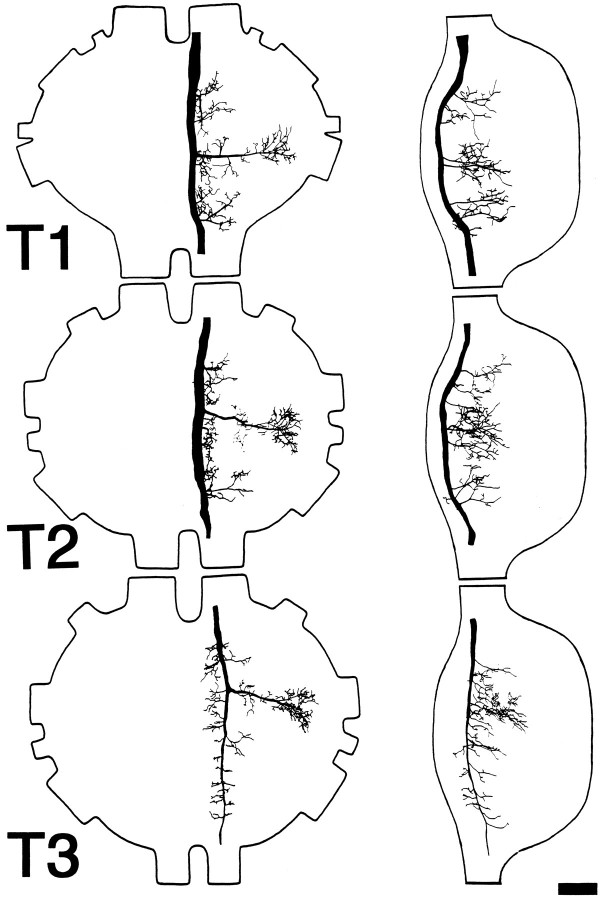
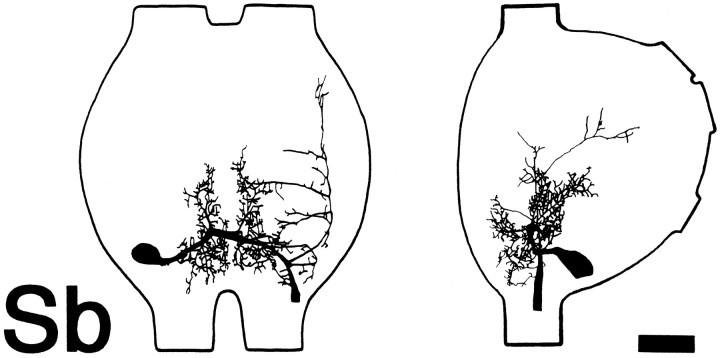
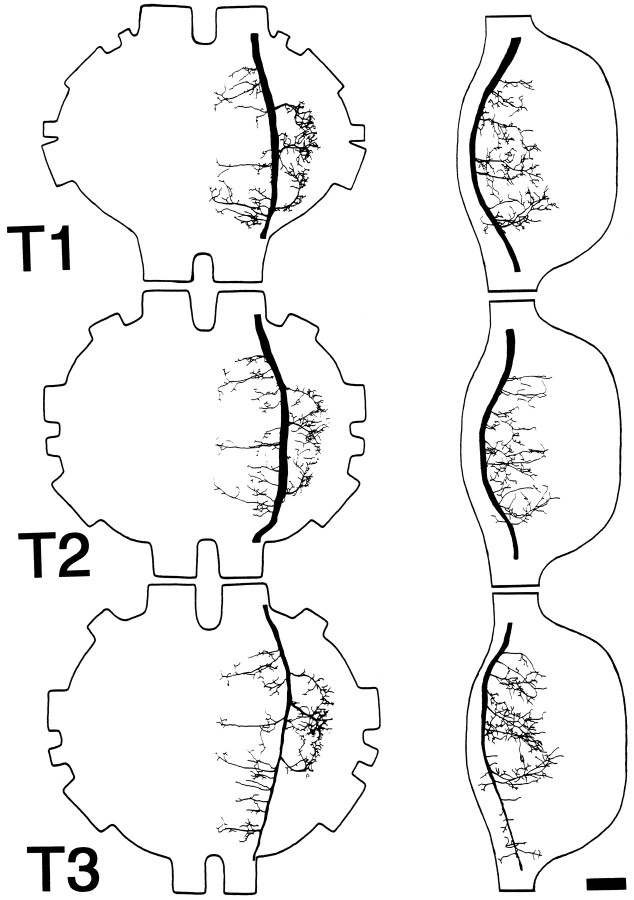
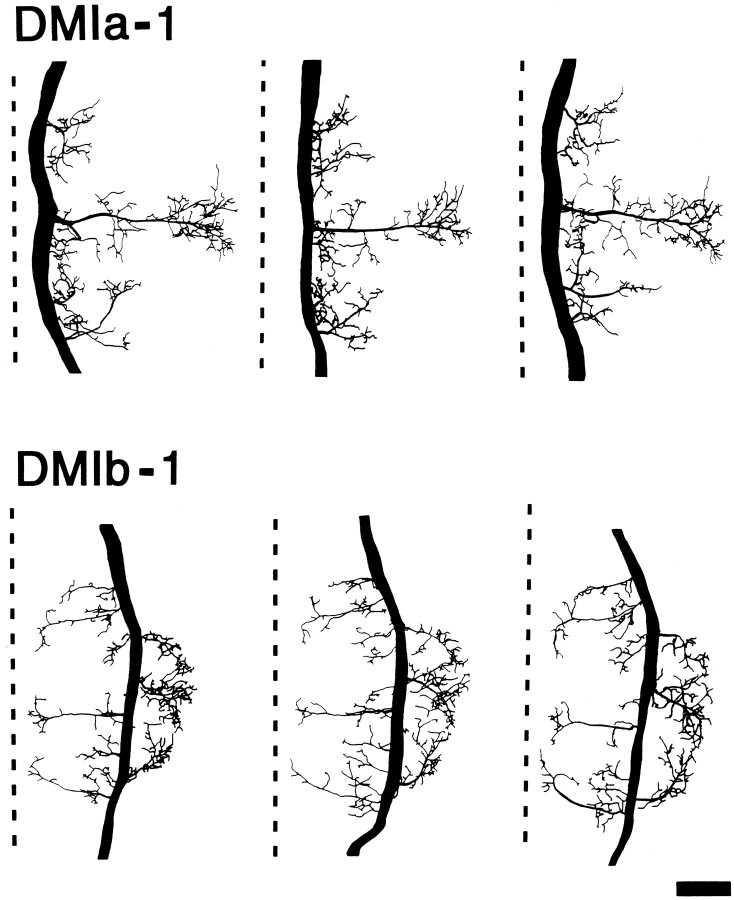
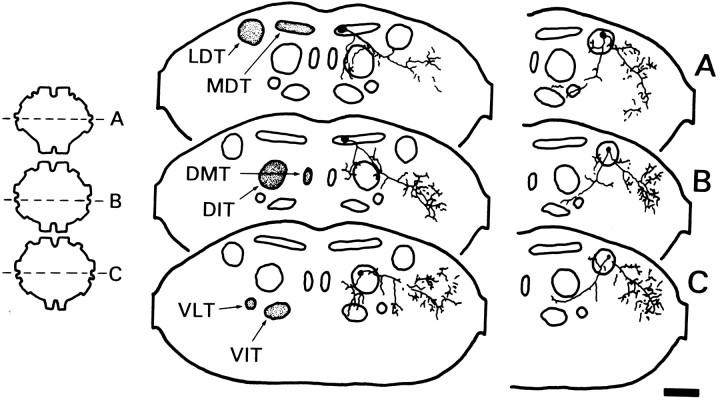
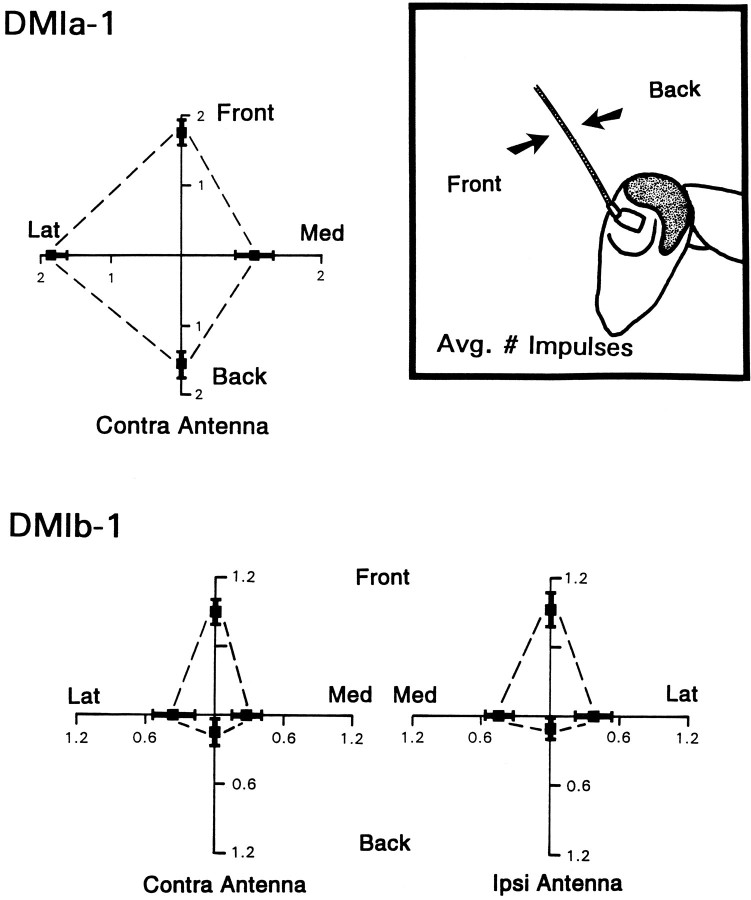
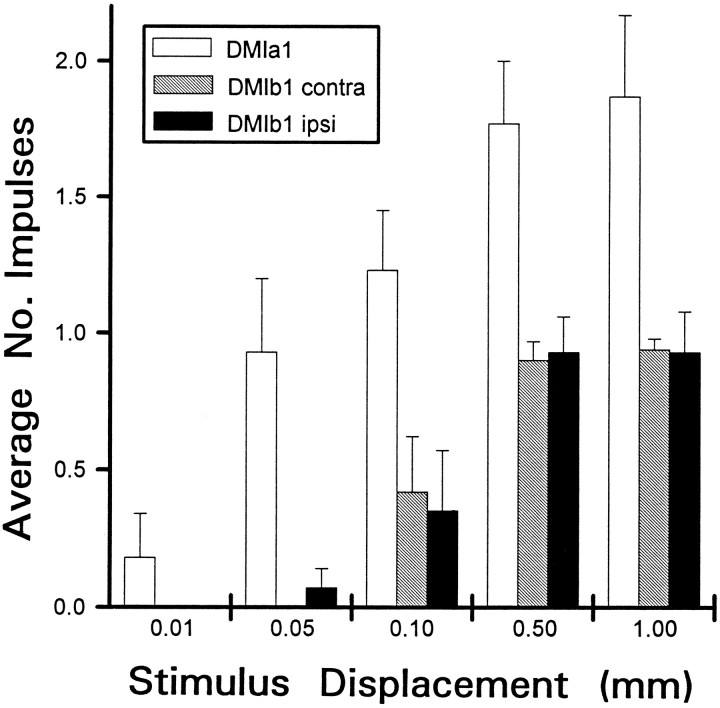
Escape responses of cockroaches, Periplaneta americana, can be triggered by wind and mediated by a group of "giant interneurons" that ascend from cercal mechanoreceptors to motor centers. Recently it has been observed that escape also can be triggered by tactile stimulation of the antennae, and it is then independent of the giant interneurons. Here we identify a descending antennal mechanosensory pathway that may account for escape. Cobalt backfills demonstrated that a limited number of cells in the head ganglia have axons that project through all three thoracic ganglia. Comparison with known wind-sensory pathways indicated that wind is not a reliable stimulus for activating descending antennal pathways. However, direct touch stimulation of an antenna reliably evoked short-latency responses in cells with axons in the cervical connectives. Intracellular recording and dye injection revealed members of this pathway, referred to as descending mechanosensory interneurons (DMIs). The two axons of largest diameter in the cervical connectives were found to belong to DMIs, and these large-caliber interneurons were studied in detail. One had a soma in the supraesophageal ganglion, and the other in the subesophageal ganglion. Both had extensive neuritic arborizations at the same level as the soma and axonal arbors in all three thoracic ganglia. Each of these DMIs exhibited short-latency responses to small antennal movements, demonstrated a degree of directional sensitivity, and rapidly conducted impulses to thoracic levels. These cells have properties suggesting that they play a role in a short-latency behavior such as touch-evoked escape.


Figures

Fig. 1.
Fig. 1.
Axons in the cervical connectives include a population of interneurons with somata in the head ganglia and projections through the thoracic ganglia. Top, Camera lucida reconstruction of position of cobalt-filled cell bodies seen in whole mounts of head ganglia viewed from the dorsal surface. Anterior is toward the top. Cobalt was applied to both left and right connectives below the mesothoracic ganglion. Sa, Supraesophageal ganglion; Sb, subesophageal ganglion;a.n., antennal nerve.Bottom, Cross section through the cervical connectives viewed in phase contrast. The two largest axons (labeleda1 and b1) are those of individually identifiable interneurons that respond to antennal mechanosensory stimulation, as described in the text. Scale bar in both panels, 100 μm.
Fig. 2.
Fig. 2.
Many units recorded at the cervical level represent descending signals related to the antennae.Top, Wind-evoked multiunit activity recorded extracellularly from the cervical connective. Wind had a peak velocity from 1.8 to 2.0 m/sec. VNC Cut, Response after transecting the ventral nerve cord at the level of A1–A2; Ant X, response after cutting off both antennae at the pedicel. Calibration: vertical, 2 mV; horizontal, 10 msec.Bottom, Summary of all experiments performed on six animals. Histogram on left gives mean number of impulses recorded at cervical level. Height of bar for each condition was derived by averaging responses for each animal and then calculating the grand mean across animals ± SEM. Only large amplitude impulses were counted, i.e., those ≥25% of the maximum amplitude observed, and only those that occurred within 70 msec of wind onset. Histogram on right gives mean latency in milliseconds to first impulse across the same six animals ± SEM. Total number of trials averaged = 230. Conditions: I, intact;CC, after covering the cerci; VC, after cutting the VNC between abdomen and thorax; AX, after removing both antennae.
Fig. 3.
Fig. 3.
Descending units are less responsive to wind than units of the ascending cercal wind-sensory system. Top, Wind-evoked, multiunit activity recorded simultaneously at cervical (Ce) and abdominal (Ab) levels. Nerve cord was cut between abdomen and thorax. Wind puffs of two different peak velocities were used. High (left), 1.8–2.0 m/sec; Low (right), 0.3–0.7 m/sec. Calibration: vertical, 2 mV; horizontal, 20 msec.Bottom, Summary of all experiments performed on three animals. Height of bar for each condition gives mean number of large impulses recorded simultaneously at cervical (black bars) and abdominal (open bars) level. Averages for each condition were derived by averaging responses for each animal and then calculating the grand mean across animals ± SEM. Total number of trials averaged = 93. No.Impulses, Number of large impulses counted (criteria as in Fig. 2). Conditions: Intact, Before cutting the VNC;XCord cut→, after cutting the VNC;High Wind, Low Wind, wind puffs with peak velocities as described above.
Fig. 4.
Fig. 4.
The largest diameter cervical axons are those of interneurons that produce short-latency phasic responses to antennal touch. Intracellular recordings were made from DMI axons in the cervical connective. The records show the response of two cells (identified as DMIs, corresponding to the axons labeled in Fig. 1,bottom) to a 1.0 mm deflection of an antenna lasting 1 sec (top trace, monitor of voltage to piezoelectric crystal). For DMIa-1, the contralateral antenna was tapped from the lateral direction (deflecting the flagellum medially). For DMIb-1, the contralateral antenna was tapped from the front direction (deflecting the flagellum backward). These directions can be considered optimal for each cell (see Fig. 12). Calibration: vertical, 40 mV (intracellular records only); horizontal, 10 msec.
Fig. 5.
Fig. 5.
Anatomy of DMIa-1 in the head ganglia. Camera lucida drawings show dorsal (left) and lateral (right) whole-mount views in both head ganglia (Sa and Sb as indicated). Cell in this and subsequent figures labeled by intracellular injection of cobalt hexamine. Anterior is toward the top. In lateral view, dorsal is to the left. a.n., Antennal nerve. Scale bars: Sa, 150 μm; Sb, 100 μm.
Fig. 6.
Fig. 6.
Anatomy of DMIa-1 in the thoracic ganglia. Camera lucida drawings show dorsal (left) and lateral (right) whole-mount views in each of the three thoracic ganglia (T1–T3, as indicated). Anterior is toward thetop. In lateral view, dorsal is to theleft. Scale bar, 100 μm.
Fig. 7.
Fig. 7.
Anatomy of DMIb-1 in the subesophageal ganglion. Camera lucida drawings show dorsal (left) and lateral (right) whole-mount views in Sb. Anterior is toward the top. In lateral view, dorsal is to theleft. Scale bar, 100 μm.
Fig. 8.
Fig. 8.
Anatomy of DMIb-1 in the thoracic ganglia. Camera lucida drawings show dorsal (left) and lateral (right) whole-mount views in each of the three thoracic ganglia (T1–T3). Anterior is toward thetop. In lateral view, dorsal is to theleft. Scale bar, 100 μm.
Fig. 9.
Fig. 9.
Anatomical constancy of DMIa-1 and DMIb-1. Camera lucida drawings of whole-mount dorsal views of three separate cobalt hexamine fills of each DMI in the mesothoracic ganglion (T2). As an aid for comparing the branching patterns, the midline of each ganglion is shown as a dashed line. Anterior is toward thetop. Scale bar, 100 μm.
Fig. 10.
Fig. 10.
Distinguishing details of DMIa-1 and DMIb-1 seen in sections. Camera lucida reconstructions from transverse sections of DMIa-1 (left) and DMIb-1 (right) in the thoracic ganglia. Each drawing was constructed from five to six serial sections (12 μm thick). The level of each drawing is indicated to theleft on a dorsal view of the ganglia (A, T1; B, T2; C, T3). Axonal arbors are shown in relation to the fiber tracts described by Tyrer and Gregory (1982): DIT, dorsal intermediate tract;DMT, dorsal median tract; LDT, lateral dorsal tract; MDT, median dorsal tract;VIT, ventral intermediate tract; VLT, ventral lateral tract. On sections, dorsal is toward thetop. Scale bar, 100 μm.
Fig. 12.
Fig. 12.
Directional sensitivity of DMIs. Directionality is plotted as average number of impulses recorded for taps delivered from each of the four directions tested: front (Front), back (Back), medial (Med), lateral (Lat). Front and back represent stimuli moving the flagellum parallel to the long axis of the body, as shown in theinset; medial and lateral were movements at right angles to those shown. Taps were delivered to deflect the antenna by the same amplitude (1.0 mm) and at the same rate (0.1 mm/msec) on all trials. These values were chosen because they were optimal for activating the cells. Means for each direction (black squares) were derived by averaging responses for each animal and then calculating the grand mean across animals ± SEM. Top, Response of DMIa-1 to mechanical stimulation of the contralateral antenna. Data from 11 cells, each from a different animal. Total number of trials = 277. Bottom, Response of DMIb-1 to mechanical stimulation of each antenna. Data from eight cells, each from a different animal. Total number of trials = 329. Left side shows responsiveness of cell to tapping the contralateral (Contra) antenna. Right side shows responsiveness to tapping the ipsilateral (Ipsi) antenna.
Fig. 11.
Fig. 11.
Sensitivity of DMIa-1 and DMIb-1 to stimulus amplitude. Histogram summarizes all experiments on sensitivity performed with 19 animals. Antenna was tapped to deflect it by varying amounts. Horizontal axis (Stimulus Displacement) in mm; vertical axis, mean number of impulses counted (Average No. Impulses) for each displacement tested.Open bars, Response of a-1 to tapping the contralateral antenna (no response was observed to tapping the ipsilateral antenna);black and gray bars, response of b-1 to tapping the ipsilateral or contralateral antenna, respectively. Height of bar for each condition was derived by averaging responses for each animal and then calculating the grand mean across animals ± SEM. Total number of trials averaged = 309 (for 11 a-1 recordings) and 336 (for 8 b-1 recordings). Stimuli were presented from the optimal direction of each cell (see Fig. 12).

Similar articles

Cited by

References

    1. Arbas EA. Control of hindlimb posture by wind-sensitive hairs and antennae during locust flight. J Comp Physiol [A] 1986;159:849–857. - PubMed
    1. Bacon JP, Altman JS. A silver intensification method for cobalt-filled neurons in whole-mount preparations. Brain Res. 1977;138:359–363. - PubMed
    1. Bacon J, Möhl B. The tritocerebral commissure giant (TCG) wind-sensitive interneurone in the locust. I. Its activity in straight flight. J Comp Physiol [A] 1983;150:439–452.
    1. Bacon JP, Strausfeld NJ. The dipteran giant fibre pathway: neurons and signals. J Comp Physiol [A] 1986;158:529–548.
    1. Bicker G, Pearson KG. Initiation of flight by an identified wind-sensitive neurone (TCG) in the locust. J Exp Biol. 1983;104:289–293.

Publication types

LinkOut - more resources