. 1996 Oct 1;16(19):6125-33.
doi: 10.1523/JNEUROSCI.16-19-06125.1996.

Mitochondrial dysfunction is a primary event in glutamate neurotoxicity

Affiliations

Mitochondrial dysfunction is a primary event in glutamate neurotoxicity

A F Schinder et al. J Neurosci. .

Abstract

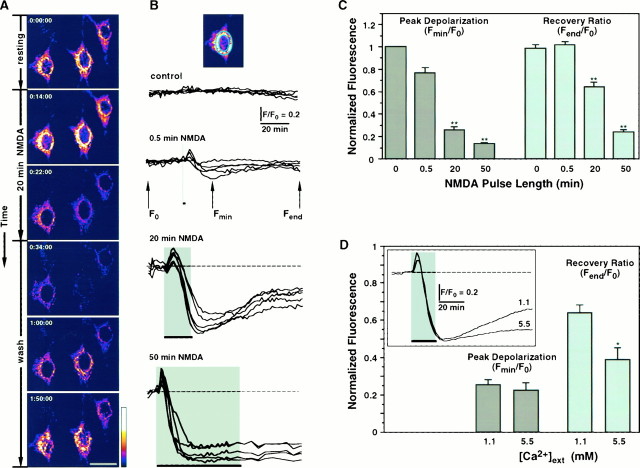
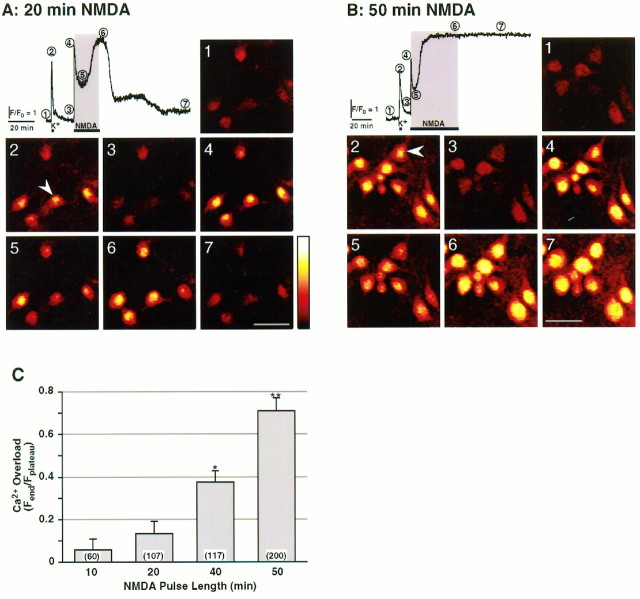
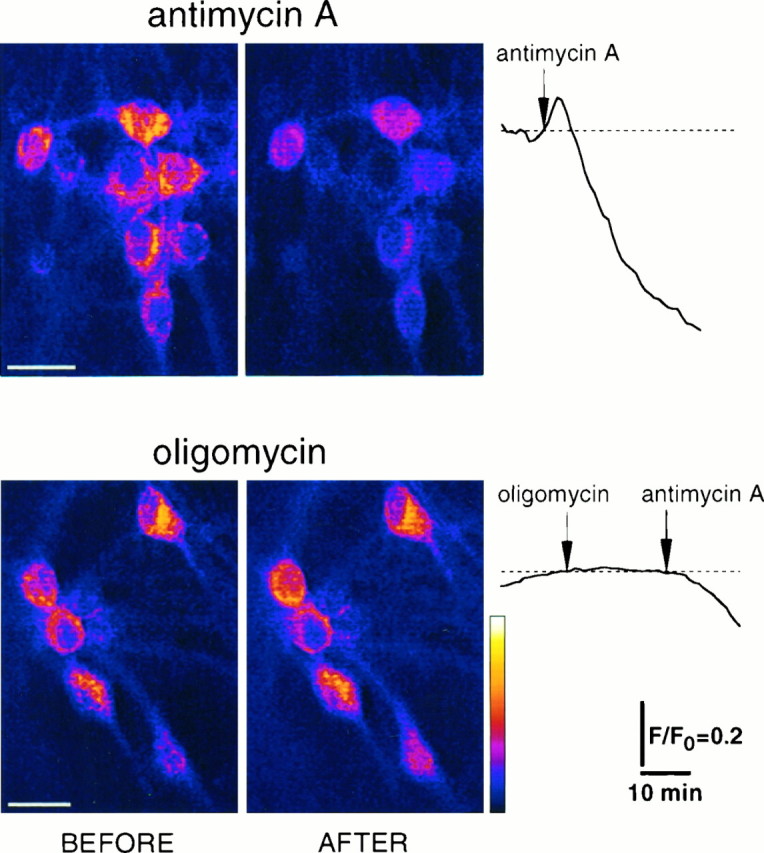
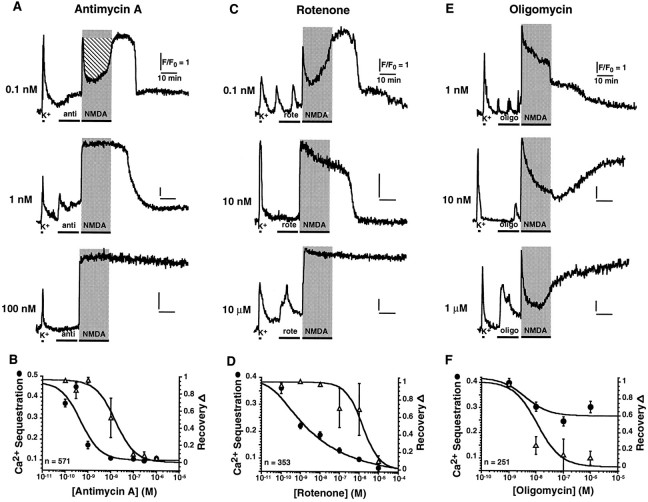
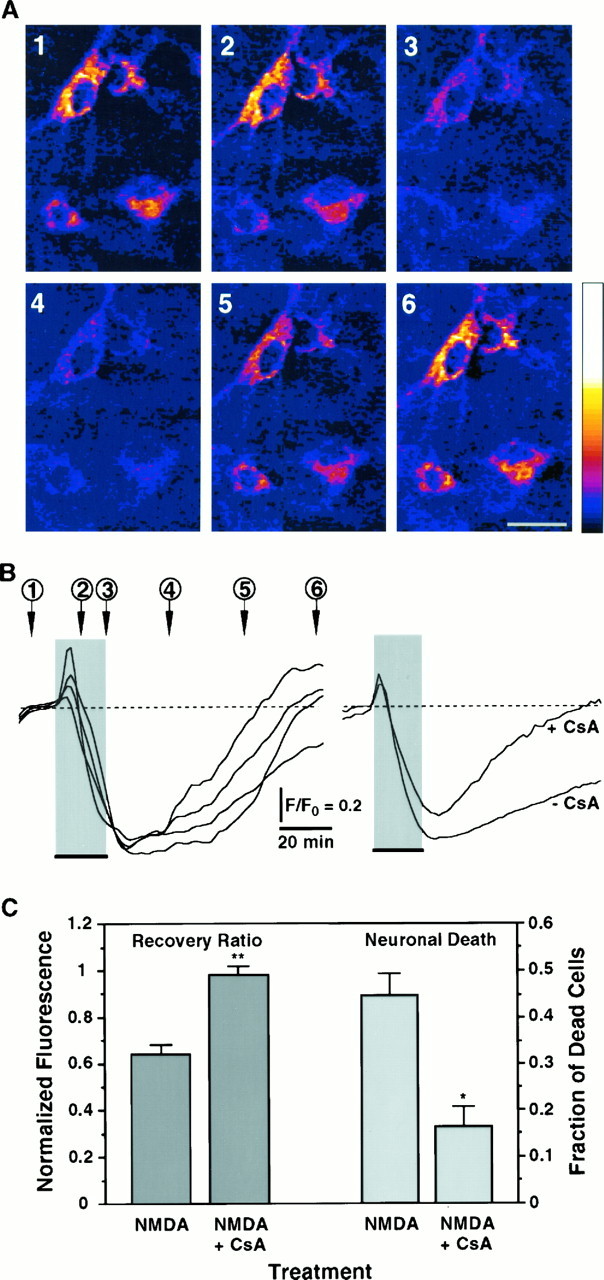
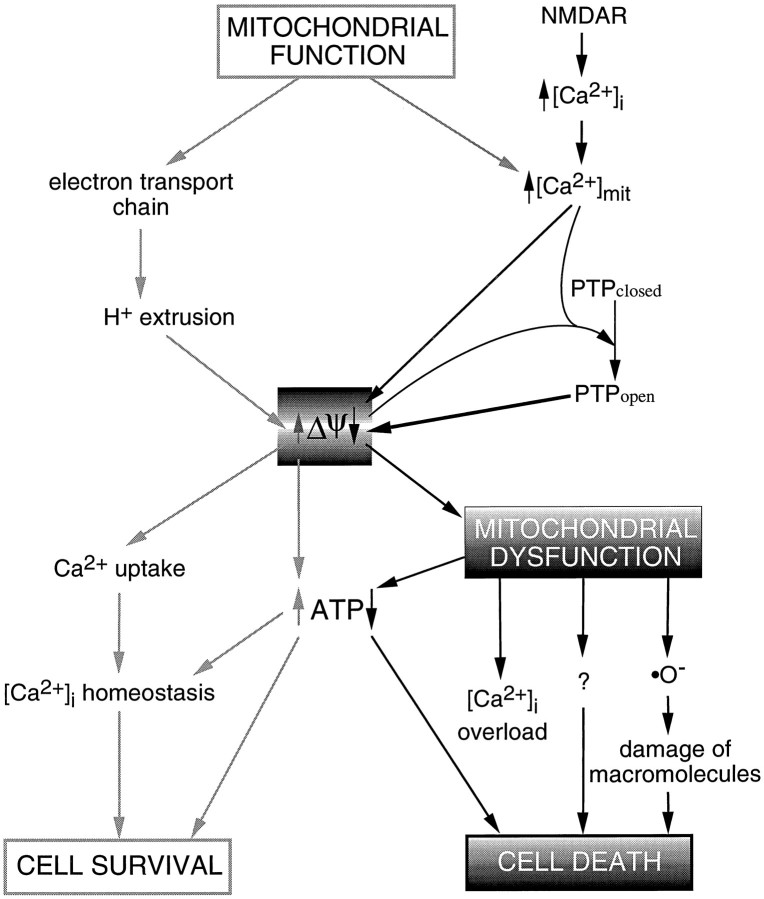
Excitotoxic neuronal death, associated with neurodegenerative disorders and hypoxic insults, results from excessive exposure to excitatory neurotransmitters. Glutamate neurotoxicity is triggered primarily by massive Ca2+ influx arising from overstimulation of the NMDA subtype of glutamate receptors. The underlying mechanisms, however, remain elusive. We have tested the hypothesis that mitochondria are primary targets in excitotoxicity by confocal imaging of intracellular Ca2+ ([Ca2+]i) and mitochondrial membrane potential (delta psi) on cultured rat hippocampal neurons. Sustained activation of NMDA receptors (20 min) elicits reversible elevation of [Ca2+]i. Longer activation (50 min) renders elevation of [Ca2+]i irreversible (Ca2+ overload). Susceptibility to NMDA-induced Ca2+ overload is increased when the 20 min stimuli are applied to neurons pretreated with electron transport chain inhibitors, thereby implicating mitochondria in [Ca2+]i homeostasis during excitotoxic challenges. Remarkably, delta psi exhibits prominent and persistent depolarization in response to NMDA, which closely parallels the incidence of neuronal death. Blockade of the mitochondrial permeability transition pore by cyclosporin A allows complete recovery of delta psi and prevents cell death. These results suggest that early mitochondrial damage plays a key role in induction of glutamate neurotoxicity.


Figures

Fig. 4.
Fig. 4.
NMDAR overstimulation collapses ΔΨ.A, Digital images of neurons exposed to TMRE before removal of NMDA (top frame indicated by 0:00:00 time), during 20 min stimulation with 200 μm NMDA, and after removal of NMDA (wash). Collapse of ΔΨ is shown as a decrease in fluorescence intensity during exposure to NMDA. Partial repolarization occurs after the stimulus is removed. Pseudocolor scale represents arbitrary fluorescence intensity values ranging from 0 to 255. Scale bar, 20 μm. B, Time course of ΔΨ measured in arbitrary fluorescence units for neurons stimulated with NMDA for 0 (control), 0.5, 20, and 50 min and recorded during 2 hr. Each trace represents mitochondrial fluorescence from an individual neuron normalized to its initial baseline value (F0), and each set of recordings belongs to a single representative experiment.Inset, Perinuclear ring of mitochondrial fluorescence used for quantitation. C, Mitochondrial fluorescence signals, as shown in B, are quantified as Peak Depolarization = Fmin/F0, an indicator of transient mitochondrial depolarization, and Recovery Ratio = Fend/F0, an indicator of mitochondrial repolarization after cessation of the NMDA stimulus. Bars plotted for 0, 0.5, 20, and 50 min NMDA represent mean ± SEM for n = 28, 28, 74, and 84, respectively. For both bar charts, ANOVA analysis revealed that populations are different with p < 0.00001. **, Statistically significant differences (p < 0.0001) compared with all other treatments using the post hoc test. D, Effect of [Ca2+]ext on depolarization of ΔΨ elicited by 20 min NMDA. Bar chart for Peak Depolarization and Recovery Ratio was calculated and plotted as in C. *, Statistically significant difference with p < 0.002. Inset, Comparison of the time courses of ΔΨ in the presence of [Ca2+]ext = 1.1 or 5.5 mm. Traces are averages from all recordings (5.5,n = 33; 1.1,n = 74).
None
[Ca2+]i (4) followed by a slow decrease to a lower level lasting several minutes (5), which gradually increases to achieve a higher plateau [Fplateau, (6)]. [Ca2+]i returns to baseline levels shortly after the NMDA stimulus is removed (7). Record obtained from the neuron marked with an arrowhead. Scale bar, 40 μm. B, Same as A, but neurons were stimulated for 50 min with NMDA. A similar time course was recorded, but heightened [Ca2+]i(6) failed to return to baseline levels [Ca2+ overload, (7)]. Calibration of [Ca2+]i yielded the following values: (1) [Ca2+]baseline = 29 ± 2 nm; (2) [Ca2+]K+ = 0.91 ± 0.10 μm; (4) [Ca2+]peak = 1.5 ± 0.2 μm; (5) [Ca2+]valley = 0.29 ± 0.03 μm; (6) [Ca2+]plateau = 2.1 ± 0.2 μm; n (number of cells) > 47. C, Extent of Ca2+ overload versus duration of the NMDA challenge. Ca2+ overload was calculated as the ratio of the fluorescence value at the end of the experiment [Fend, (7)] to the highest value achieved during the challenge [Fplateau, (6)]. Data are mean ± SEM. ANOVA analysis revealed that populations are different with p < 0.00001. *, Statistically significant difference (p < 0.005) obtained using the post hoc test compared with all other treatments; **p < 0.0001. Numbersin parentheses denote population sizes. {/ANNT;64064n;;66880n;72864n}
Fig. 3.
Fig. 3.
Effects of mitochondrial function inhibitors on ΔΨ. Pictures show digital images of neurons exposed to TMRE (Farkas et al., 1989) before and after treatment with 10 μmantimycin A or oligomycin. Collapse of ΔΨ is shown as a decrease in fluorescence intensity after exposure to antimycin A. Pseudocolor scale represents arbitrary fluorescence intensity values ranging from 0 to 255. Scale bar, 20 μm. Traces (right column) indicate time course of changes in ΔΨ measured in arbitrary fluorescence units for neurons treated with antimycin A or oligomycin. Arrows indicate initiation of treatments. Each trace represents mitochondrial fluorescence from an individual neuron normalized to its initial baseline value (F0).
Fig. 2.
Fig. 2.
Inhibitors of mitochondrial function modulate homeostasis of [Ca2+]i elicited by a 20 min NMDA stimulus. A, Time course of change in [Ca2+]i for neurons pretreated with antimycin A (anti) for 15 min immediately preceding stimulation with 200 μm NMDA. At 1 nm, antimycin selectively inhibits Ca2+ sequestration; at 100 nm, it abrogates both Ca2+ sequestration and recovery. Calibration of [Ca2+]i on neurons pretreated with 1 μm antimycin A yielded the following values: [Ca2+]baseline = 23 ± 2 nm; [Ca2+]peak = 1.33 ± 0.12 μm; [Ca2+]plateau = 2.7 ± 0.2 μm; n (number of cells) > 36. This indicates that lack of Ca2+ sequestration is not because of saturation of the dye. B, Dose–response for Ca2+ sequestration (•) and recovery (▵). Ca2+ sequestration is quantified as the area above the Ca2+ signal (hatched area inA, top panel) normalized to the rectangular area delimited by the baseline and the peak of the waveform during 20 min NMDA application. Recovery is defined as the fraction of cells that exhibitFend/Fplateau ≤ 0.3. C, Neurons pretreated for 15 min with rotenone (rote). Similar to antimycin, 10 nm rotenone selectively reduces Ca2+ sequestration, whereas 10 μm abolishes both sequestration and recovery.D, Dose–response for Ca2+ sequestration (•) and recovery (▵). E, Neurons pretreated for 15 min with oligomycin (oligo). At ≥10 nm, oligomycin inhibits recovery but has a minor effect on Ca2+sequestration. F, Dose–response for Ca2+sequestration (•; IC50 ≫ 10 μm) and recovery (▵; IC50 = 11.1 ± 2.8 nm). Curves represent best fits to the function y = A0 + A1 · (IC50/([drug] + IC50))h.
Fig. 5.
Fig. 5.
Blockade of the PTP enhances recovery of the NMDA-induced collapse of ΔΨ and decreases neuronal death.A, Digital images of TMRE fluorescence of neurons exposed for 20 min to 200 μm NMDA in the presence of 1.6 μm CsA. Numbers indicate critical time points in the ΔΨ signal shown in B and code panels1 to 6 that are pseudocolored images of TMRE fluorescence. Neurons show a marked depolarization of ΔΨ evoked by the NMDA pulse; repolarization occurs after removal of the stimulus. Scale bar, 20 μm. All other conditions are as in Figure 4.B, Left panel, Time course of ΔΨ from neurons shown in A, measured in arbitrary fluorescence units. Each trace corresponds to one of the neurons in the digital images. Right panel, Comparison of the time courses of ΔΨ in response to 20 min NMDA in the presence or absence of CsA. Traces are averages from all recordings (+CsA:n = 26; −CsA: n = 74). C, Recovery of ΔΨ (Recovery Ratio) was calculated for recordings obtained in the presence of CsA (n = 26 neurons) and compared with those presented in Figure 4C for 20 min NMDA. Peak depolarization is not affected by CsA (Peak Depolarization = 0.351 ± 0.048; p = 0.1). Cell death induced by NMDA was simultaneously assessed in the presence (n = 7126 neurons) and absence (n = 7985 neurons) of CsA for six independent experiments. Fraction of dead cells in cultures treated with vehicle was subtracted (0.054 ± 0.003; n = 6547 neurons). Bars represent mean ± SEM. *, Statistically significant difference between treatments (p < 0.002); **p < 0.0001.
Fig. 6.
Fig. 6.
Schematic representation of potential pathways by which mitochondrial dysfunction could act as an effector of excitotoxic neuronal death. NMDAR overstimulation induces excessive Ca2+ influx and abnormal elevations of [Ca2+]i. Mitochondrial Ca2+uptake, driven by ΔΨ, attenuates ΔΨ. This, in turn, causes a decrease in ATP synthesis and the opening of the PTP, which collapses ΔΨ. Mitochondrial dysfunction elicits a further reduction in intracellular ATP pools, increases free radical generation, and most likely activates other processes that ultimately contribute to neuronal cell death.

References

    1. Akerman KE. Changes in membrane potential during calcium ion influx and efflux across the mitochondrial membrane. Biochim Biophys Acta. 1978;502:359–366. - PubMed
    1. Ankarcrona M, Dypbukt JM, Bonfoco E, Zhivotovsky B, Orrenius S, Lipton SA, Nicotera P. Glutamate-induced neuronal death: a succession of necrosis or apoptosis depending on mitochondrial function. Neuron. 1995;15:961–973. - PubMed
    1. Beal MF. Does impairment of energy metabolism result in excitotoxic neuronal death in neurodegenerative illnesses? Ann Neurol. 1992;31:119–130. - PubMed
    1. Beatrice MC, Palmer JW, Pfeiffer DR. The relationship between mitochondrial membrane permeability, membrane potential, and the retention of Ca2+ by mitochondria. J Biol Chem. 1980;255:8663–8671. - PubMed
    1. Bernardi P, Broekemeier KM, Pfeiffer DR. Recent progress on regulation of the mitochondrial permeability transition pore, a cyclosporin-sensitive pore in the inner mitochondrial membrane. J Bioenerg Biomembr. 1994;26:509–517. - PubMed

Publication types

LinkOut - more resources