. 1996 Oct 15;16(20):6402-13.
doi: 10.1523/JNEUROSCI.16-20-06402.1996.

Gamma oscillation by synaptic inhibition in a hippocampal interneuronal network model

Affiliations

Gamma oscillation by synaptic inhibition in a hippocampal interneuronal network model

X J Wang et al. J Neurosci. .

Abstract

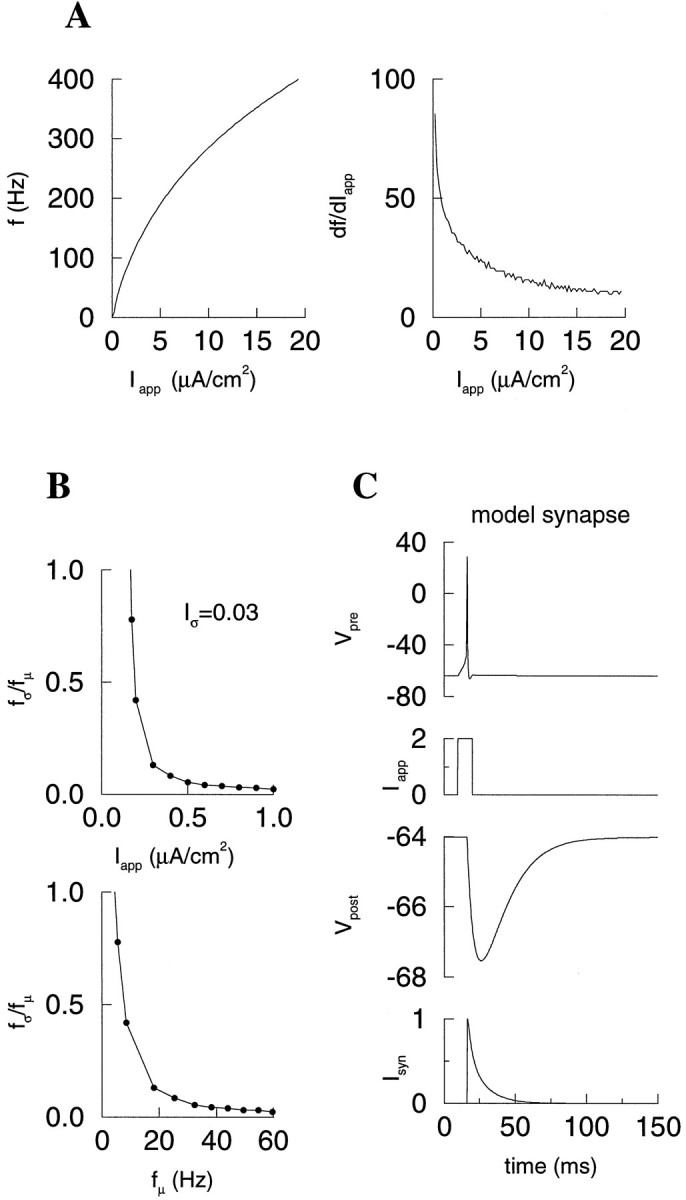
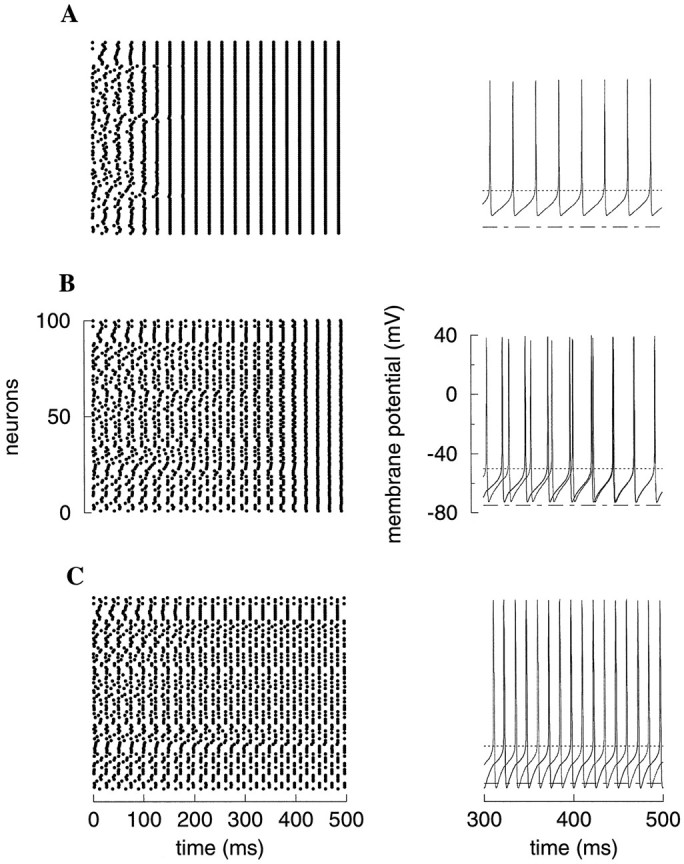
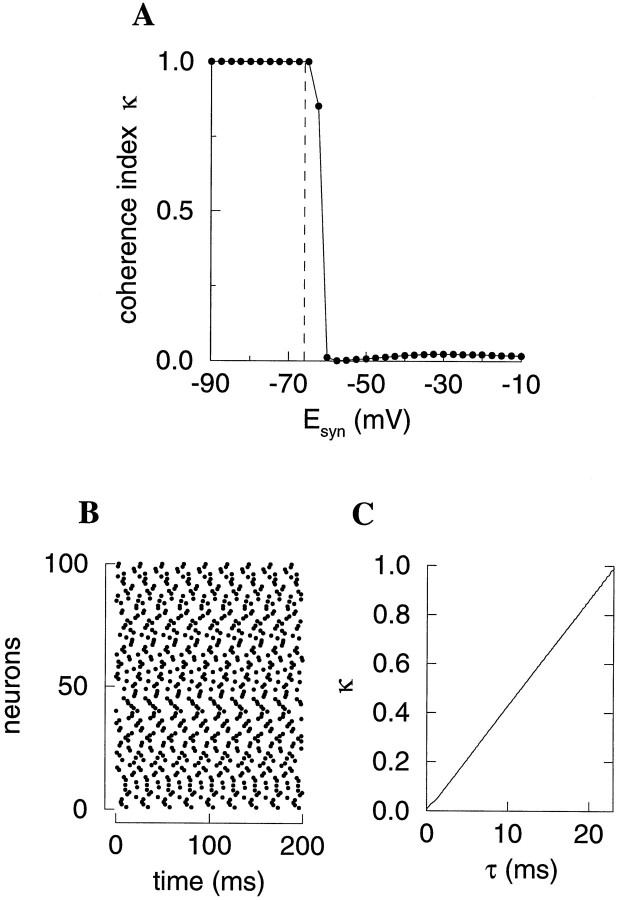
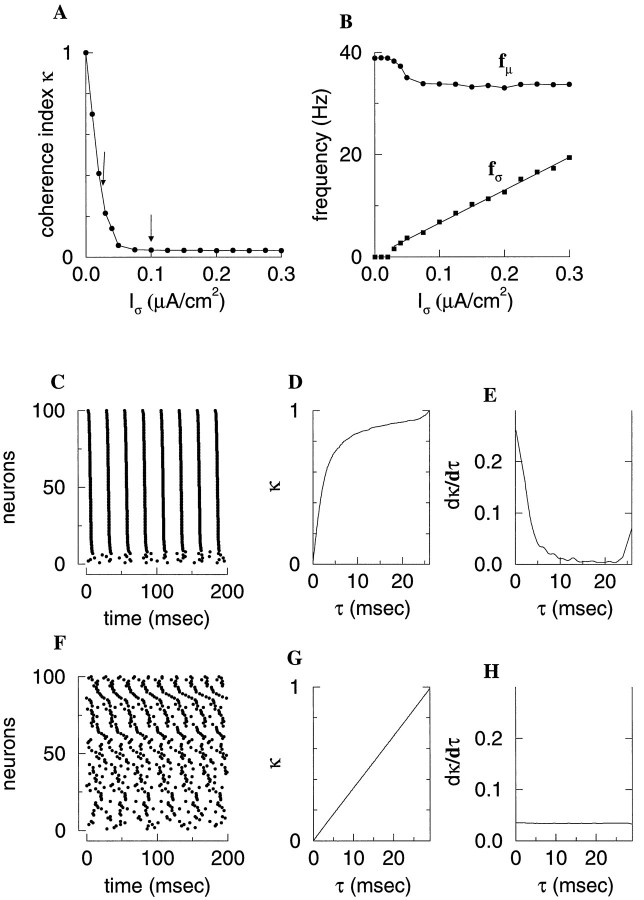
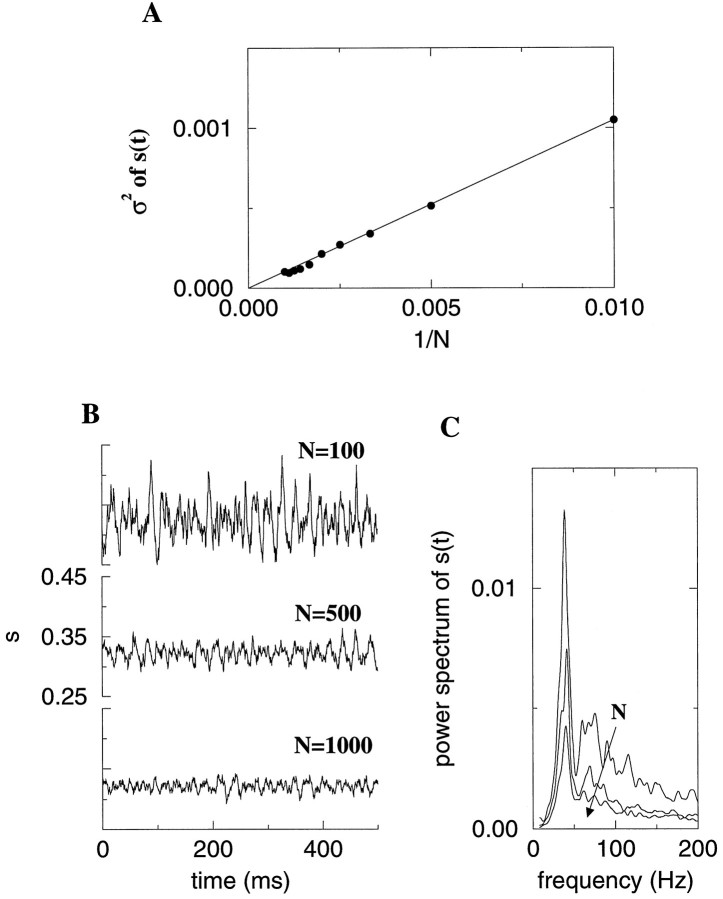
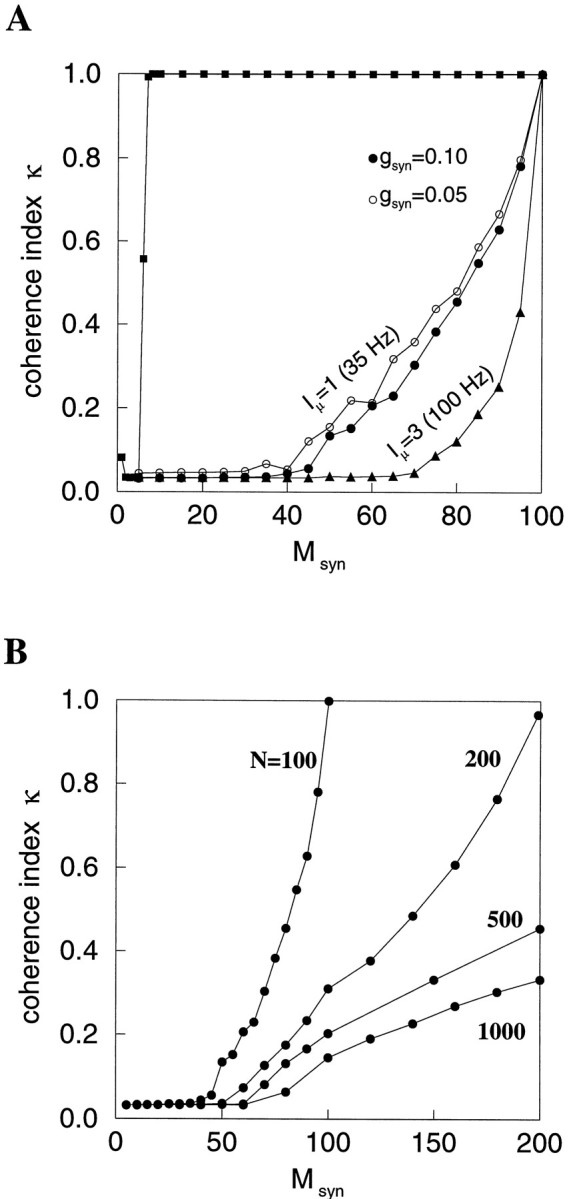
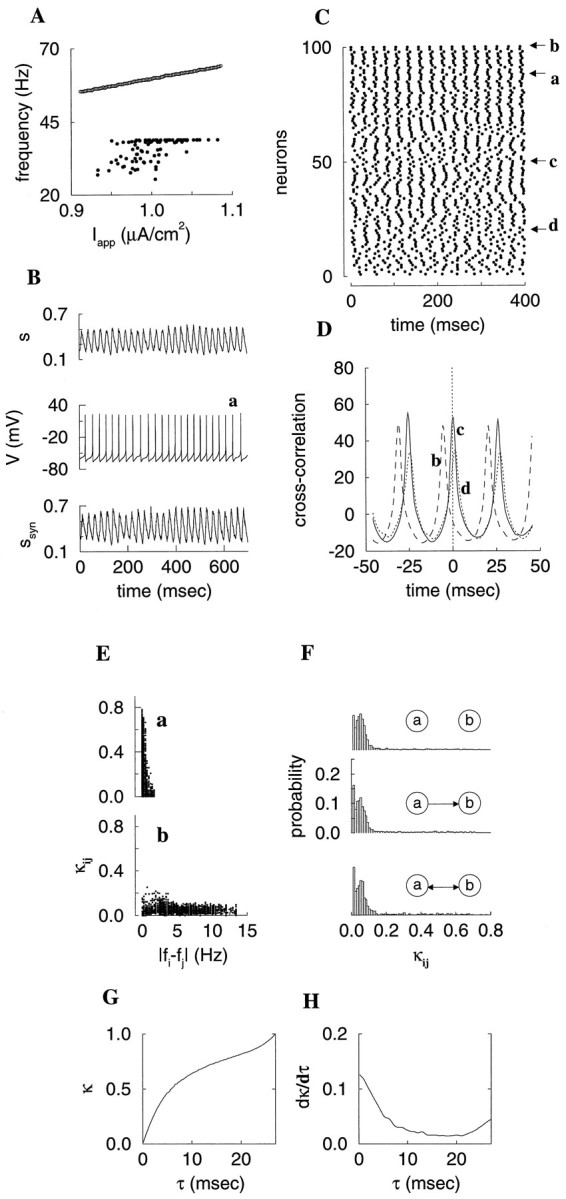
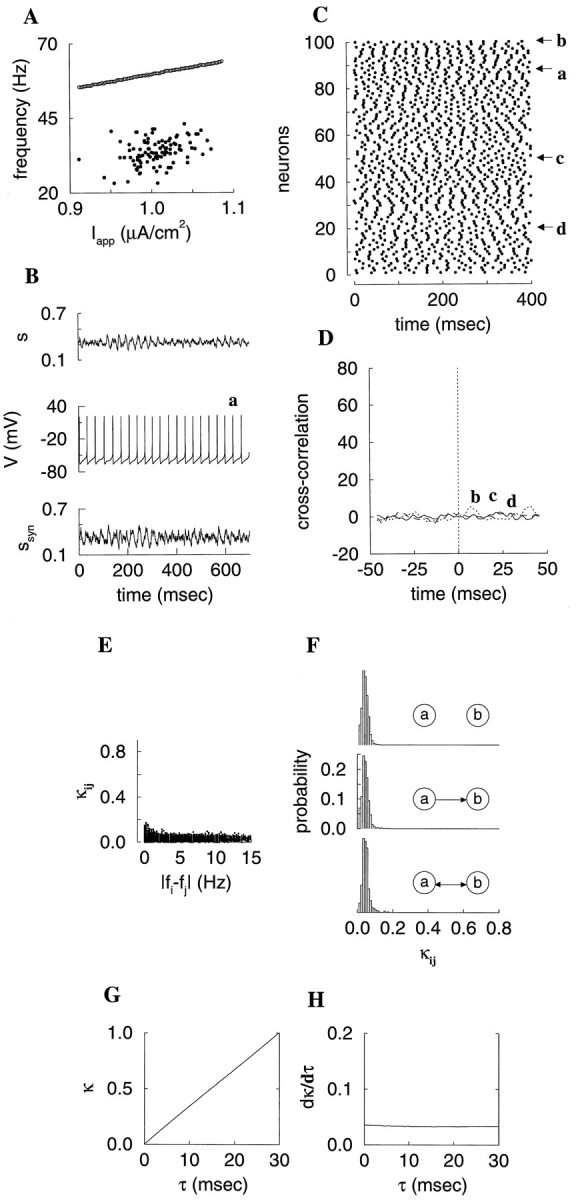
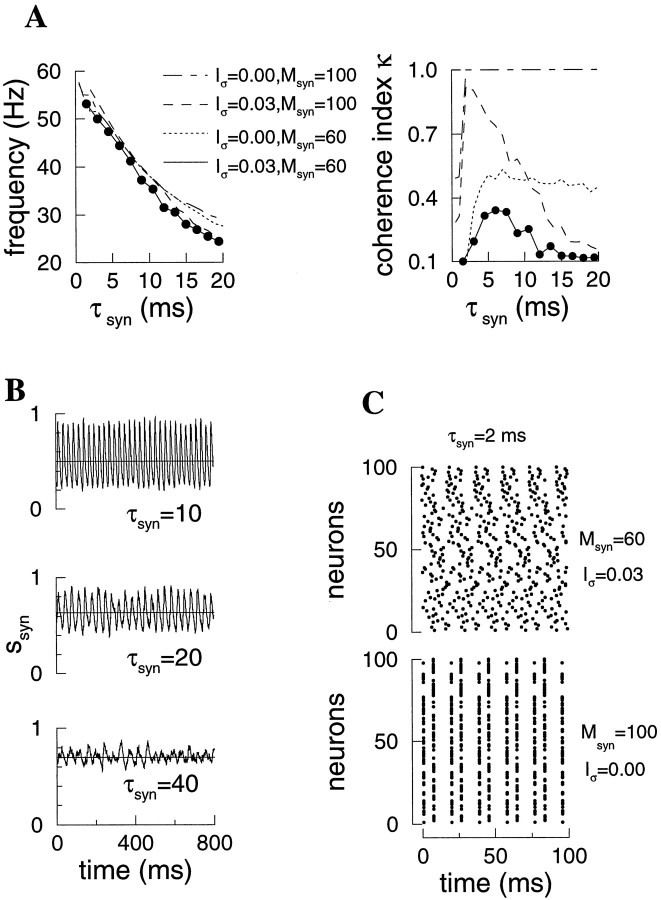
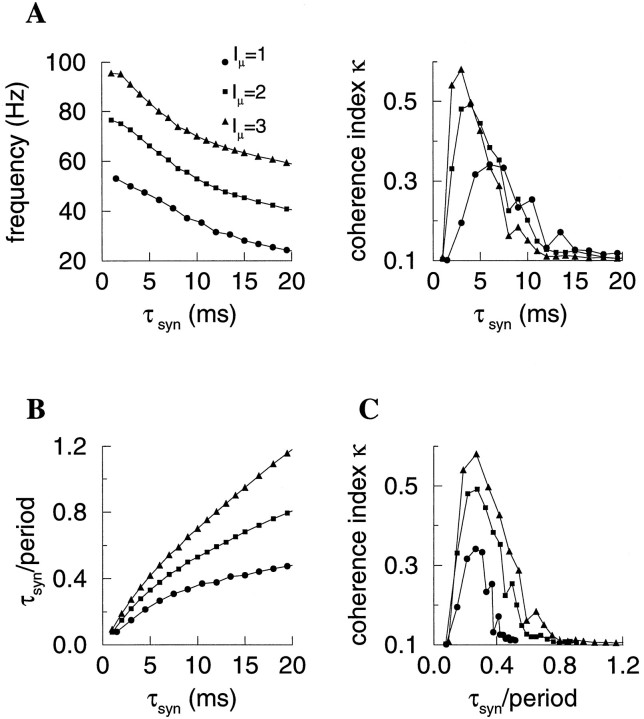
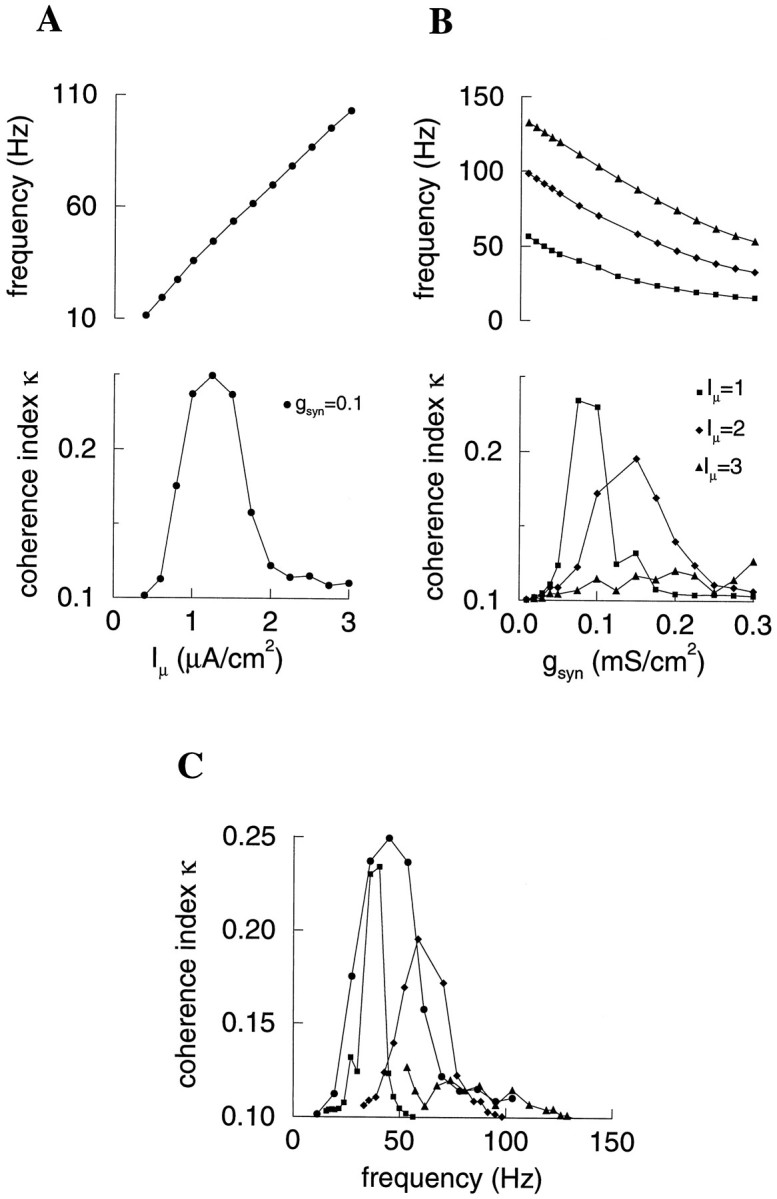
Fast neuronal oscillations (gamma, 20-80 Hz) have been observed in the neocortex and hippocampus during behavioral arousal. Using computer simulations, we investigated the hypothesis that such rhythmic activity can emerge in a random network of interconnected GABAergic fast-spiking interneurons. Specific conditions for the population synchronization, on properties of single cells and the circuit, were identified. These include the following: (1) that the amplitude of spike afterhyperpolarization be above the GABAA synaptic reversal potential; (2) that the ratio between the synaptic decay time constant and the oscillation period be sufficiently large; (3) that the effects of heterogeneities be modest because of a steep frequency-current relationship of fast-spiking neurons. Furthermore, using a population coherence measure, based on coincident firings of neural pairs, it is demonstrated that large-scale network synchronization requires a critical (minimal) average number of synaptic contacts per cell, which is not sensitive to the network size. By changing the GABAA synaptic maximal conductance, synaptic decay time constant, or the mean external excitatory drive to the network, the neuronal firing frequencies were gradually and monotonically varied. By contrast, the network synchronization was found to be high only within a frequency band coinciding with the gamma (20-80 Hz) range. We conclude that the GABAA synaptic transmission provides a suitable mechanism for synchronized gamma oscillations in a sparsely connected network of fast-spiking interneurons. In turn, the interneuronal network can presumably maintain subthreshold oscillations in principal cell populations and serve to synchronize discharges of spatially distributed neurons.


Figures

Fig. 1.
Fig. 1.
Model of single neuron and synapse. A,Left, Firing frequency versus applied current intensity (f − Iapp curve) of the model neuron. The firing rate can be as high as 400 Hz.Right, The derivative df/dIapp shows that the f/Iapp slope is much larger at smallerIapp (lower f) values.B, Dispersion in firing rates caused by heterogeneity in input current. A Gaussian distribution for input currents, with standard deviation Iς = 0.03, is applied to a population of uncoupled neurons. The dispersion in firing rates was computed as the ratio between the standard deviation and the mean of firing rates (fς/fμ). This ratio is much larger for smaller mean current amplitudeIμ (top). Plottingfς/fμ versusfμ shows that the dispersion in firing rates is dramatically increased for fμ < 20 Hz (bottom). C, A brief current pulse applied to a presynaptic cell generates a single action potential, which elicits an inhibitory postsynaptic current (Isyn) and membrane potential change in a postsynaptic cell (gsyn = 0.1 mS/cm2).
Fig. 2.
Fig. 2.
In vivo double staining of parvalbumin-positive interneuron in the hippocampus. A, The axonal arbor of an intracellularly labeled basket cell, largely confined in the pyramidal layer, is overlayed with immunochemically stained other parvalbumin-positive cells. The two-dimensional distribution of the interneuron-interneuron contacts is shown in B and then collapsed to a one-dimensional distribution (along the septo-temporal axis) in C. Overall, 99 boutons in contact with 64 parvalbumin-positive cells were counted (adapted from Sik et al., 1995).
Fig. 3.
Fig. 3.
Synchronization by GABAA synapses. In these simulations, neurons are identical and coupled in an all-to-all fashion. Left panels, Rastergrams; right panels, membrane potentials of two cells (dotted line, −52 mV). The synchrony is realized when the spike AHP of the cells does not fall below the synaptic reversal potential Esyn = −75 mV (dot-dashed line on the right panels). From A to C, φ = 5, 3.33, and 2 respectively;Iapp = 1, 1.2, and 1.4 μA/cm2accordingly to preserve a similar oscillation frequency. With smaller φ values, IK is slower and the AHP amplitude (VAHP) is more negative. WhenVAHP < Esyn, the full synchrony is lost (C).
Fig. 4.
Fig. 4.
Dependence of the network synchrony on the synaptic reversal potential Esyn. A, The coherence index κ (τ = 1 msec) is plotted versusEsyn. As Esyn is varied,VAHP remains essentially the same (vertical dashed line). There is a sudden transition from synchrony to asynchrony as Esyn is increased above VAHP. B, An example of asynchronous behavior when cells are coupled by excitatory synapses (Esyn = 0 mV, τsyn = 2 msec;Iapp = 0.1). The oscillation frequency isf = 43 Hz. C, The network coherence function κ(τ) increases linearly with τ, from 0 (at τ = 0) to 1 (at τ = T), showing that the relative firing time of neural pairs is almost uniformly distributed between 0 and the oscillation period T = 1/f.
Fig. 5.
Fig. 5.
Effects of the network heterogeneity.A, The coherence index κ (τ = 1 msec) versusIς (the standard deviation of the applied current distribution). The network becomes asynchronous forIς ≥ 0.05. Examples indicated byarrows (Iς = 0.03 and 0.1) are illustrated in C–E and F–H, respectively.B, The mean (fμ) and standard deviation (fς) of the firing rates averaged over individual neurons are plotted versusIς. Note a decrease offμ and a linear increase offς for Iς ≥ 0.05. The sensitivity to Iς is related to the steep frequency–current relationship of single cells. C–E, A partially synchronous state. C, The rastergram.D, The coherence function κ(τ) increases with τ rapidly, displays a plateau, and reaches the value of 1 near τ = 1/fμ. E, The derivative of κ(τ) shows a sharp peak at τ = 0. F–H, An asynchronous state, as seen by the rastergram (F). κ(τ) is linear with τ and reaches 1 near τ = 1/fμ(G), and its derivative is flat (H).
Fig. 6.
Fig. 6.
Synaptic field in a large asynchronous network. To demonstrate further the asynchronous nature of the network behavior of Figure 5F–H, the temporal variance ς2(N) of the population synaptic field s(t)was calculated for different network sizes (N = 100, 200, … , 1000). As expected for asynchronoized network states (see text), ς2 (N) decreases as ∼1/N (A). Three examples of s(t) are shown inB, and their power spectra in C (arrowindicating increasing N). Thus, the fluctuations ofs(t) vanish for large network sizes.
Fig. 7.
Fig. 7.
Minimal random connectivity is required for large-scale network synchronization. A, The coherence index κ (τ = 1 msec) is plotted versus the mean number of synaptic inputs per cell Msyn (N = 100).Filled circle, Iμ = 1 andgsyn = 0.1 (reference parameter set). In this case, the network synchrony is realized whenMsyn is larger than a critical valueMcrit ≃ 40. This curve remains essentially the same when the maximal synaptic conductance is reduced by 1/2 (open circle). By comparison, if the number of inputs per cell is identical to all cells, and equals Msyn, the synchrony occurs with very small values ofMsyn (≥5; filled square). WithIμ = 3 (solid triangle), the mean oscillation frequency is increased from 35 to 100 Hz; the critical value of Msyn for the network coherence is much larger (≃70). B, The coherence index κ (τ = 1 msec) versus Msyn for different numbers of neuronsN = 100, 200, 500, 1000 (with reference parameter set). The onset of network coherence occurs at a critical value ofMsyn, which does not grow as a fraction of the network size.
Fig. 8.
Fig. 8.
A partially synchronous state with sparse connectivity (Msyn = 60) and heterogeneity (Iς = 0.03). A, The firing rates of neurons in the network (filled circle) are lower than those when the neurons are uncoupled (open circle). The bias current varies from 0.91 to 1.09, the firing rate from 55 to 63 Hz whengsyn = 0. With gsyn = 0.1, a large fraction of neurons have firing rates close to 39 Hz, the remaining cells have lower firing rates. B, Time traces of the population synaptic field s(t), the membrane potentialV(t) of one cell and its summated synaptic drivessyn(t). C, The rastergram, with the cell shown in B indicated bya. D, The cross-correlations between this cell with three other cells b, c, d indicated in C.E, The coherence index κij (τ = 1 msec) for each of all the pairs in the network, plotted versus the difference in the firing rates ‖fi − fj‖ of the pair. Top, Pairs with oscillation frequencies above 34 Hz; bottom, remaining pairs. Only pairs in the top panel show a high degree of zero-phase synchrony. F, The histograms of κij in three groups of pairs: those not monosynaptically coupled (top), those coupled in one direction (middle), and those coupled in both directions (bottom). The population averaged κ(τ) function shows a steep rise for small τ values (G), and its derivative has a peak at τ = 0 (H).
Fig. 9.
Fig. 9.
Desynchronization with reduced network connectivity. Same as Figure 8, except that Msyn = 30 instead of 60. The network dynamics is asynchronous, as seen by the scattered distribution of firing rates (A), the disordered rastergram (C), the small fluctuations of the synaptic field (B), and flat cross-correlations (D). This asynchronous state is further characterized by small values of κij (E, F), the linear function of the network averaged κ(τ) (G), and its flat derivative (H).
Fig. 10.
Fig. 10.
Synaptic time constant can modulate the oscillation frequency and population synchrony. A, Slowing down the synaptic current decay (with increasing τsyn) decreases the mean oscillation frequency fμ(left), whereas the network coherence shows a peaked region centered at τsyn ≃ 7 msec (solid circle, right). Here, to take into account the change in firing rates, the coherence index κ was calculated with τ = 0.1/fμ. For large τsyn values, the network coherence decreases because of the heterogeneities in the connectivity and external drive, as can be seen by isolating each of the two effects (dotted and dashed lines, respectively). In the absence of both, the coherence is maximal (κ = 1) for τsyn > 4 msec (dash-dotted line).B, Decreased firing frequency is caused partly by the fact that with larger τsyn, the summated synaptic drive has a greater time average (horizontal lines) and shows less oscillatory fluctuations, thus providing an enhanced level oftonic hyperpolarization, which counteracts the depolarizing drive of the cells. C, Rastergram of an asynchronous network with τsyn = 2 msec (top). The globally coupled network of identical cells shows a two-cluster dynamics; thus, it is only partially synchronous (bottom).
Fig. 11.
Fig. 11.
Dependence of the network coherence on the synaptic time constant τsyn. A, The mean oscillation frequency as function of τsyn is shown with three levels of the network drive Iμ(left). The coherence index displays a peak which is shifted to smaller τsyn value with largerIμ (right). B, The ratio between the synaptic time constant τsyn and the oscillation period Tμ increases with τsyn. C, The coherence index versus the ratio τsyn/Tμ. For all threeIμ values, the coherence index peaks at the same τsyn/Tμ (≃0.2) and decreases at smaller ratio values (Msyn = 60, Iς = 0.03; the coherence index κ was calculated with τ = 0.1/fμ).
Fig. 12.
Fig. 12.
High network coherence in the gamma oscillation frequency range. A, With increasing mean driveIμ, the average oscillation frequency monotonically increases (top), but the coherence index κ is large only for intermediate Iμ values (bottom). B, Similarly, as the maximal synaptic conductance gsyn is increased, with stronger inhibitory interactions the average oscillation frequencyfμ monotonically decreases (top). An increase in the external drive shifts the curve upwards. On the other hand, the coherence index κ displays a pronounced peak forIμ = 1, which flattens for largerIμ values (bottom). C, The coherence index is plotted as function offμ for all four curves from (A, B). The macroscopic network coherence is observed only in the gamma range of the oscillation frequencies (20–80 Hz) (Msyn = 60, Iς = 0.03; the coherence index κ was calculated with τ = 0.1/fμ).

References

    1. Aika Y, Ren JQ, Kosaka K, Kosaka T. Quantitative analysis of GABA-like-immunoreactive and parvalbumin-containing neurons in the CA1 region of the rat hippocampus using a stereological method, the disector. Exp Brain Res. 1994;99:267–276. - PubMed
    1. Barkai E, Kanter I, Sompolinsky H. Properties of sparsely connected excitatory neural networks. Phys Rev A. 1990;41:590–597. - PubMed
    1. Bragin A, Jandó G, Nádasdy Z, Hetke J, Wise K, Buzsáki G. Gamma (40–100 Hz) oscillation in the hippocampus of the behaving rat. J Neurosci. 1995;15:47–60. - PMC - PubMed
    1. Buhl EH, Cobb SR, Halasy K, Somogyi P. Properties of unitary IPSPs evoked by anatomically identified basket cells in the rat hippocampus. Eur J Neurosci. 1995;7:1989–2004. - PubMed
    1. Bush PC, Douglas RJ. Synchronization of bursting action potential discharge in a model network of neocortical neurons. Neural Comput. 1991;3:19–30. - PubMed

Publication types