. 1996 Oct 15;16(20):6414-23.
doi: 10.1523/JNEUROSCI.16-20-06414.1996.

Excitatory GABA responses in embryonic and neonatal cortical slices demonstrated by gramicidin perforated-patch recordings and calcium imaging

Affiliations

Excitatory GABA responses in embryonic and neonatal cortical slices demonstrated by gramicidin perforated-patch recordings and calcium imaging

D F Owens et al. J Neurosci. .

Abstract

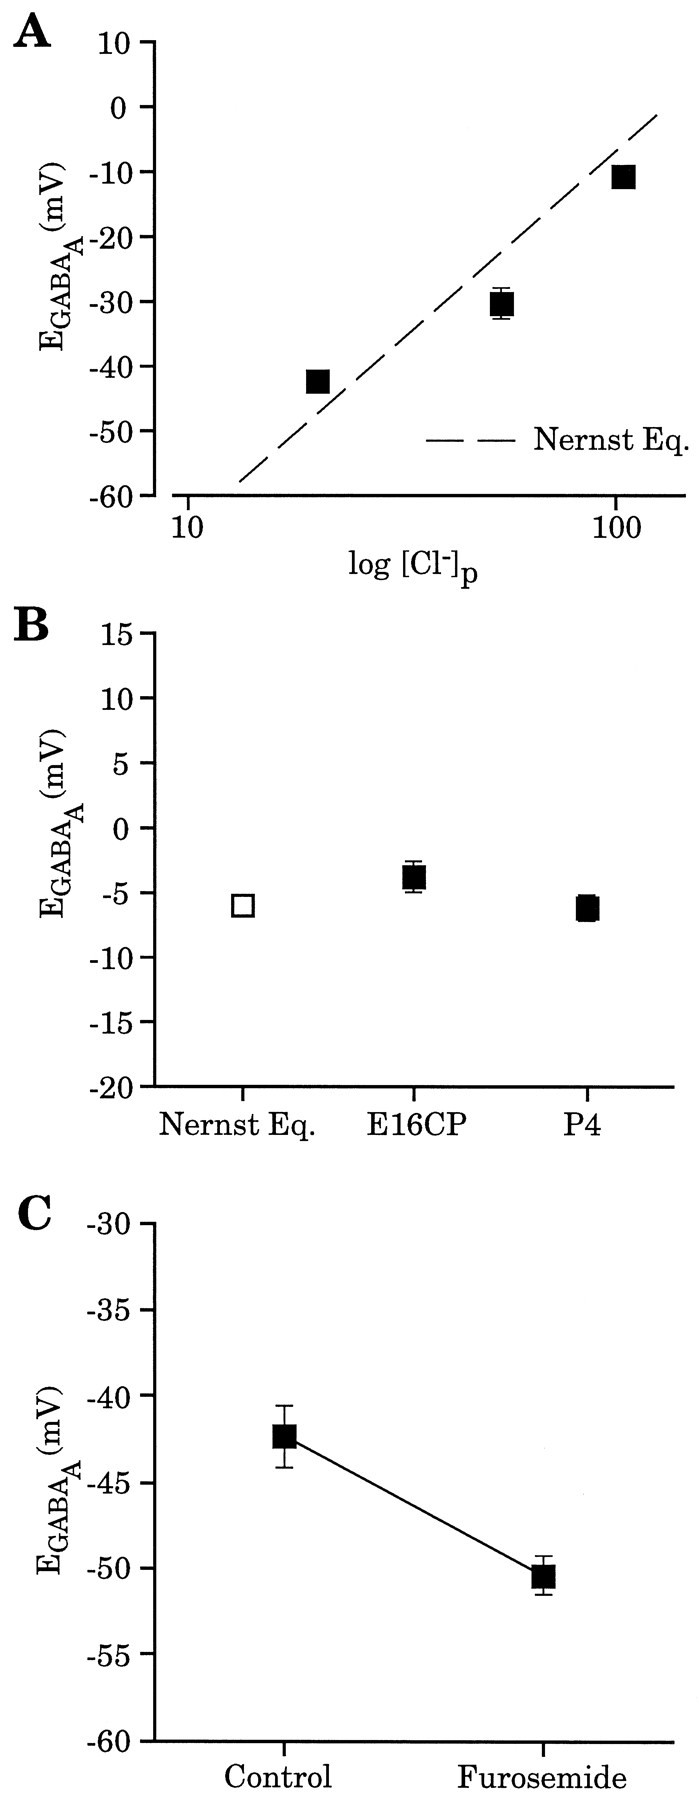
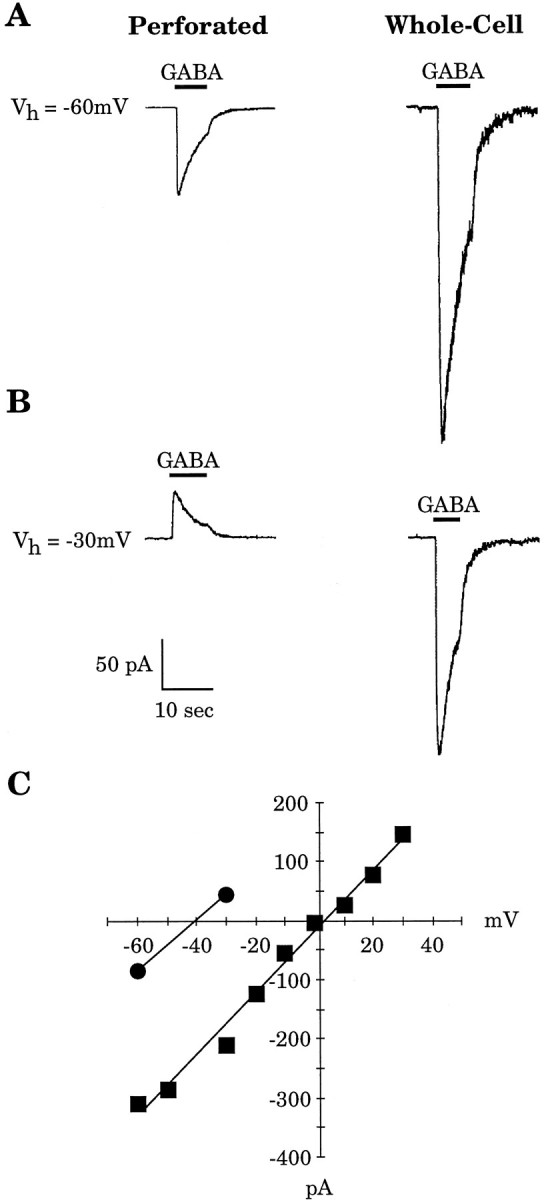
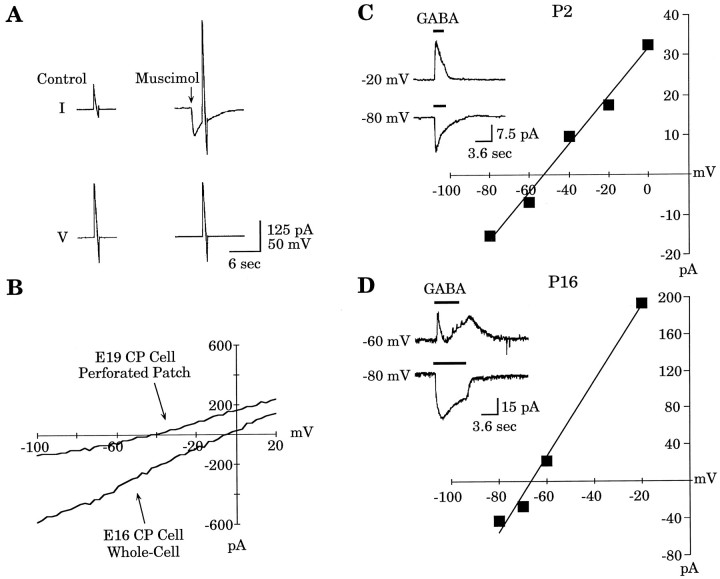
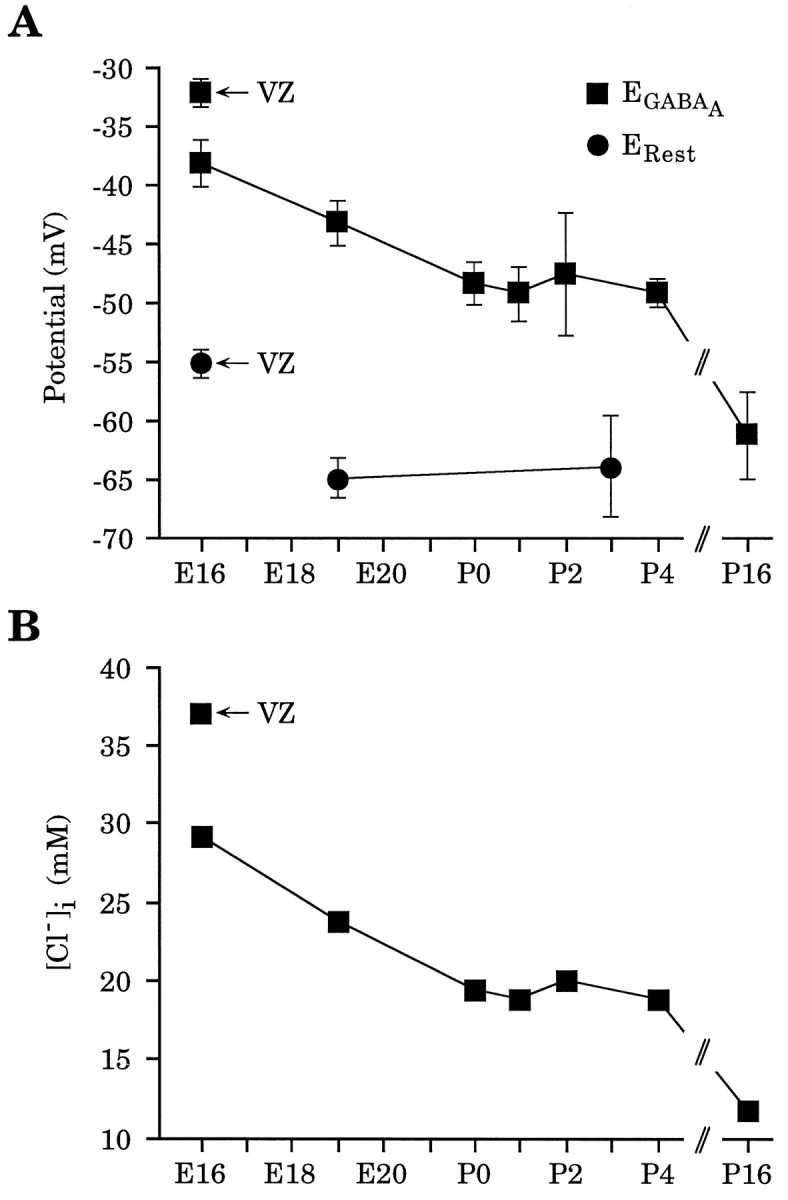
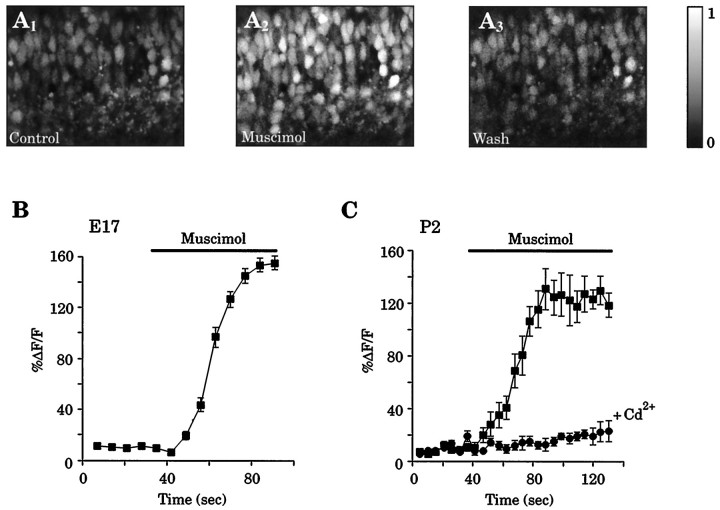
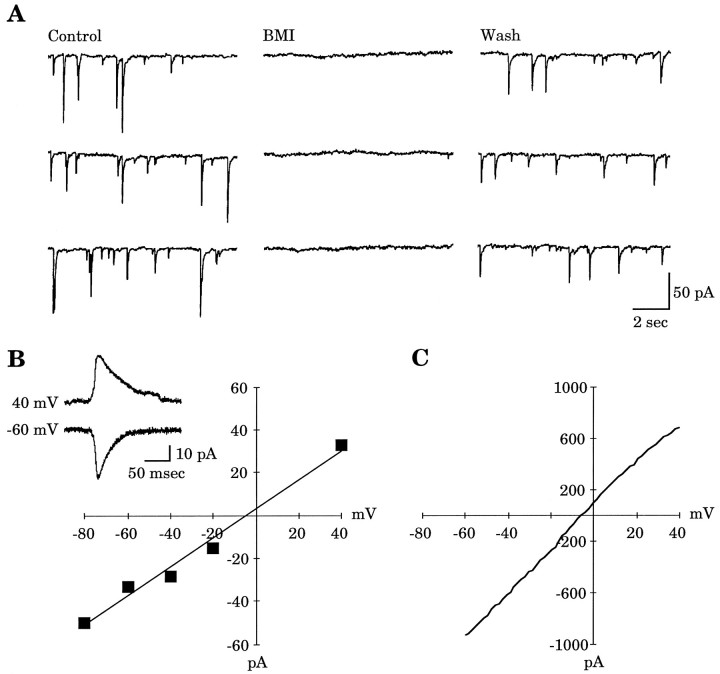
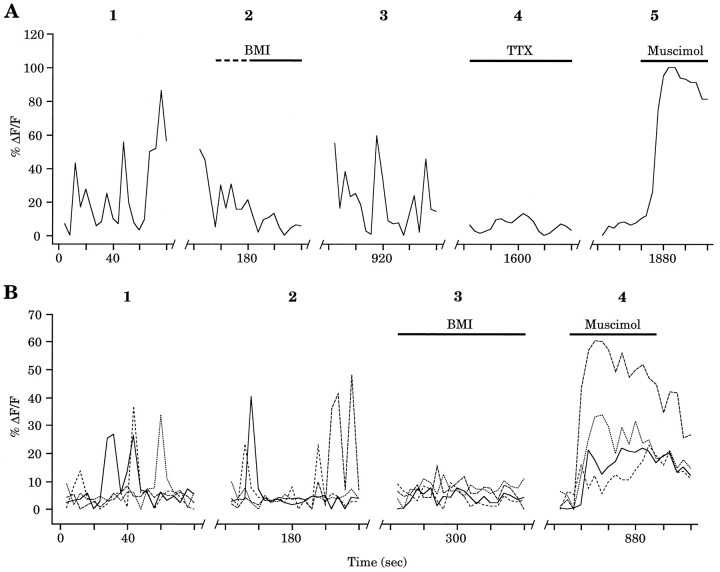
Gramicidin perforated-patch-clamp recordings in brain slices were used to obtain an accurate assessment of the developmental change in the GABAA receptor reversal potential (EGABAA) in embryonic and early postnatal rat neocortical cells including neuroepithelial precursor cells, cortical plate neurons, and postnatal neocortical neurons. Our results demonstrate that there is a progressive negative shift in EGABAA with the most positive values found in the youngest cortical precursor cells. At the early stages of neocortical development, EGABAA is determined by the chloride (Cl-) gradient, and the internal chloride concentration ([Cl-]i) decreases with development. EGABAA is positive to the resting potential, indicating that GABA serves to depolarize developing neocortical cells. Consistent with this conclusion, GABAA receptor activation with muscimol was found-to increase the internal calcium concentration ([Ca2+]i) in both embryonic and early postnatal neocortical cells through the activation of voltage-gated calcium channels (VGCCs). Postnatal cells exhibit spontaneous postsynaptic synaptic currents, which are eliminated by bicuculline methiodide (BMI) but not glutamate receptor antagonists and reverse at the Cl- equilibrium potential. Likewise, brief spontaneous increases in [Ca2+]i, sensitive to BMI and TTX, are observed at the same ages, suggesting that endogenous synaptic GABAA receptor activation can depolarize cells and activate VGCCs. These results suggest that GABAA receptor-mediated depolarization may influence early neocortical developmental events, including neurogenesis and synaptogenesis, through the activation of Ca(2+)-dependent signal transduction pathways.


Figures

Fig. 4.
Fig. 4.
Cl gradient contributes significantly to EGABAA.A, Wholecell recording with different [Cl]p (104 mm,n = 3; 52 mm, n = 4; 20 mm, n = 3) yielded reversal potentials comparable to those predicted by the Nernst equation (dashed line). Recordings were from P4 neocortical neurons; no La3+ was present in these experiments. These data were corrected for liquid junction potentials that were determined experimentally for each solution. B, Absence of a developmental shift in EGABAA using whole-cell recordings ([Cl]p = 104 mm). EGABAA measured in E16 CP cells (−3.9 ± 1.3 mV, n = 5) and P4 neocortical cells (−6.4 ± 1.0 mV,n = 3) had values close to that predicted by the Nernst equation (−6.2 mV) (open square).C, Furosemide (2 mm) application produced a negative shift (−8.1 ± 0.9 mV, n = 3) inEGABAA determined with perforated-patch recordings from E16 CP cells.EGABAAfor each cell was determined both before and after furosemide application, with the average values being −42.4 ± 1.8 and −50.4 ± 1.1 mV, respectively.
Fig. 1.
Fig. 1.
Comparison of gramicidin perforated-patch and whole-cell recordings in the same cell. A,B, The GABA (30 μm)-induced current was measured in an E19 CP cell at holding potentials (Vh) of −60 and −30 mV with a gramicidin perforated patch (traces at left). The recording was subsequently converted to a whole-cell recording, and GABA application was repeated (traces at right). C, TheIV relationship of GABA-induced currents is illustrated for both methods of recording. With the perforated patch, the GABA reversal potential was approximately −40 mV (circles), whereas in whole-cell mode, the reversal potential shifted to ∼0 mV (squares), close to the value predicted by the Nernst equation.
Fig. 2.
Fig. 2.
EGABAA was determined either by muscimol (30 μm) application and voltage ramps or by GABA (30 μm) application with the membrane held at a series of potentials. A, Voltage-ramp protocol applied to an E19 CP cell. B, The resultingIV curve obtained from the recording inA after control-ramp subtraction.EGABAA is approximately −40 mV. For comparison, an IV curve obtained from an E16 CP cell in whole-cell mode is shown. C,IV relationship for a P2 neocortical neuron with a reversal potential of approximately −52 mV. Theinset shows the GABA-induced current at two membrane potentials. Note the monophasic response at both holding potentials.D, IV relationship for a P16 neocortical neuron with a reversal potential of approximately −66 mV. The inset shows the GABA-induced current at two membrane potentials. Note the greater complexity of the response at the −60 mV holding potential.
Fig. 3.
Fig. 3.
There is a progressive negative shift inEGABAA over development.A, Pooled reversal potentials derived from experiments using either GABA or muscimol as agonist. Also plotted are the resting membrane potentials (ERest) (see Results). Because resting potential measurements for VZ and CP cells were made on E15–E17 and E18–E19, respectively, their placement on the graph is approximate. For EGABAA,n = 6 for E16 VZ; n = 14 for E16 CP; n = 22 for E19 CP; n = 3 for P0; n = 5 for P1; n = 3 for P2; n = 7 for P4; n = 5 for P16. B, [Cl]i calculated from combined data in A using the Nernst equation. Values are as follows, E16 VZ, 37.0 mm; E16 CP, 29.2 mm; E19 CP, 23.8 mm; P0, 19.4 mm; P1, 18.8 mm; P2, 20.0 mm; P4, 18.8 mm; P16, 11.7 mm.
Fig. 5.
Fig. 5.
Muscimol (30 μm) produces increases in [Ca2+]i in developing cortical cells.A, Confocal image of E17 CP cells loaded with the Ca2+ indicator fluo-3AM before (1), during (2), and after (3) application of muscimol (30 μm). Pial surface is to thetop of the image. B, Eight cells were randomly chosen from the microscopic field in A, and the increases in [Ca2+]i were calculated, averaged, and expressed as mean ΔF/F(see Materials and Methods). C, Mean change in [Ca2+]i for eight randomly selected cells from a P2 neocortical slice after application of 30 μmmuscimol (squares). After a 30 min recovery period, a second muscimol application, in the presence of 500 μmCd2+, failed to elicit [Ca2+]iincreases in the same cells (circles).
Fig. 6.
Fig. 6.
Activation of GABAA receptors by both endogenously released GABA and exogenously applied muscimol (30 μm) yields similar reversal potentials. A, Examples of sPSCs recorded in control conditions (Control), during 10 μm BMI application (BMI), and after BMI was washed out (Wash). Application of AP-5 (100 μm) did not abolish the sPSCs (data not shown). All recordings are in the presence of 10 μm CNQX in the bath solution.Vh = −60 mV. B,IV curve derived from averaged sPSCs at five membrane potentials with an approximate reversal potential of −4.1 mV. Inset shows averaged sPSCs at two membrane potentials. C, The muscimol inducedIV curve for the same cell as show inB, with an EGABAA of −5.4 mV.
Fig. 7.
Fig. 7.
Spontaneous increases in [Ca2+]i in postnatal neocortical cells are mediated by GABAA receptor activation. A, Spontaneous Ca2+ transients in a P1 neocortical cell (1) were reversibly blocked by BMI (30 μm) (2, 3). TTX (2 μm) also could eliminate the spontaneous increases in [Ca2+]i (4). 2Shows activity during wash in of bicuculline (indicated by thedashed line), whereas 4 shows activity 3 min after wash in of TTX. The muscimol (30 μm)-mediated increase in [Ca2+]i (5) suggests the presence of GABAA receptors on this cell. Breaks in the x-axis represent ∼1, 10, 10, and 3 min, respectively. B, Combined data from four P3 neocortical cells. Each cell had at least one spontaneous increase in [Ca2+]i during two control recording periods (1, 2). In the presence of BMI, no additional spontaneous increases in [Ca2+]iwere observed (3). BMI application began ∼1 min before data acquisition. As in A, muscimol (30 μm) application also produced [Ca2+]i increases (4). Breaks in the x-axis represent ∼1, 1, and 8 min, respectively.

References

    1. Abe Y, Furukawa K, Itoyama Y, Akaike N. Glycine response in acutely dissociated ventromedial hypothalamic neuron of the rat: new approach with gramicidin perforated patch-clamp technique. J Neurophysiol. 1994;72:1530–1537. - PubMed
    1. Alger BE, Nicoll RA. Pharmacological evidence for two kinds of GABA receptor on rat hippocampal pyramidal cells studied in vitro. J Physiol (Lond) 1982;328:125–141. - PMC - PubMed
    1. Andersen P, Dingledine R, Gjerstad J, Langmoen IA, Lauresen AM. Two different responses of hippocampal pyramidal cells to application of gamma-amino butyric acid. J Physiol (Lond) 1980;305:279–296. - PMC - PubMed
    1. Araki T, Kiyama H, Tohyama M. GABAA receptor subunit messenger RNAs show differential expression during cortical development in the rat brain. Neuroscience. 1992;51:583–591. - PubMed
    1. Barbin G, Pollard H, Gaiarsa JL, Ben-Ari Y. Involvement of GABAA receptors in the outgrowth of cultured hippocampal neurons. Neurosci Lett. 1993;152:150–154. - PubMed

Publication types

LinkOut - more resources