. 1996 Oct 15;16(20):6443-53.
doi: 10.1523/JNEUROSCI.16-20-06443.1996.

Development of orientation preference maps in ferret primary visual cortex

Affiliations

Development of orientation preference maps in ferret primary visual cortex

B Chapman et al. J Neurosci. .

Abstract

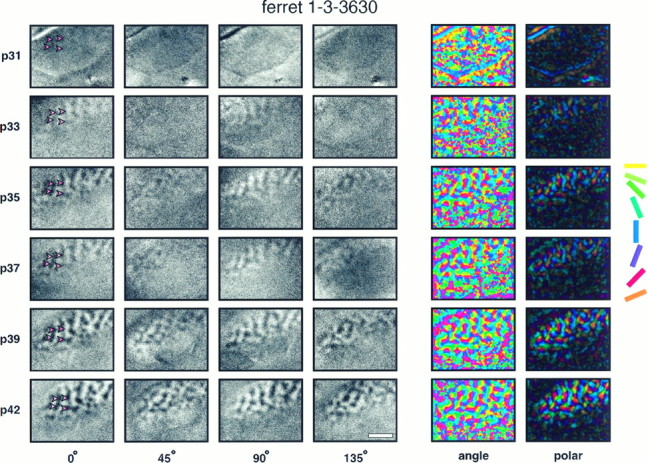
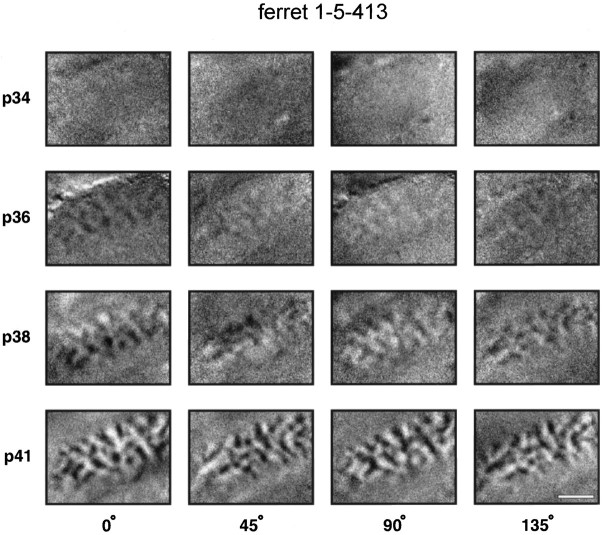
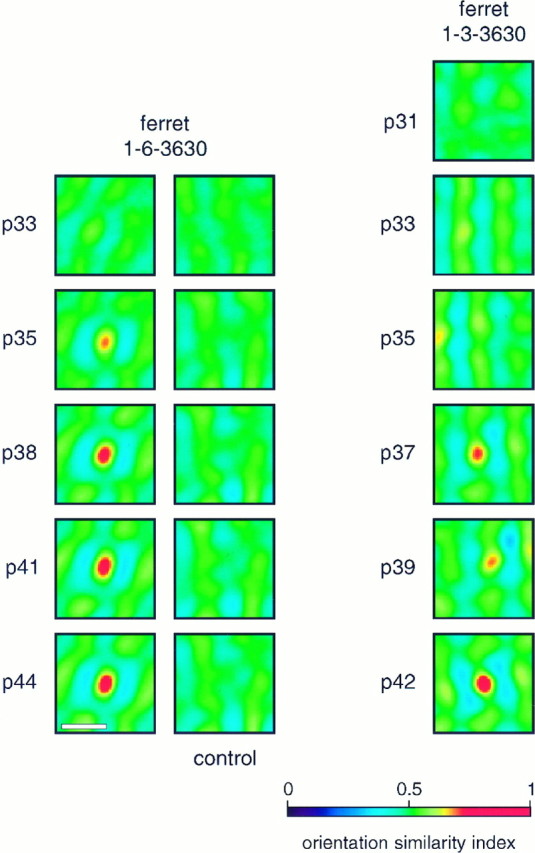
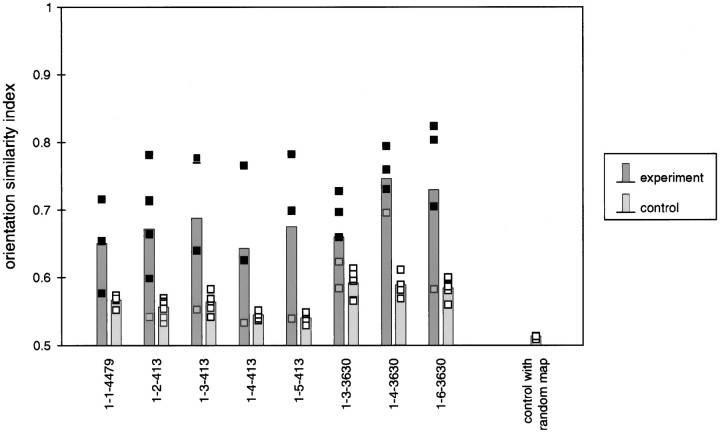
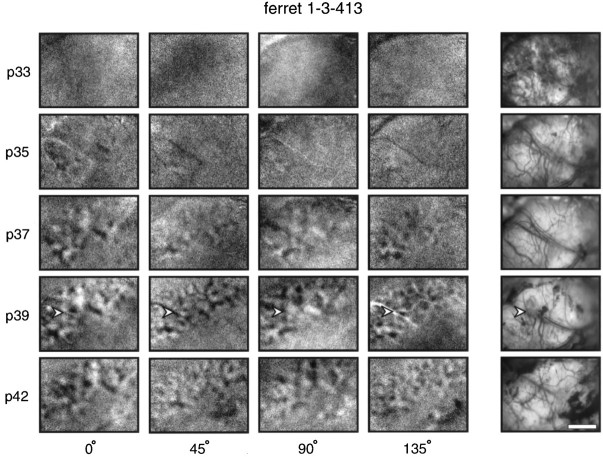
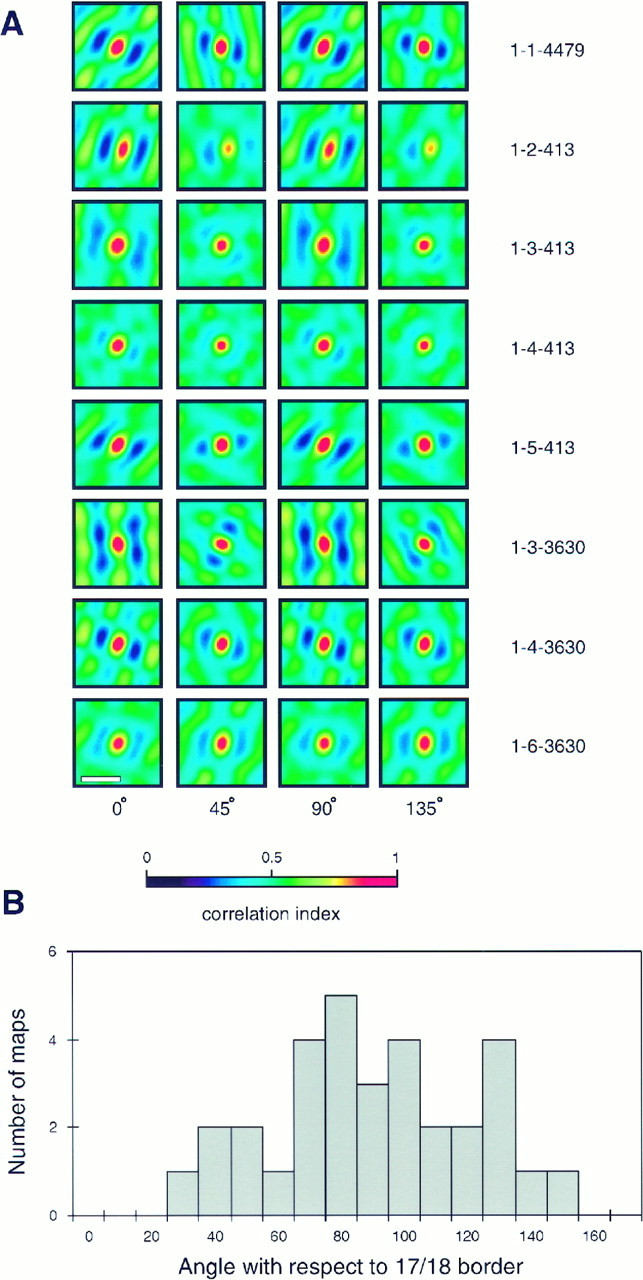
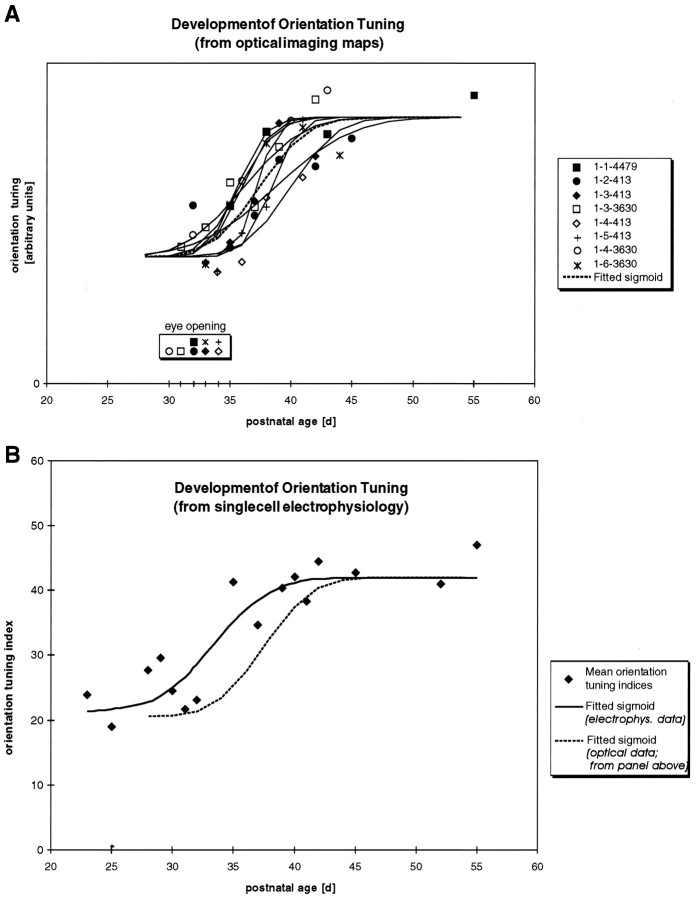
The development of orientation preference maps was studied in ferret primary visual cortex using chronic optical imaging of intrinsic signals. The emergence and maturation of the maps were examined over time in single animals. The earliest age at which cortical domains selectively responsive to particular stimulus orientations were observed varied considerably between individuals, from postnatal day 31 to 36. In all cases, the earliest maps seen were low-contrast, with regions of orientation-specific activity that were difficult to distinguish from noise. These early maps matured over a period of several days into the high-contrast, patchy maps typical of adult animals. The structure of the orientation maps was remarkably constant over time. The indistinct features in the earliest maps were always patches of the same sizes and shapes and at the same locations as in the maps obtained in subsequent recording sessions. Details of the more mature maps, including the relative intensities of individual iso-orientation domains, were also constant from one recording session to another over periods of several weeks. The patterning of iso-orientation domains in ferret primary visual cortex thus is established early in development and remains stable over time, unaffected by either normal visual experience or the anatomical rearrangements of geniculocortical afferents into eye-specific domains.


Figures

Fig. 1.
Fig. 1.
Development of orientation maps revealed by chronic optical imaging. Single-condition orientation maps, angle maps, and polar maps recorded at six different ages in one animal. Each row of the figure shows orientation maps recorded in the left primary visual cortex of one ferret at the age indicated at theleft of the row. Each column of single-condition maps shows orientation maps recorded in response to a particular orientation of a moving square-wave grating (0° = horizontal). For each map, caudal is up and medial is to the left. The curve in the upper left corner of each map indicates the location of the caudal pole of the cortex behind which the skull remained intact over the cerebellum. The approximate location of the area 17/18 border can be seen in each image as a linerostral to which no orientation activity is seen. In this example, the first clear orientation maps can be seen at P33. Early maps are stronger for horizontal and vertical orientations than for the two obliques. Individual iso-orientation domains remain stable over time and do not change their position, shape, or size. The four red arrows shown in each horizontal single-condition map highlight this stability by pointing to particular features in the map. The information from activity maps in response to all four orientations of stimuli are combined into a single color-coded angle and polar map using vectorial addition on a pixel-by-pixel basis. In angle maps, the hue of each pixel indicates the preferred orientation of cells at that location in cortex. The hue coding scheme is shown to theright of the figure. In polar maps, the hue again indicates the preferred orientation, whereas now the brightness of the color also indicates the strength of orientation tuning. At early ages, the polar maps are almost completely dark, indicating that there were no regions of the cortex that showed tightly tuned orientation-specific responses. As the maps mature, iso-orientation domains become visible as colored regions in the map. These domains become more strongly responsive over time, and more domains appear as the maps mature. Scale bar, 2 mm.
Fig. 2.
Fig. 2.
Concurrent development of all orientation maps. Single-condition orientation activity maps from a second ferret. In this animal, activity maps for all orientations developed at the same rate. Note that in this ferret the first orientation maps are visible at a substantially later time (P36) than in the example shown in Figure1. All conventions as in Figure 1.
Fig. 3.
Fig. 3.
Orientation similarity plots. Orientation similarity plots for two animals. For both animals, plots comparing early maps with the most mature maps are shown. For ferret 1-6-3630, control data comparing early maps with the mature map from a different animal are shown. Ferret 1-3-3630 is the animal illustrated in Figure1. Scale bar, 1 mm.
Fig. 4.
Fig. 4.
Stability of orientation maps. The maximum similarity index calculated from the orientation similarity plots (see Fig. 3) for all animals at all ages is shown. Filled squares show within-animal comparisons and open squares show between-animal (control) comparisons. The height of the histogram bars indicates the mean of the maximum orientation similarity indices for each animal at all ages.Gray squares indicate data from immature maps recorded before P35. Additional control data showing the comparison of mature maps in each animal with a map consisting of randomized pixels is shown at the far right.
Fig. 5.
Fig. 5.
“Disorganized” activity maps seen in one animal. Single-condition activity maps from one animal in which orientation activity maps did not have the usual spotty or stripy appearance seen in the other ferrets in this study. Instead, maps appeared “disorganized.” This structure of the map was real, as it was reproducible between experiments performed at different ages of the animal. It was not attributable to blood vessel artifacts, as shown by the photographs of the cortical surface showing blood vessel patterns illustrated in the right-most column. There are some blood vessel artifacts in these maps (one example is indicated by thearrowheads in the maps recorded at P39), but they are easily discernible and they do not account for the observed activity pattern. Scale bar, 2 mm.
Fig. 6.
Fig. 6.
Spatial structure of orientation preference maps.A, Two-dimensional spatial auto-correlograms are shown for mature single-condition orientation maps in each animal. Scale bar, 1 mm. B, Histogram of the angle between the angle of the best-fitting sine-wave grating and the area 17/18 border for all animals.
Fig. 7.
Fig. 7.
Comparison of the development of orientation tuning assessed by optical imaging and electrophysiology.A, Orientation tuning derived from polar maps for each animal at each age studied. Solid curves show the best-fit cumulative Gaussian sigmoid curve for individual animals. Thedashed line indicates the best-fit curve for data from all eight animals. The time of eye opening for each animal is also indicated. Although orientation maps did begin to appear about the time of eye opening, note that early eye opening was not always correlated with early development of maps. B, Orientation tuning assessed electrophysiologically from single-unit recordings compared with optical imaging of the development of orientation tuning. Single-unit data from Chapman and Stryker (1993). Mean orientation tuning indices derived from orientation tuning histograms collected from single-unit recordings are shown for 16 animals of different ages. Note that values of this orientation tuning index greater than 25–30 correspond to a significantly biased response in favor (Figure legend continues) of one orientation. Values of this index measured on neurons in the lateral geniculate nucleus of the ferret were <25; the median value for neurons in primary visual cortex of the cat was 55–60 (Chapman and Stryker, 1993). The solid curve indicates the best sigmoid-fit curve through these data. The best-fit curve for the optical imaging data (dashed line) is replotted from Figure 7A for comparison. The mean of the best-fit sigmoid for the electrophysiological data is 4 d earlier (P33.4) than the mean for the optical imaging data (P37.4).

References

    1. Albus K. 14C-deoxyglucose mapping of orientation subunits in the cat’s visual cortical areas. Exp Brain Res. 1979;37:609–613. - PubMed
    1. Albus K, Wolf K. Early postnatal development of neuronal function in the kitten’s visual cortex: a laminar analysis. J Physiol (Lond) 1984;348:153–185. - PMC - PubMed
    1. Antonini A, Stryker MP. Rapid remodeling of axonal arbors in the visual cortex. Science. 1993;260:1819–1821. - PubMed
    1. Barlow HB, Pettigrew JD. Lack of specificity of neurones in the visual cortex of young kittens. J Physiol (Lond) 1971;218:P98–P100. - PubMed
    1. Blakemore C, Cooper GF. Development of the brain depends on the visual environment. Nature. 1970;228:477–478. - PubMed

Publication types

LinkOut - more resources