. 1996;5(6):285-300.

Direct and indirect mechanisms of repression participate in suppression of T-cell-specific gene expression in T x L-cell hybrids

Affiliations

Direct and indirect mechanisms of repression participate in suppression of T-cell-specific gene expression in T x L-cell hybrids

L Shurman et al. Gene Expr. 1996.

Abstract

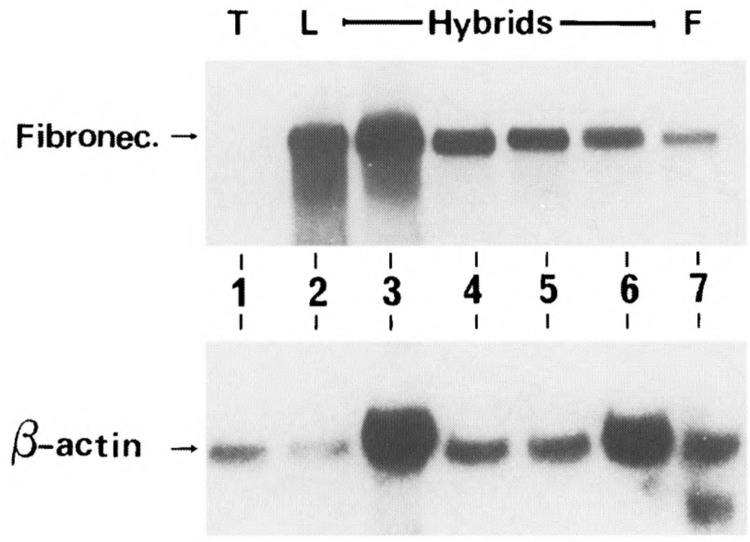
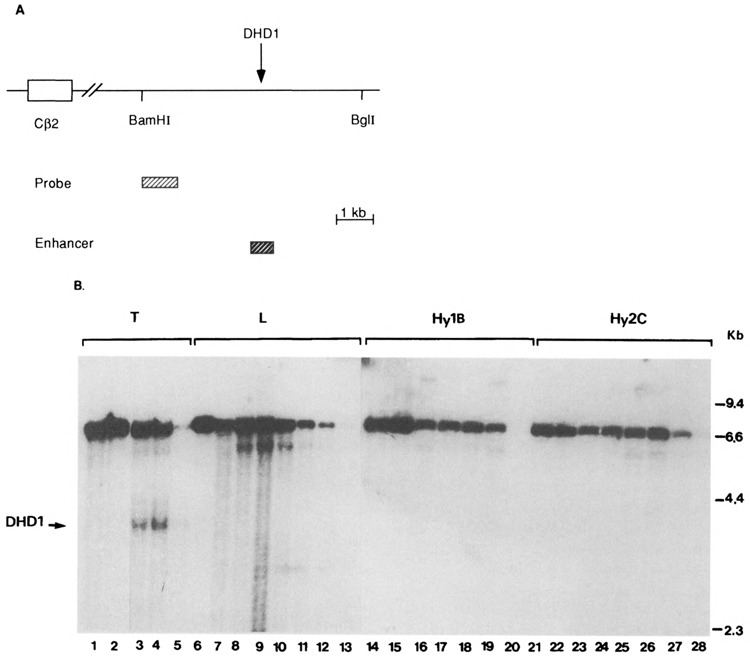
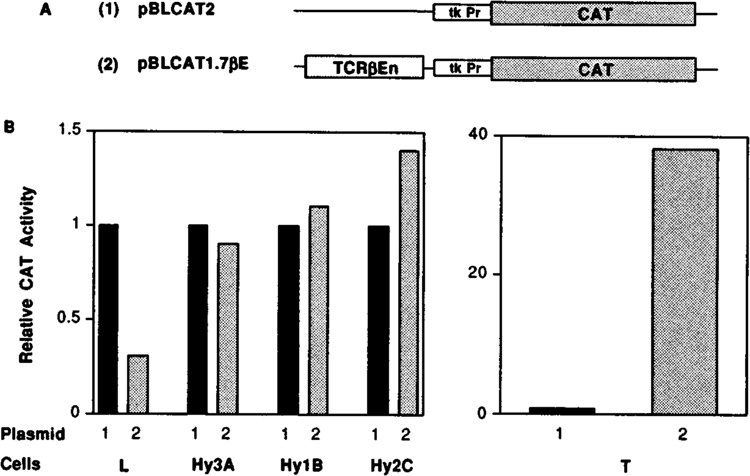
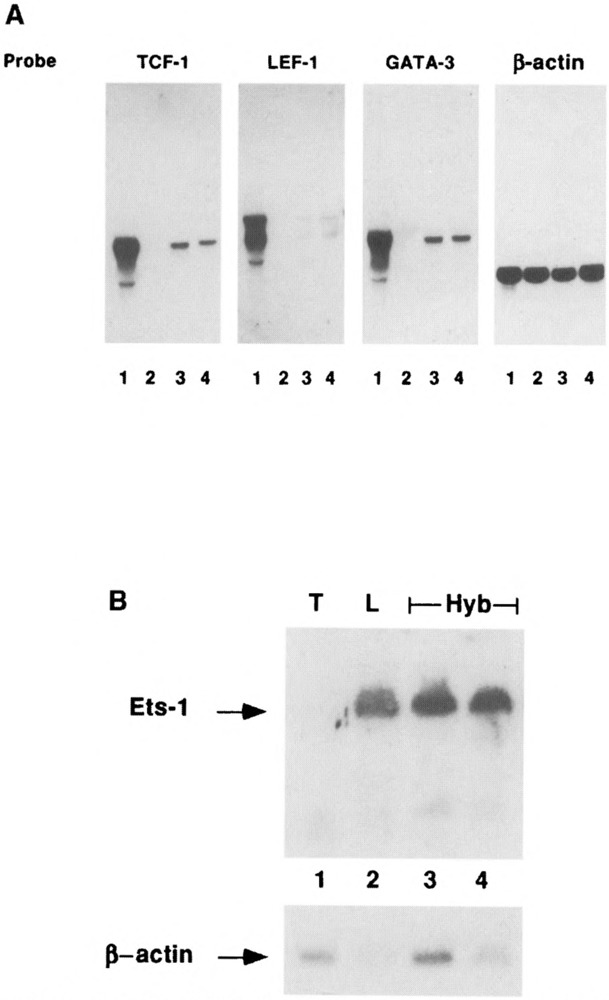
Expression of tissue-specific genes can be altered upon fusion of mammalian cells of different types. To resolve the genetic basis of this phenomenon and to identify components of the regulatory circuits that are involved, we have established a series of somatic cell hybrids between mouse T cells and L cells. These hybrids have an unusual and interesting phenotype. Unlike many hybrid cells studied, in which the expression of an entire set of tissue-specific genes was coordinately extinguished, in our T x L-cell hybrids only two out of seven T-cell-restricted genes were completely extinguished, whereas the other genes were repressed to various degrees. These hybrids extinguish the production of TCR beta and Thy-1 mRNA, repress the expression of TCR alpha, GATA-3, TCF-1, and LEF-1 genes to different extents, exhibit small changes in the level of CD3-epsilon mRNA, and continue to express the fibroblast-specific fibronectin gene, and the ets-1 gene. In this study we have evaluated for the first time the molecular mechanisms that underlie the repression of TCR alpha and TCR beta chain genes in T x L-cell hybrids. We have shown that multiple repression mechanisms, both direct and indirect, contribute to TCR alpha and TCR beta suppression. Repression of the expression of these genes correlated not only with the downregulation of GATA-3, TCF-1, and LEF-1 transcription factor expression, and with a change in the chromatin structure, but more importantly, with the activation of the silencer activity. Our study provides evidence for the existence of at least two negatively regulating elements, located at the TCR alpha enhancer-containing fragment and at the silencer region, which are active in our hybrid cells. We have shown that there was no correlation between the levels of GATA-3, TCF-1, and LEF-1 expression versus the level of TCR alpha mRNA in the independent hybrids. In contrast, both the silencer activity and the ability of the TCR alpha enhancer to downregulate thymidine kinase (TK) promoter activity were found to be in an inverse correlation with the ability of the different hybrid cells to express TCR alpha mRNA.


Figures

FIG. 1
FIG. 1
Expression of TCRα and CD3-ϵ genes in T × L-cell hybrids. (A) Total RNA (15 μg) isolated from parental (BW5147 and L) and hybrid cells were electrophoresed on 1.0% agarose-formaldehyde gels, transferred to nitrocellulose, and hybridized with a 1.0-kb EcoRI DNA fragment containing the TCRα cDNA sequence. (B) RNA was hybridized with a 1.4-kb EcoRI DNA fragment containing the CD3-ϵ cDNA sequence. Blots were stripped and rehybridized with a β-actin probe. (A) Lanes 1–11: BW5147, L, Hy1A, Hy2A, Hy3A, Hy1B, Hy3B, Hy4B, Hy1C, Hy2C, and Hy4C, respectively. (B) Lanes 1–12: BW5147, L,Hy1A, Hy2A, Hy3A, Hy1B, Hy3B, Hy4B, Hy1C, Hy2C, Hy3C, and Hy4C, respectively.
FIG. 2
FIG. 2
Repression of Thy-1 gene expression in T × L-cell hybrids. (A) Total RNA (15 μg) from parental and hybrid cells were electrophoresed through formaldehyde/agarose gel, transferred to Nytran membranes, and hybridized with labeled Thy-1 cDNA probe. Lanes 1–12: BW5147, L, Hy1A, Hy2A, Hy3A, Hy1B, Hy3B, Hy4B, Hy1C, Hy2C, Hy3C, and Hy4C, respectively. (B) Different amounts of total BW5147 RNA (10, 5, and 1 μg; lanes 1–3, respectively) and poly(A)+ RNA of Hy1A (10, 5, and 1 μg; lanes 4–6, respectively) were hybridized with Thy-1 cDNA radioactive probe. The blots were stripped, rehybridized with a β-actin cDNA probe, and shown in the lower parts of this figure.
FIG. 3
FIG. 3
Repression of TCRβ chain mRNA in T × L-cell hybrids. (A) Total RNA (15 μg) from parental and hybrid cells were electrophoresed through formaldehyde/agarose gel, transferred to Nytran membranes, and hybridized with a labeled TCR-Cβ radioactive probe. Lanes 1–10: BW5147, L, Hy1A, Hy2A, Hy3A, Hy1B, Hy3B, Hy4B, Hy1C, and Hy3C, repectively. (B) Total BW5147 RNA (10, 5, 2.5, and 1 μg; lanes 1–4, respectively), poly(A)+ mRNA of Hy1A (2, 5, and 10 μg; lanes 5–7, respectively), and Hy3C poly(A)+ mRNA (1, 2, and 3 μg; lanes 8–10, respectively) were hybridized with a labeled TCR-Cβ chain probe. The blots were stripped and rehybridized with a β-actin cDNA probe. The blots containing the β-actin transcripts are shown in the lower parts of this figure. (C) Analysis of germ line and rearranged TCRβ chain genes in T × L cell hybrids. DNA of parental [L and T (BW5147)] and hybrid cells (15 μg) was digested with EcoRI, electrophoresed on 1% agarose gel, and transfered to Nytran paper. The blot was hybridized to a TCR-Cβ probe and autoradiographed. Hybrids 1–5 are Hy2A, Hy3A, Hy1B, Hy3B, and Hy2C respectively. Bands 4.4 kb and 2.3 kb represent the germ line TCR-Cβ gene and the 2.0-kb band represent the productively rearranged TCR-Cβ in T(BW5147) cells. Note that all the hybrids contain the 2.0-kb band.
FIG. 4
FIG. 4
Expression of fibronectin gene in T × L-cell hybrids. Total RNA (15 μg/lane) of the parental (T, L) and hybrid cells were electrophoresed, blotted, and hybridized with a labeled fibronectin radioactive probe. Lanes 1–7: BW5417, L, Hy1B, Hy2A, Hy2C, Hy3A, and normal embryonic fibroblast from C3H mouse (F), respectively. The blot was stripped, rehybridized with a β-actin cDNA probe, and is shown in the lower part of this figure.
FIG. 5
FIG. 5
Mapping of DNase-I hypersensitive regions in parental and hybrid cell lines. (A) A map of the mouse TCRβ 3′ region. The region examined for DNase-I hypersensitivity is downstream of the Cβ2 region between the two indicated BamHI and BglI restriction sites. The probe used for Southern blots and the region encompassing the TCRβ enhancer are indicated. (B) DNase-I hypersensitivity of the TCRβ BamHI-BglI region in T cells (lanes 1–5), L cells (lanes 6–13), Hy1B (lanes 14–20), and Hy2C (lanes 21–28). DNase-I-treated DNA was double digested with BamHI and BglI and analyzed by Southern blotting. Lanes 1, 6, 14, and 21 are from nuclear samples lysed without prewarming to 37°C. The absence of subbands in these samples indicates the absence of endogenous nuclease activity during preparation of nuclei. We treated the nuclei at 37°C for 2 min. The T-cell nuclei (lanes 2–5) were treated with 0, 2, 3, and 5 units of DNase-I, respectively. The L-cell nuclei (lanes 7–13) and Hy2C nuclei (lanes 22–28) were treated with 0, 1, 2, 3, 4, 5, and 10 units of DNase-I, respectively. The Hy1B nuclei (lanes 15–20) were treated with 0, 2, 3, 4, 5, and 10 units of DNase-I, respectively. The nuclear incubations in the absence of added DNase-I reveal the extent of endogenos nuclease cleavage within the given time period. The arrow indicates the position of a T-cell-specific subband generated from the hypersensitive DNase-I site defined in the DHD1 region (28). This band is absent in the hybrids. There is an additional subband of 6 kb that is generated by DNase-I, and appears in all cell lines and thus is not a T-cell-specific band.
FIG. 6
FIG. 6
Expression of CAT gene linked to TCRβ chain enhancer is downregulated in T × L-cell hybrids. (A) A schematic representation of pBLCAT2 and pBLCAT1.7βE plasmids. The pBLCAT2 plasmid contains the TK promoter inserted in front of the CAT transcription unit, and the pBLCAT1.7βE contains the 1.7-kb BamHI fragment harboring the TCRβ enhancer cloned at the BamHI site located 5′ to the TK promoter. (B) Parental (BW5147, and L) and hybrid cells were cotransfected with 15 μg of either pBLCAT2 or pBLCAT1.7βE together with 2 μg of pCMV-β-gal DNA. After 48 h, cells were harvested, lysed, and CAT activities were determined and quantitated on a Phospholmager by using ImageQuant Software. The percent conversion of each separate transfection was normalized to the β-galactosidase activity. The values for percent conversion, presented as means ± SDs, corresponding to pBLCAT2 and pBLCAT1.7βE in L, BW5147, Hy3A, Hy1B, and Hy2C are 14.8 ± 1.5, 4.4 ± 0.5, 0.7 ± 0.1, 26.6 ± 3.1, 19.3 ± 2.2, 17.4 ± 2.4, 19.5 ± 2.3, 21.5 ± 2.5, 9 ± 1.1, and 12.6 ± 1.5, respectively. For calculation of relative CAT activity, the activity obtained from pBLCAT2 construct in each cell line was arbitrarily assigned a value of 1. The other values observed are relative to that of pBLCAT2 and are the mean values of three to four independent experiments.
FIG. 7
FIG. 7
The TCRα: enhancer represses the TK promoter activity. (A) A schematic representation of pBLCAT2 and pBLCATαE515 plasmids. The pBLCAT2 plasmid contains the TK promoter inserted in front of the CAT transcription unit and the pBLCATαE515 carries the TCRα PvuII-PvuII 515-bp enhancer fragment cloned 5′ to the TK promoter. (B) Parental (BW5147 and L) and hybrid cells (Hy3A, Hy1B, Hy2C) were cotransfected with 15 μg of either pBLCAT2 or pBLCATαE515 together with 2 μg of pCMV-βgal DNA. CAT activities were determined and quantitated as described in the legend to Fig. 6B. The values for percent conversion, presented as means ± SDs, corresponding to pBLCAT2 and pBLCATαE515 in L, BW5147, Hy3A, Hy1B, and Hy2C are 4.08 ± 0.5, 1.22 ± 0.1, 0.91 ± 0.14, 34.3 ± 7.85, 1.75 ± 0.09, 1.06 ± 0.05, 3.16 ± 0.85, 1.7 ± 0.2, 2.61 ± 0.25, and 0.98 ± 0.13, respectively. For calculation of relative CAT activity, the activity obtained from pBLCAT2 construct in each cell line was arbitrarily assigned a value of 1. The other values observed are relative to that of pBLCAT and are the mean values of 10 independent experiments.
FIG. 8
FIG. 8
T × L-cell hybrids express Ets-1 and low levels of GATA-3, LEF-1/TCF-1α, and TCF-1 mRNAs. (A) RNA (15 μg/lane) isolated from BW5147 (lane 1), L cells (lane 2), Hy3A (lane 3), and Hy1B (lane 4) cell lines were electrophoresed on 1% agarose-formaldehyde gel, transferred to Nitran filter, and hybridized sequentially with GATA-3, LEF-1, TCF-1, and β-actin radioactive probes. (B) RNA (15 μg/lane) isolated from parental BW5147 (lane 1), L cells (lane 2), Hy3A (lane 3), and Hy1B (lane 4) cell lines were electrophoresed, blotted, and hybridized with a labeled ets-1 probe.
FIG, 9
FIG, 9
The T × L-cell hybrids harbor the previously identified TCRα silencer activity. (A) A schematic representation of pJ21 (1), pJ21MoEnCα (2), and pJ21MoEnSilC (3) plasmids, kindly obtained from A. Winoto. The pJ21 (1) contains the c-fos promoter inserted in front of the CAT transcription unit; the pJ21MoEnCα (2) contains the Moloney enhancer and a fragment of the Cα exon (0.5 kb), the pJ21MoEnSilC encompasses silI (0.4 kb) and SilII (0.33 kb), both cloned 3′ to the Moloney enhancer fragment. (B) Hybrid cells were cotransfected with 15 μg of pJ21, pJ21MoEnCα, and pJ21MoEnSilC together with 2 μg of pCMV-βgal DNA. CAT and β-galactosidase activities were assayed as described in the legend to Fig. 6B. The values for percent conversion, presented as means ± SDs, corresponding to pJ21, pJ21MoEnCα, and pJ21MoEnSilC in Hy3A, Hy1B, and Hy2C are 1.5 ± 0.3, 43.5 ± 5.1, 30.45 ± 2.9, 1.4 ± 0.2, 31 ± 5.1, 8.26 ± 0.9, 0.8 ± 0.1, 14.5 ± 1.2, and 2.36 ± 0.36, respectively. For calculation of relative CAT activity, the activity obtained from pJ21 in each cell line was arbitrarily assigned a value of 1. The other values observed are relative to that of pJ21 and are the mean values of four independent experiments. Silencer activity was calculated as the ratio between plasmids 2 and 3 CAT activities. (C) The relative level of TCRα mRNA (calculated as the ratio between the level of TCRα mRNA in Hy3A, Hy1B, and Hy2C, and the level of TCRα mRNA in BW5147 cells, normalized to β-actin mRNA, and averaged for four independent experiments) was plotted against the silencer activity calculated as described in (B). The values for the relative TCRα mRNA corresponding to Hy3A, Hy1B, and Hy2C are 4.7%, 1.5%, and 0.8%, respectively.

Similar articles

Cited by

References

    1. Amouyel P.; Gegonne A.; Delacourte A.; Defossez A.; Stehelin D. Expression of ETS proto-oncogenes in astrocytes in human cortex. Brain Res. 447:149–153; 1988. - PubMed
    1. Ben-Shushan E.; Pikarsky E.; Klar A.; Bergman Y. Extinction of Oct-3/4 gene expression in embryonal carcinoma × fibroblast somatic cell hybrids is accompanied by changes in the methylation status, chromatin structure, and transcriptional activity of the Oct-3/4 upstream region. Mol. Cell. Biol. 13:891–901; 1993. - PMC - PubMed
    1. Bergman Y.; Strich B.; Sharir H.; Ber R.; Laskov R. Extinction of Ig genes expression in myeloma × fibroblast somatic cell hybrids is accompanied by repression of the oct-2 gene encoding a B-cell specific transcription factor. EMBO J. 9:849–855; 1990. - PMC - PubMed
    1. Bhat N. K.; Fisher R. J.; Fujiwara S.; Ascione R.; Papas T. S. Temporal and tissue-specific expression of mouse ets genes. Proc. Natl. Acad. Sci. USA 84:3161–3165; 1987. - PMC - PubMed
    1. Bhat N. K.; Komschlies K. L.; Fujiwara S.; Fisher R. J.; Mathieson B. J.; Gregorio T. A.; Young H. A.; Kasik J. W.; Ozato K.; Papas T. S. Expression of ets genes in mouse thymocyte subsets and T cells. J. Immunol. 142:672–678; 1989. - PubMed

Publication types

MeSH terms

LinkOut - more resources