. 1996 Oct;271(4 Pt 2):H1643-55.
doi: 10.1152/ajpheart.1996.271.4.H1643.

Modeling regional myocardial flows from residue functions of an intravascular indicator

Affiliations

Modeling regional myocardial flows from residue functions of an intravascular indicator

K Kroll et al. Am J Physiol. 1996 Oct.

Abstract

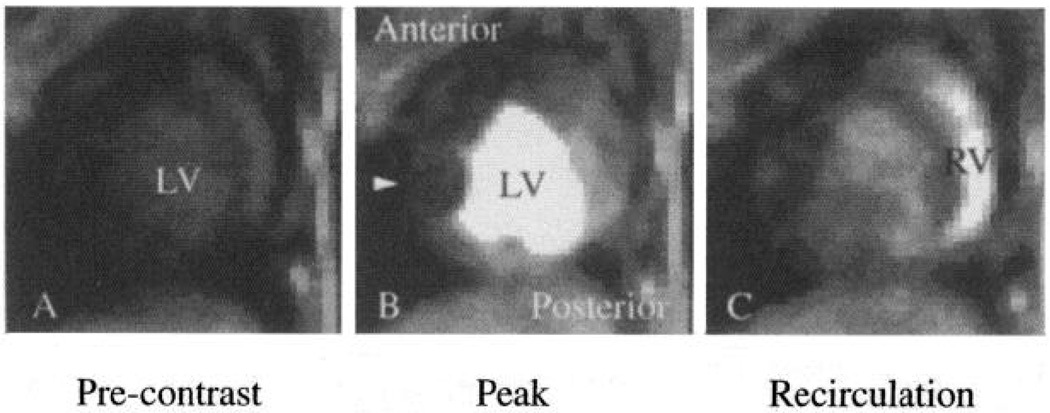
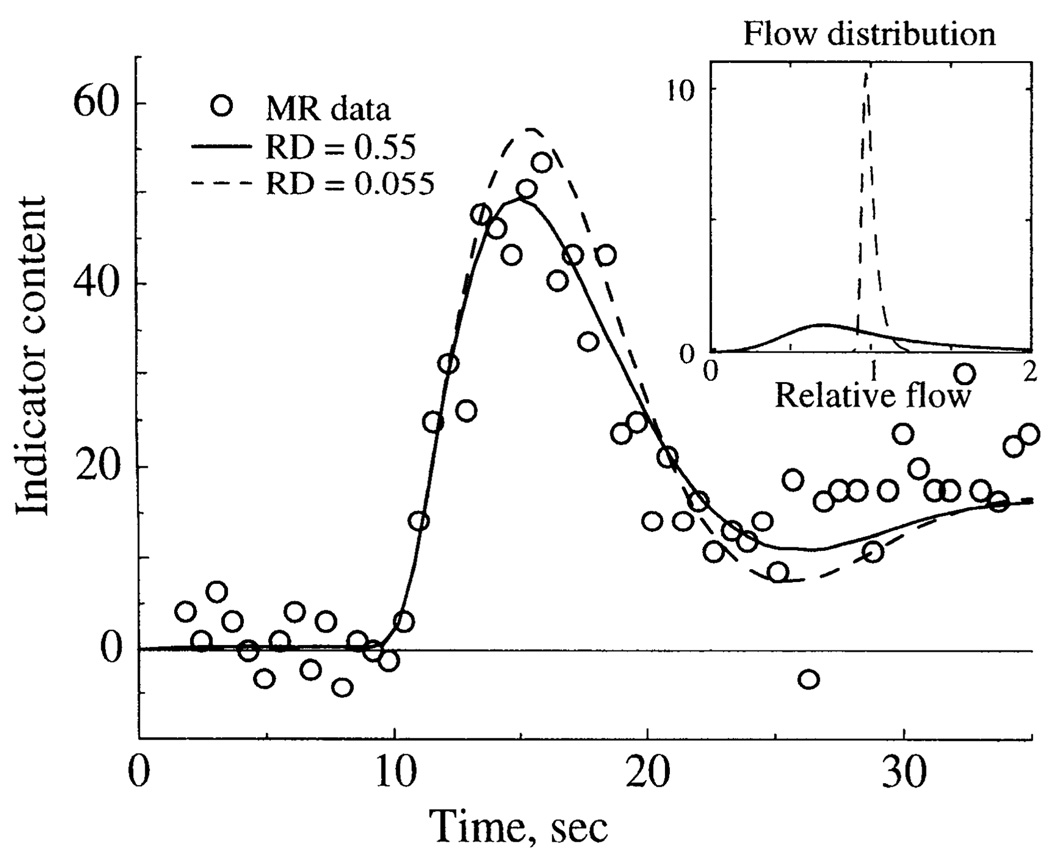
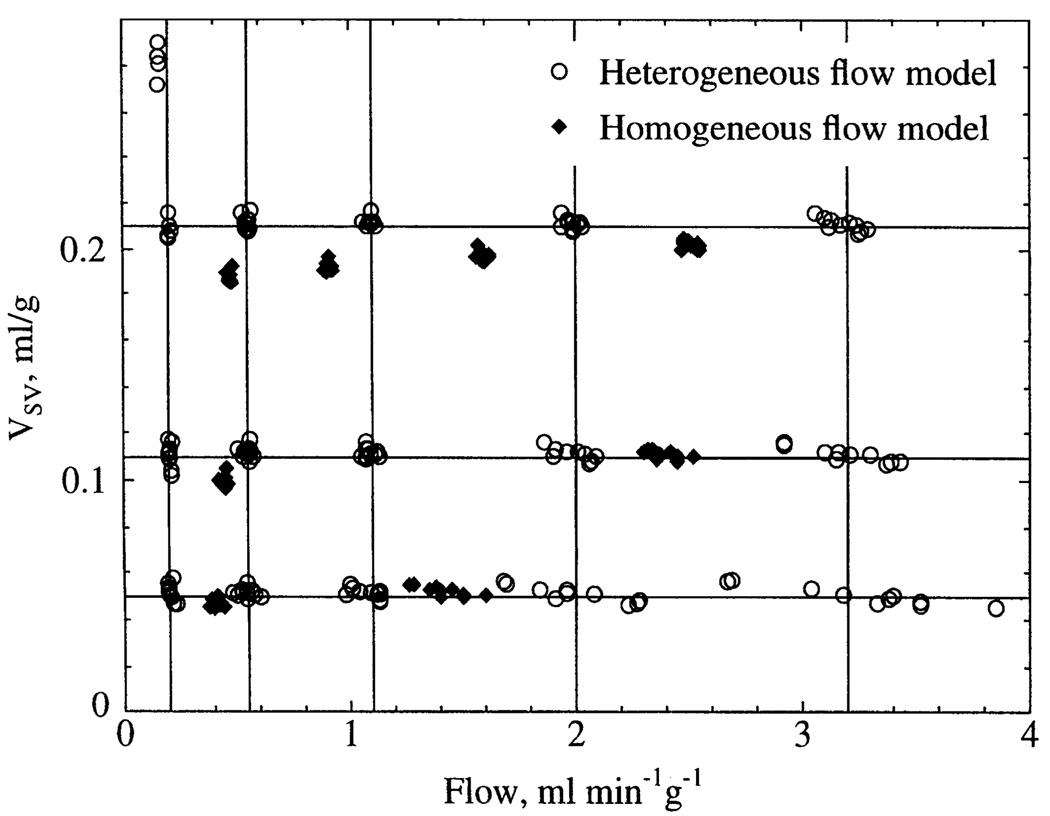
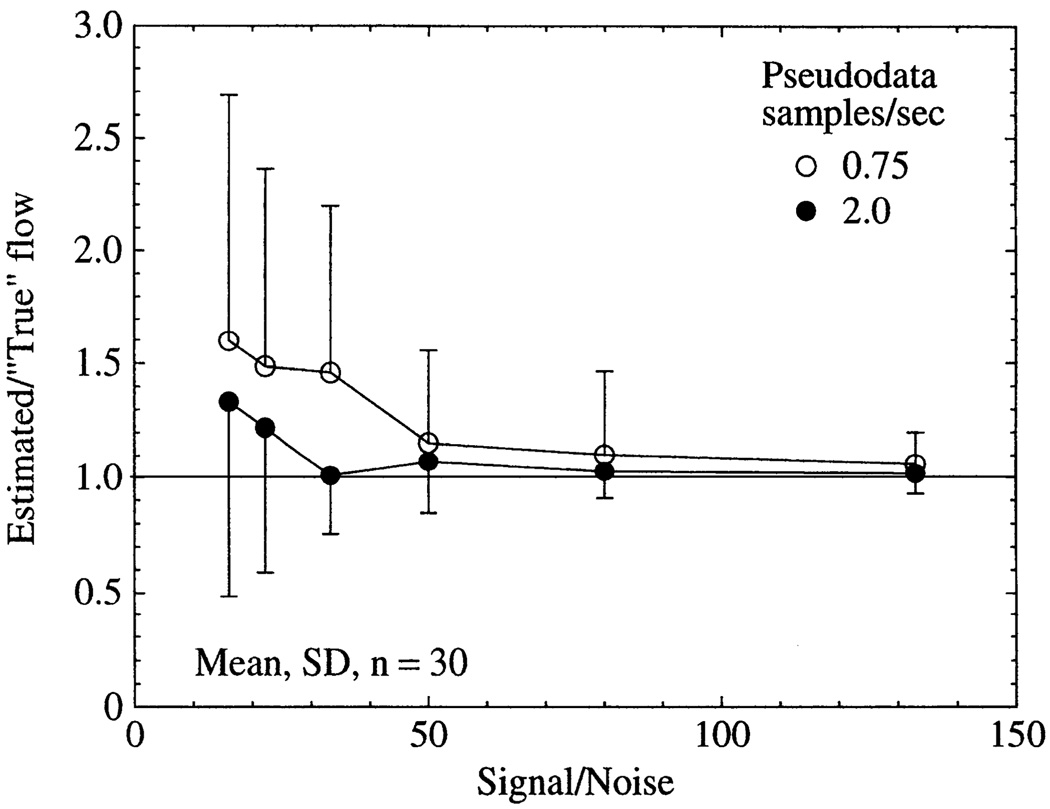
The purpose of the present study was to determine the accuracy and the sources of error in estimating regional myocardial blood flow and vascular volume from experimental residue functions obtained by external imaging of an intravascular indicator. For the analysis, a spatially distributed mathematical model was used that describes transport through a multiple-pathway vascular system. Reliability of the parameter estimates was tested by using sensitivity function analysis and by analyzing "pseudodata": realistic model solutions to which random noise was added. Increased uncertainty in the estimates of flow in the pseudodata was observed when flow was near maximal physiological values, when dispersion of the vascular input was more than twice the dispersion of the microvascular system for an impulse input, and when the sampling frequency was < 2 samples/s. Estimates of regional blood volume were more reliable than estimates of flow. Failure to account for normal flow heterogeneity caused systematic underestimates of flow. To illustrate the method used for estimating regional flow, magnetic resonance imaging was used to obtain myocardial residue functions after left atrial injections of polylysine-Gd-diethylenetriaminepentaacetic acid, an intravascular contrast agent, in anesthetized chronically instrumental dogs. To test the increase in dispersion of the vascular input after central venous injections, magnetic resonance imaging data obtained in human subjects were compared with left ventricular blood pool curves obtained in dogs. It is concluded that if coronary flow is in the normal range, when the vascular input is a short bolus, and the heart is imaged at least once per cardiac cycle, then regional myocardial blood flow and vascular volume may be reliably estimated by analyzing residue functions of an intravascular indicator, providing a noninvasive approach with potential clinical application.


Figures

Fig. 1
Fig. 1
Multiple-pathway model of myocardial tissue region of interest. Cin(t), externally detected vascular input; F, total flow to region of interest; q(t), indicator content of region of interest used to fit experimental indicator content-time curves, as defined excluding a contribution from large vessel content of indicator. N parallel pathways are identical except for flow (fi), representing observed flow heterogeneity. hLV, transfer function of a large conduit vessel between left ventricular blood pool and region of interest; CLV(t), input to all flow pathways; fi, flow in ith pathway; wi, fraction of organ or region of interest having flow fi; hSVi, transfer function of small vessel in ith pathway; hcapi, transfer function for capillary-tissue unit in ith pathway; Cout(t), concentration-time curve in venous outflow.
Fig. 2
Fig. 2
Continuous recording of hemodynamic variables during left atrial injection of polylysine-Gd-diethylenetriaminepentaacetic acid (polylysine-Gd-DTPA) for magnetic resonance (MR) imaging (MRI; 1 image/heartbeat) in dog. LVP, left ventricular pressure; LV dP/dt, 1st derivative of left ventricular pressure; AO, aortic pressure; ICP, intracoronary arterial pressure. Injection of magnetic resonance (MR) contrast agent caused no detectable hemodynamic disturbances.
Fig. 3
Fig. 3
Selected MR images along short axis of a closed-chest dog heart obtained 4 (A), 10 (B), and 17 (C) s after bolus injection of intravascular contrast agent polylysine-Gd-DTPA into left atrium. A subtotal coronary stenosis on left anterior descending coronary artery restricted blood flow into anterior free wall of left ventricle (LV), reducing image intensity in this region (B, arrow) compared with normally perfused posterior regions. Content-time curves from complete imaging sequence are shown in Fig. 4. RV, right ventricle.
Fig. 4
Fig. 4
Content-time curves for left ventricular blood pool and myocardial tissue regions of interest detected by MRI after bolus injection of polylysine-Gd-DTPA into left atrium of a closed-chest dog. Curves include 3 images (A–C) shown in Fig. 3. Anterior wall region was in stenotic left anterior descending coronary artery perfusion territory and shows reduced and delayed indicator kinetics. Posterior wall region was perfused normally and shows more typical kinetics.
Fig. 5
Fig. 5
Effect of changes in flow (ml·min−1·g−1), small vessel volume (VSV, ml/g), and large vessel volume (VLV, ml/g) on model fits (curves) of regional myocardial indicator content-time curve (○) obtained by MRI after bolus injection of polylysine-Gd-DTPA. In A–C, only 1 parameter was altered. Measured left ventricular blood pool curve (not shown) was used as model input. Changes in flow and VSV had distinct effects on waveform of solution, although there were similar features in effects of flow and VLV. If ≥2 parameters have identical effects on model solution, then they cannot be independently estimated.
Fig. 6
Fig. 6
Sensitivity functions of flow (B), VSV (C), and VLV (D) for model residue functions. A: residue curves for 3 myocardial flow rates by use of a lagged normal input without recirculation. Sensitivity functions are shown for corresponding residue curves. Sensitivity functions are percent changes in model solution due to a percent change in a parameter. Nonzero sensitivities (positive or negative) are necessary for parameter optimization.
Fig. 7
Fig. 7
Effect of flow heterogeneity on model fit to MR content-time curve. Inset: distribution of relative flows used to model normal [relative dispersion (RD) = 0.55] and decreased (RD = 0.055) flow heterogeneity. MR data and model solutions are shown with normal and decreased heterogeneity, with other parameters kept constant.
Fig. 8
Fig. 8
Effect of random noise on optimized model fits to “pseudodata”: residue curves generated by model at a frequency of 1.25 samples/s with use of known (“true”) parameter values of flow = 0.8 ml·min−1·g−1, VSV = 0.085 ml/g, and VLV = 0.025 ml/g. Random uniform noise with a mean of zero was added to noise-free pseudodata (●) to obtain noisy pseudodata (○). Optimized model fits to noisy pseudodata obtained using very different parameter starting values (flow = 4 ml·min−1·g−1, VSV = 0.15 ml/g, and VLV = 0.029 ml/g, upper starting solution; flow = 0.1 ml·min−1·g−1, VSV = 0.055 ml/g, and VLV = 0.015 ml/g, lower starting solution) converged to identical final solution (continuous curve) of flow = 0.71 ml·min−1·g−1, VSV = 0.080 ml/g, and VLV = 0.020 ml/g. Final solution differs somewhat from true values because of effects of noise.
Fig. 9
Fig. 9
Estimates of flow and VSV obtained by simultaneously optimizing flow, VSV, and VLV to fit pseudodata containing a realistic level of random noise (similar to that in Fig. 8). Pseudodata were generated using using normal flow heterogeneity and 15 combinations of flow and VSV covering physiological range. True values of flow and VSV are indicated by 15 intersections of lines. True value of VLV was constant at 0.028 ml/g. Ten independent realizations of random uniform noise were added to each set of pseudodata. Each symbol represents optimized parameters obtained from a single model fit. There was negligible systematic error in parameter estimates when model included normal flow heterogeneity; i.e., for all ○, true values are at nearest intersection. However, systematic underestimates of flow and VSV were observed when heterogeneity was not included in model; i.e., for all ◆, true values are at nearest intersection to right.
Fig. 10
Fig. 10
Effect of increased dispersion of input function on parameter estimates for noisy pseudodata. A: narrowest and broadest of 13 lagged normal density functions used as vascular inputs (left ordinate) and their corresponding noise-free residue solutions (right ordinate). Peak of narrowest input is truncated. B: estimates of flow (left ordinate) and VSV (right ordinate) obtained by fitting noisy pseudodata with use of corresponding inputs, dispersion of which is shown on abscissa, relative to dispersion of microvascular system, which was constant. Values are means ± SD of fits of 10 independent realizations of each set of noisy pseudodata. Horizontal lines, true values of flow and volume. Increased input dispersion caused increased variability in parameter estimates, particularly flow, but did not cause any systematic error. RDinput, relative dispersion of vascular input; RDsystem, relative dispersion of microvascular system for impulse input.
Fig. 11
Fig. 11
Effect of sampling frequency of noisy pseudodata on simultaneous estimates of flow (A), VSV (B), and VLV (C). Values are means ± SD of fits of 75 independent realizations of noisy pseudodata. Estimates from 2 sets of pseudodata are shown. For ●, true value (horizontal line) was flow = 2 ml·min−1·g−1. For ◆, flow = 1 ml·min−1·g−1. For both sets, VSV = 0.11 ml/g and VLV = 0.028 ml/g. Estimates of VSV were indistinguishable in both sets of pseudodata (only 1 set is shown). For both flow rates, variability increased markedly with sampling frequencies of <2 samples/s, and flow was systematically overestimated with frequencies below ~1 sample/s.
Fig. 12
Fig. 12
Effect of signal noise and sampling frequency on accuracy of flow estimates for pseudodata. Each set of pseudodata was independently fit 30 times by optimizing flow, VLV, and VSV with use of different realizations of random uniform additive noise having a mean of zero. A value of 1.0 on ordinate is a perfect estimate of flow. Signal-to-noise ratio was defined as peak of vascular input (realistic lagged normal density function without recirculation) divided by standard deviation of baseline noise. True values of pseudodata were flow = 1.0 ml·min−1·g−1, VSV = 0.11 ml/g, and VLV = 0.028 ml/g.

References

    1. Bassingthwaighte JB, Beard DA. Fractal 15O-water washout from the heart. Circ. Res. 1995;77:1212–1221. - PMC - PubMed
    1. Bassingthwaighte JB, Chan IS, Wang CY. Computationally efficient algorithms for capillary convection-permeation-diffusion models for blood-tissue exchange. Ann. Biomed. Eng. 1992;20:687–725. - PubMed
    1. Bassingthwaighte JB, King RB, Roger SA. Fractal nature of regional myocardial blood flow heterogeneity. Circ. Res. 1989;65:578–590. - PMC - PubMed
    1. Bassingthwaighte JB, Liebovitch LS, West BJ. Fractal Physiology. New York: Oxford University Press; 1994.
    1. Bassingthwaighte JB, Malone MA, Moffett TC, King RB, Chan IS, Link JM, Krohn KA. Molecular and particulate depositions for regional myocardial flows in sheep. Circ. Res. 1990;66:1328–1344. - PMC - PubMed

Publication types

LinkOut - more resources