Comparative Study
. 1996 Nov 12;93(23):12811-6.
doi: 10.1073/pnas.93.23.12811.

Detection of HIV-1 RNA by nucleic acid sequence-based amplification combined with fluorescence correlation spectroscopy

Affiliations
Comparative Study

Detection of HIV-1 RNA by nucleic acid sequence-based amplification combined with fluorescence correlation spectroscopy

F Oehlenschläger et al. Proc Natl Acad Sci U S A. .

Abstract

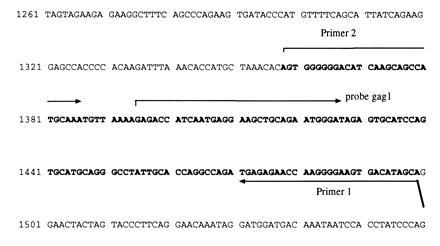
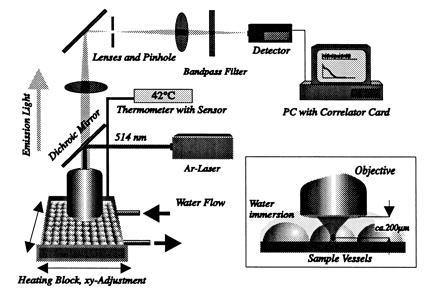
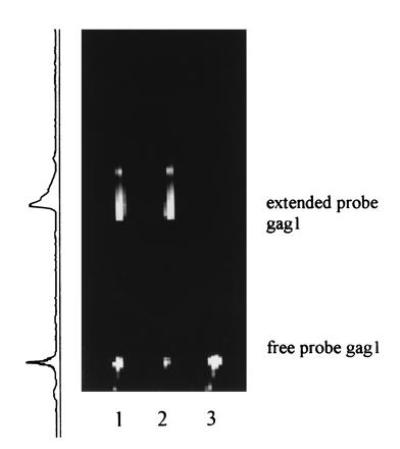
Nucleic acid sequence-based amplification (NASBA) has proved to be an ultrasensitive method for HIV-1 diagnosis in plasma even in the primary HIV infection stage. This technique was combined with fluorescence correlation spectroscopy (FCS) which enables online detection of the HIV-1 RNA molecules amplified by NASBA. A fluorescently labeled DNA probe at nanomolar concentration was introduced into the NASBA reaction mixture and hybridizing to a distinct sequence of the amplified RNA molecule. The specific hybridization and extension of this probe during amplification reaction, resulting in an increase of its diffusion time, was monitored online by FCS. As a consequence, after having reached a critical concentration of 0.1-1 nM (threshold for unaided FCS detection), the number of amplified RNA molecules in the further course of reaction could be determined. Evaluation of the hybridization/extension kinetics allowed an estimation of the initial HIV-1 RNA concentration that was present at the beginning of amplification. The value of initial HIV-1 RNA number enables discrimination between positive and false-positive samples (caused for instance by carryover contamination)-this possibility of discrimination is an essential necessity for all diagnostic methods using amplification systems (PCR as well as NASBA). Quantitation of HIV-1 RNA in plasma by combination of NASBA with FCS may also be useful in assessing the efficacy of anti-HIV agents, especially in the early infection stage when standard ELISA antibody tests often display negative results.


Figures

Figure 1
Figure 1
Amplification cycle of NASBA reaction; a stretch of HIV-1 RNA genome (HXB2) is amplified via a noncyclic and cyclic phase. Introducing fluorescently labeled probe gag1 resulted in a shorter amplification product (108 b RNA) additional to the normal 145 b RNA product.
Figure 2
Figure 2
Part of HIV-1 genome (HXB2, displayed as desoxyribonucleotides); the sequence amplified by NASBA primers 1 and 2 is marked by bold letters. The binding site of probe gag1 within this amplified region and binding sites of primers 1 and 2 are displayed by arrows.
Figure 3
Figure 3
Plastic sheet with 96 reaction vessels and the two parts of the heating block in which the NASBA reactions with online FCS detection were carried out.
Figure 4
Figure 4
FCS detection unit. The plastic sheet was fixed on a heating block at 42°C. Ten samples were subjected to FCS laser beam one after another, which generated the volume element within these vessel (Inset) at a distance of 200 μm from the objective. The heating block was moved by computer, thus ensuring reproducible measurements. Fluorescence intensities of probe gag1 within the volume element were processed online by PC correlator card leading to autocorrealation curves.
Figure 7
Figure 7
Quantitation of probe extension by Applied Biosystems genescan software: Lanes 1 and 2: 8 μl of NASBA mixture after 70-min incubation (20,000 initial HIV-1 RNA molecules); upper band, extended probe gag1; lower band, nonextended probe. Lane 3: 8 μl of negative control after 70 min (nonextended probe gag1). The profile of fluorescence intensity of lane 1 is displayed on the left side; the values of extension were calculated by peak-integration.
Figure 8
Figure 8
Characterization of RNA amplification products by ELGA. Lanes 1 and 2: 3 μl of NASBA negative controls after 70 min (free horseradish peroxidase oligonucleotide probe). Lanes 3 and 4: 3 μl of NASBA reaction after 70-min incubation (2000 initial HIV-1 RNA molecules); two RNA products (108 and 145 bases, see Fig. 1) could be observed.
Figure 5
Figure 5
Shift of autocorrelation curves in course of the NASBA reaction: ——, 10 min; •••, 20 min, ·-·-·-, 35 min; ···, 50 min; and ---, 60 min after starting NASBA. The shift represents an increase of probe gag1 diffusion time caused by hybridization/extension (initial HIV-1 RNA number, 5000 molecules per ml plasma).
Figure 6
Figure 6
Rate of hybridization/extension of probe gag1 versus NASBA incubation time (in percent): □, negative control; ○, false-positive sample; ▪, 1000 initial HIV-1 RNA molecules per milliliter plasma; •, 2000 molecules; ▾, 5000 molecules; ▴, 20,000 molecules. (Inset) Incubation time necessary for defined fraction of detected target as a function of initial concentration, the principle of quantitation standard by FCS.

References

    1. Sarngadharan M G, Popovic M, Bruch L, Schüpbach J, Gallo R C. Science. 1984;224:506–508. - PubMed
    1. Weiss S H, Goedert J J, Sarngadharan M G, Bodner A J, Gallo R C, Blattner W A. J Am Med Assoc. 1985;253:221–225. - PubMed
    1. Ranki A, Valle S L, Krohn M, Antonen J, Allain J P, Leuther M, Franchhini G, Krohn K. Lancet. 1987;ii:589–595. - PubMed
    1. Salahuddin S Z, Markham P D, Redfield R R. Lancet. 1984;ii:1418–1420. - PubMed
    1. Mayer K H, Stoddard A M, McCusker J, Ayotte D, Ferriami R, Groopman J E. Ann Intern Med. 1986;104:194–196. - PubMed

Publication types

MeSH terms