. 1996 Nov 12;93(23):13004-9.
doi: 10.1073/pnas.93.23.13004.

Activation of mouse sperm T-type Ca2+ channels by adhesion to the egg zona pellucida

Affiliations

Activation of mouse sperm T-type Ca2+ channels by adhesion to the egg zona pellucida

C Arnoult et al. Proc Natl Acad Sci U S A. .

Abstract

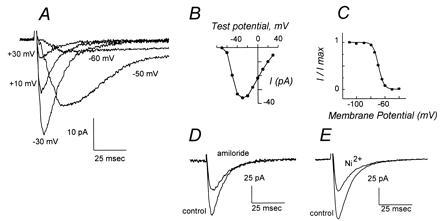
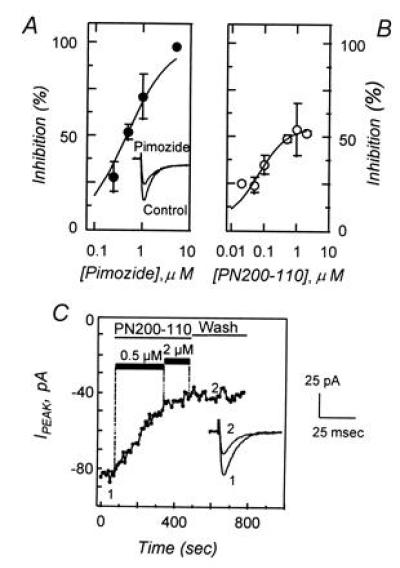
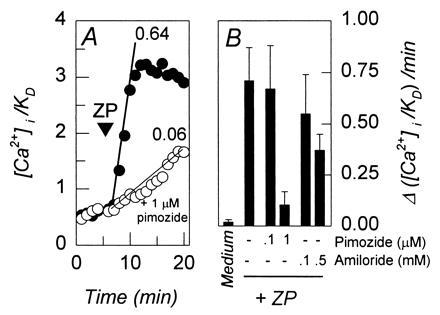
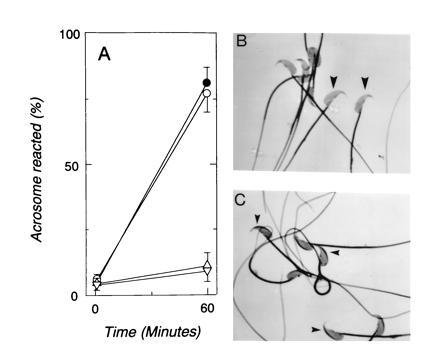
The sperm acrosome reaction is a Ca(2+)-dependent exocytotic event that is triggered by adhesion to the mammalian egg's zona pellucida. Previous studies using ion-selective fluorescent probes suggested a role of voltage-sensitive Ca2+ channels in acrosome reactions. Here, wholecell patch clamp techniques are used to demonstrate the expression of functional T-type Ca2+ channels during mouse spermatogenesis. The germ cell T current is inhibited by antagonists of T-type channels (pimozide and amiloride) as well as by antagonists whose major site of action is the somatic cell L-type Ca2+ channel (1,4-dihydropyridines, arylalkylamines, benzothiazapines), as has also been reported for certain somatic cell T currents. In sperm, inhibition of T channels during gamete interaction inhibits zona pellucida-dependent Ca2+ elevations, as demonstrated by ion-selective fluorescent probes, and also inhibits acrosome reactions. These studies directly link sperm T-type Ca2+ channels to fertilization. In addition, the kinetics of channel inhibition by 1,4-dihydropyridines suggests a mechanism for the reported contraceptive effects of those compounds in human males.


Figures

Figure 1
Figure 1
Ca2+ currents of mouse spermatogenic cells are mediated by low-voltage-activated T channels. (A) Montage of whole-cell Ca2+ current traces after depolarizations of a round spermatid to the indicated membrane potentials from a holding potential of −90 mV. A slowly inactivating component of ICa after depolarization to positive potentials, diagnostic of L currents, is not apparent. (B) Current–voltage relationship for peak current amplitude elicited by depolarizations from a holding potential of −90 mV. (C) Voltage dependence of steady-state inactivation of round spermatid Ca2+ current. (D) Inhibition of peak Ca2+ current amplitude by amiloride. Traces show current elicited by depolarizations from −80 mV to −20 mV in a cell prior to (control) and after addition of 200 μM amiloride. (E) Inhibition of peak Ca2+ current amplitude by Ni2+. Traces show current elicited by depolarizations from -80 mV to -20 mV in a cell prior to (control) and following addition of 50 μM Ni2+. Current scales are indicated and differ between panels A, D, and E.
Figure 2
Figure 2
Low-voltage-activated Ca2+ currents are inhibited by pimozide and by PN200-110. (A) Dose–response relationship showing the effects of pimozide (•) on the peak Ca2+ current density after depolarization to −20 mV from a holding potential of −80 mV. Data represent the mean (±SEM) response of five to eight cells and was fit to the relationship D/Dmax = (V·[C])/(Ki + [C]), where D/Dmax is the proportion of current density remaining after pimozide treatment, [C] is pimozide concentration, V is the maximum inhibition, and Ki is the inhibitory constant. In this data set V and Ki were determined to be 100% and 467 nM, respectively. (Inset) Comparison of control Ca2+ current and currents after treatment with 1 μM pimozide. (B) Dose–response relationship showing the effects of PN200-110 (○) on the peak Ca2+ current density, determined under conditions similar to those in A, with derived values of V = 53% and Ki = 39 nM. Data are obtained from one to six cells. (C) Peak Ca2+ current during repetitive depolarizations to −20 mV from a holding potential of −80 mV. Depolarizations (100 msec) were provided at a frequency of 0.2 Hz. Control currents were recorded, PN200-110 was introduced by perfusion (0.5 and 2 μM; solid bars), and peak currents were recorded for several minutes. Recovery was followed for 5 min after removal of PN200-110. Representative Ca2+ current traces are illustrated before (point 1) and after (point 2) PN200-110 treatment. Scale bars for current traces are shown on the right.
Figure 3
Figure 3
T channel antagonists inhibit the zona pellucida-dependent increase in Cai2+. [Ca2+]i/Kd values were determined from fluorescent emission of intracellular fura 2. (A) The effects of zona pellucida glycoproteins on [Ca2+]i/Kd in representative sperm that were incubated in control medium (•) or in medium containing 1 μM pimozide (10-min preincubation; ○). Solubilized zona pellucida glycoproteins were added (ZP, ▾; 50 μg/ml) and rates were determined by regression analysis of the linear portions of the response time courses. Slopes of regression lines are indicated. (B) Rates of [Ca2+]i/Kd responses obtained from experiments similar to that shown in A. Capacitated sperm were incubated for 10 min with indicated concentrations of pimozide or amiloride and then treated with solubilized zona pellucida glycoproteins (50 μg/ml). Control populations were treated with culture medium throughout. Data were obtained from four to six separate experiments, with 7–22 sperm observed per experiment. Average response rates were determined for each experiment and used to determine the indicated mean values (±SEM).
Figure 4
Figure 4
Effects of T channel antagonists on sperm acrosome reactions. (A) Occurrence (%) of acrosome reactions following sperm adhesion to zonae pellucidae for 1 and 60 min in control medium (•) or in medium supplemented with d-glucose (1 mM; ○), amiloride (500 μM; ▵), or pimozide (0.5 μM; ▿). Data repesent the mean (±SEM) of four experiments using 72–135 zonae pellucidae for each experimental condition and with 29–34 sperm bound per zona pellucida in all treatments. (B) Sperm bound to zona pellucida in control medium for 60 min. (×1000; zona pellucida staining subtracted.) Most sperm are acrosome reacted and do not exhibit dark staining in the apical head (large arrowheads). (C) Sperm bound to zona pellucida for 60 min in the presence of 0.5 μM pimozide. Most sperm fail to acrosome react, as indicated by a stained region in the apical head (small arrowheads).

References

    1. Yanagimachi R. In: The Physiology of Reproduction. Knobil E, Neill J D, editors. New York: Raven; 1994. pp. 189–317.
    1. Babcock D F, Pfeiffer D R. J Biol Chem. 1987;262:15041–15047. - PubMed
    1. Florman H M, Corron M E, Kim T D-H, Babcock D F. Dev Biol. 1992;152:304–314. - PubMed
    1. Arnoult C, Zeng Y, Florman H M. J Cell Biol. 1996;134:637–645. - PMC - PubMed
    1. Florman H M. Dev Biol. 1994;165:152–164. - PubMed

Publication types

MeSH terms

LinkOut - more resources