. 1996 Nov 12;93(23):13158-63.
doi: 10.1073/pnas.93.23.13158.

Temporal mapping of gene expression levels during the differentiation of individual primary hematopoietic cells

Affiliations

Temporal mapping of gene expression levels during the differentiation of individual primary hematopoietic cells

T Cheng et al. Proc Natl Acad Sci U S A. .

Abstract

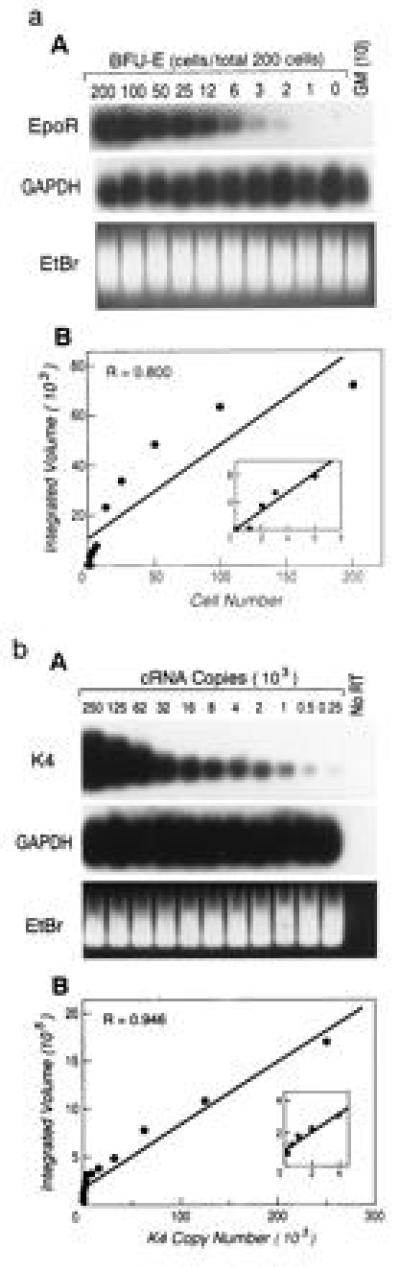
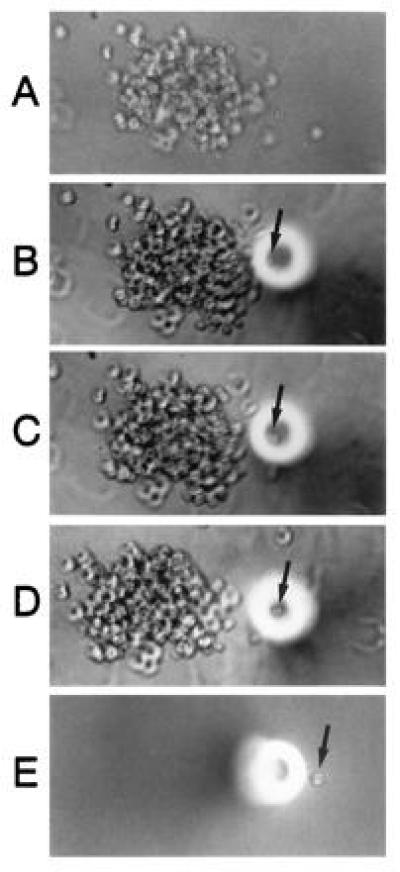
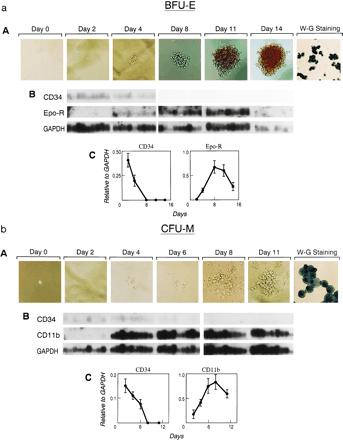
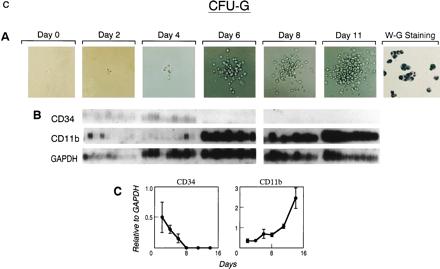
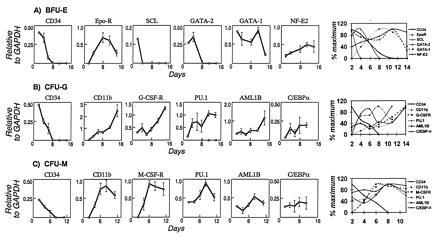
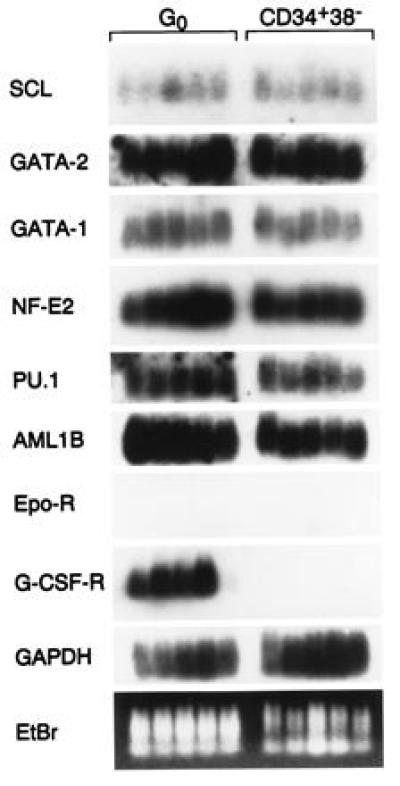
A hierarchical order of gene expression has been proposed to control developmental events in hematopoiesis, but direct demonstration of the temporal relationships between regulatory gene expression and differentiation has been difficult to achieve. We modified a single-cell PCR method to detect 2-fold changes in mRNA copies per cell (dynamic range, 250-250,000 copies/cell) and used it to sequentially quantitate gene expression levels as single primitive (CD34+,CD38-) progenitor cells underwent differentiation to become erythrocytes, granulocytes, or monocyte/macrophages. Markers of differentiation such as CD34 or cytokine receptor mRNAs and transcription factors associated with their regulation were assessed. All transcription factors tested were expressed in multipotent progenitors. During lineage-specific differentiation, however, distinct patterns of expression emerged. SCL, GATA-2, and GATA-1 expression sequentially extinguished during erythroid differentiation. PU.1, AML1B, and C/EBP alpha expression profiles and their relationship to cytokine receptor expression in maturing granulocytes could be distinguished from similar profiles in monocytic cells. These data characterize the dynamics of gene expression accompanying blood cell development and define a signature gene expression pattern for specific stages of hematopoietic differentiation.


Figures

Figure 1
Figure 1
(a) Titration of input cell dose confirms the semi-quantitative nature of the modified RT-PCR technique. (A) The indicated number of cells extracted from a maturing BFU-E were diluted into cells extracted from a cell line (NIH 3T3) maintaining a constant total number of cells at 200. RT-PCR was performed as described and the resultant cDNA visualized by ethidium bromide (EtBr) staining prior to Southern transfer and hybridization with radiolabeled probes from the cDNAs from either the housekeeping gene GAPDH or the BFU-E-specific Epo-R gene. PhosphorImager quantitation of the Epo-R signal was plotted (B), and the indicated linear coefficient was determined. (Inset) Lower cell number values from the same line plot. Lanes in which 10 cells from a developing CFU-GM instead of BFU-E were tested by the RT-PCR reaction are designated GM(10). (b) Limiting dilution of known copy numbers of RNA to define the sensitivity and quantitative capacity of the single-cell RT-PCR technique. (A) An in vitro transcribed, mutated HIV-1 gag fragment, K4, was polyadenylylated, quantitated by spectrophotometry, and added in 2-fold dilutions as indicated to lysates from single CMK cells or (in independent experiments) primary quiescent bone marrow mononuclear cells prior to RT-PCR. The cDNA resulting from the RT-PCR technique was visualized following EtBr staining prior to hybridization with radiolabeled probes from the cDNAs from either GAPDH or K4 (a). PhosphorImager quantitation of the K4 signal was plotted (B) and the indicated linear coefficient was determined. (Inset) Lower K4 copy number values from the same line plot. Copy number values below 250/cell yielded a signal that was detectable but no longer linearly related to input. Lanes in which reverse transcriptase was not added to the RT-PCR mixture are designated No RT.
Figure 2
Figure 2
Single cells from an evolving colony can be isolated and analyzed in conjunction with single cell RT-PCR. A colony (A) was approached with a micromanipulation pipette (B), and a target cell gently isolated from the colony (C and D) was aspirated into the pipette and expelled directly into the assay buffer (E). Direct visualization confirmed the singularity of the isolated cell.
Figure 3
Figure 3
Defining the pattern of marker gene expression during the differentiation of a BFU-E (a), CFU-M (b), or CFU-G (c) from a single CD34+,CD38 progenitor cell. Individual cells were flow-cytometrically sorted, cultured under the stated conditions, and sequentially photomicrographed (A) at indicated time points. Single cells harvested from the emerging colony depicted or colonies of identical morphology were analyzed by RT-PCR and Southern blotting after hybridization of independent filters from the same RT-PCR to the indicated cDNA probes (B). Quantitative PhosphorImager analysis of the indicated probes was normalized to GAPDH signals and used to derive mean and standard error values for each time point plotted in the graph (C).
Figure 3
Figure 3
Defining the pattern of marker gene expression during the differentiation of a BFU-E (a), CFU-M (b), or CFU-G (c) from a single CD34+,CD38 progenitor cell. Individual cells were flow-cytometrically sorted, cultured under the stated conditions, and sequentially photomicrographed (A) at indicated time points. Single cells harvested from the emerging colony depicted or colonies of identical morphology were analyzed by RT-PCR and Southern blotting after hybridization of independent filters from the same RT-PCR to the indicated cDNA probes (B). Quantitative PhosphorImager analysis of the indicated probes was normalized to GAPDH signals and used to derive mean and standard error values for each time point plotted in the graph (C).
Figure 4
Figure 4
Quantitative portrayal of the expression of indicated marker and regulatory genes during the differentiation of individual CD34+,CD38 cells into either BFU-E (A), CFU-M (B), or CFU-G (C). Each data point shown represents the mean and standard error for up to nine individual cells isolated from the same emerging colony at the indicated time points. Earlier time points had fewer input cells due to small colony size. Hybridizations for each transcript indicated were performed on Southern blots generated from a single RT-PCR for each cell sample. Independent colonies of identical morphologic type yielded comparable patterns of gene expression. The last graph in each row represents the superimposition of the data normalized to maximal expression level and represented as curves.
Figure 5
Figure 5
Gene expression of transcription factors in individual quiescent multipotent hematopoietic cells (G0) or CD34+,CD38 cells analyzed using the single cell RT-PCR technique. The ethidium bromide (EtBr)-stained cellular cDNA gel was subsequently transferred to a nylon filter, probed with the indicated cDNA probes, and subjected to autoradiography. Panels of five cells of each type were used to avoid individual cell artifacts.

References

    1. Shivdasani R A, Orkin S H. Blood. 1996;87:4025–4039. - PubMed
    1. Kulessa H, Frampton J, Graf T. Genes Dev. 1995;9275:1250–1262. - PubMed
    1. Zhang D E, Hohaus S, Voso M T, Chen H M, Smith L T, Hetherington C J, Tenen D G. Curr Top Microbiol Immunol. 1996;211:137–147. - PubMed
    1. Huang S, Terstappen L W M M. Blood. 1994;83:1515–1526. - PubMed
    1. Begley C G, Aplan P D, Denning S M, Haynes B F, Waldmann T A, Kirsch I R. Proc Natl Acad Sci USA. 1989;86:10128–10132. - PMC - PubMed

Publication types

MeSH terms