. 1996 Nov 12;93(23):13304-9.
doi: 10.1073/pnas.93.23.13304.

Distinct short-term plasticity at two excitatory synapses in the hippocampus

Affiliations

Distinct short-term plasticity at two excitatory synapses in the hippocampus

P A Salin et al. Proc Natl Acad Sci U S A. .

Abstract

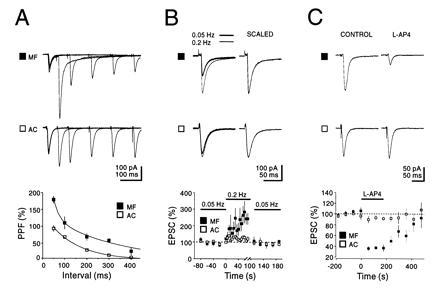
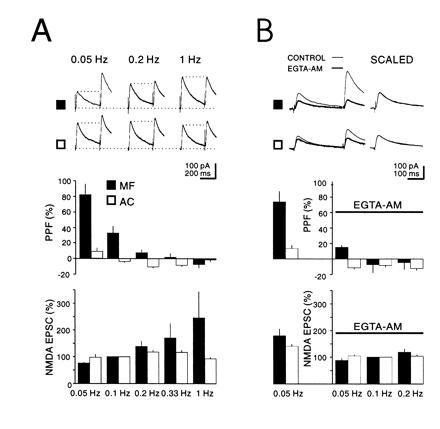
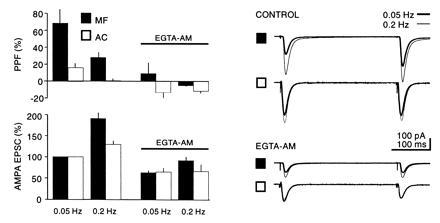
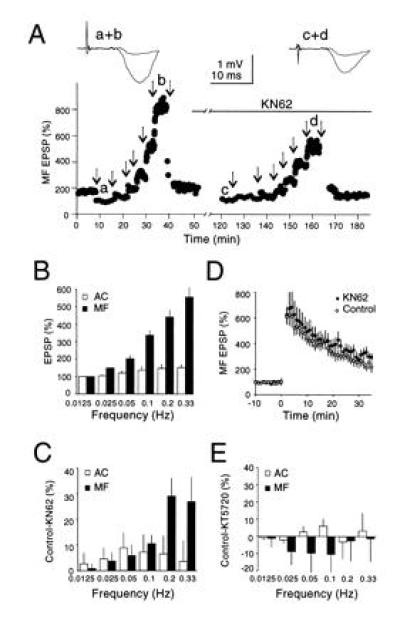
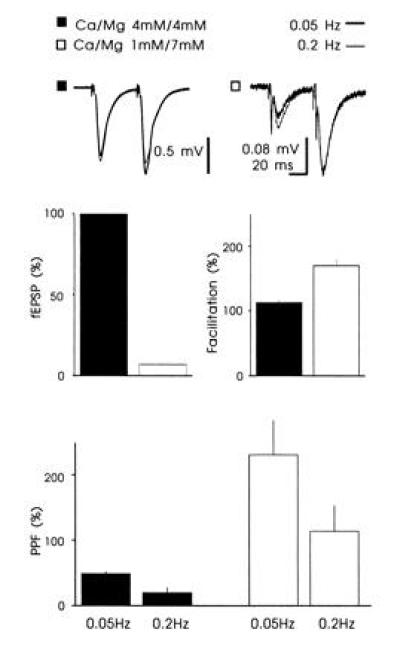
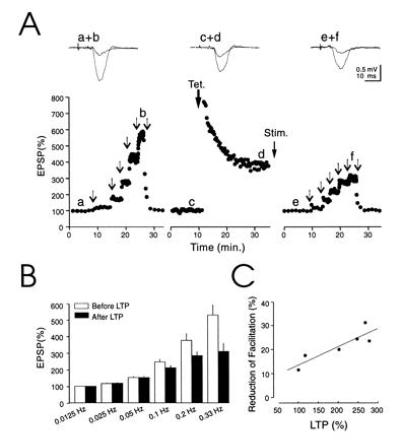
A single mossy fiber input contains several release sites and is located on the proximal portion of the apical dendrite of CA3 neurons. It is, therefore, well suited to exert a strong influence on pyramidal cell excitability. Accordingly, the mossy fiber synapse has been referred to as a detonator or teacher synapse in autoassociative network models of the hippocampus. The very low firing rates of granule cells [Jung, M. W. & McNaughton, B. L. (1993) Hippocampus 3, 165-182], which give rise to the mossy fibers, raise the question of how the mossy fiber synapse temporally integrates synaptic activity. We have therefore addressed the frequency dependence of mossy fiber transmission and compared it to associational/commissural synapses in the CA3 region of the hippocampus. Paired pulse facilitation had a similar time course, but was 2-fold greater for mossy fiber synapses. Frequency facilitation, during which repetitive stimulation causes a reversible growth in synaptic transmission, was markedly different at the two synapses. At associational/ commissural synapses facilitation occurred only at frequencies greater than once every 10 s and reached a magnitude of about 125% of control. At mossy fiber synapses, facilitation occurred at frequencies as low as once every 40 s and reached a magnitude of 6-fold. Frequency facilitation was dependent on a rise in intraterminal Ca2+ and activation of Ca2+/calmodulin-dependent kinase II, and was greatly reduced at synapses expressing mossy fiber long-term potentiation. These results indicate that the mossy fiber synapse is able to integrate granule cell spiking activity over a broad range of frequencies, and this dynamic range is substantially reduced by long-term potentiation.


Figures

Figure 1
Figure 1
Physiological and pharmacological distinction between AMPA-receptor EPSCs evoked by stimulation of mossy fibers and associational/commissural fibers. (A) The mossy fiber (MF) synapse exhibits a greater paired pulse facilitation (PPF) than the assoc/com (AC) synapse. Current traces: superimposed sweeps with five different interstimulus intervals. Note the long-lasting tail, specific for mossy fiber EPSCs. This component is not due to voltage clamp error and is characterized elsewhere (P. Castillo, personal communication). The graph shows the average PPF plotted against interstimulus intervals (n = 6). The points for the assoc/com synapse were fitted with a single exponential (t = 133 ms), while the points for the mossy fiber synapses were fitted with a double exponential (t1 = 27 ms, t2 = 301 ms). PPF was defined as [(p2p1)/p1] × 100, where p1 and p2 are the amplitude of the EPSCs evoked by the first and second pulse, respectively. (B) Frequency facilitation of mossy fiber responses. Current traces: superimposed averaged EPSCs evoked at two different stimulation frequencies (0.05 and 0.2 Hz). The graph summarizes the results of six experiments. Note the slow build up of facilitation at the mossy fiber synapse as well as the complete reversal upon returning to the control stimulation frequency. (C) Activation of presynaptic group three metabotropic glutamate receptors by l-AP4 (10 μM) selectively depresses mossy fiber transmission. The graph summarizes the results of eight experiments. For each of the three sets of experiments in A–C the current traces shown for mossy fiber and assoc/com were recorded from the same CA3 neurons voltage clamped at −70 mV.
Figure 2
Figure 2
Frequency facilitation of mossy fiber NMDA receptors EPSCs is accompanied by a decrease in PPF and is dependent on intraterminal Ca2+. (A) Current traces: NMDA receptors EPSCs evoked by stimulation of mossy fibers (MF) (▪) and assoc/com inputs (AC) (□). PPF was evoked at a fixed interstimulus interval (300 ms), while the stimulation rate was varied as indicated. The graphs summarize six experiments where stimulation frequency is plotted against PPF (Upper) or p1 (Lower) for both mossy fibers and assoc/com synapses. Note the correlation between the increase in p1 and the decrease in PPF for the mossy fiber synapse. Note also that at 1 Hz PPF is the same for both terminals. (B) Current traces show that EGTA-AM (200 μM) depresses p2 more than p1 thus decreasing PPF. Graphs summarize the results from five experiments. The columns to the left of the ordinate indicate control values for PPF and p1 at a stimulus frequency of 0.05 Hz before EGTA-AM application and on the right of the ordinate after EGTA-AM application for several stimulation frequencies. The averaged values for p1 were normalized to 0.1 Hz. CA3 neurons were voltage clamped at +40 mV.
Figure 3
Figure 3
Comparison of the action of EGTA-AM (200 μM) on PPF and frequency facilitation at two different frequencies on AMPA receptor-mediated EPSCs normalized to 0.1 Hz before EGTA-AM application (n = 4).
Figure 4
Figure 4
Frequency facilitation is attenuated by the CaM kinase II inhibitor KN62. (A) The amplitude of mossy fiber fEPSPs evoked at various stimulation frequencies before and during application of KN62 (3.5 μM). Arrows indicate changes in stimulation frequencies (successively 0.05 Hz, 0.0125 Hz, 0.025 Hz, 0.05 Hz, 0.1 Hz, 0.2 Hz, and 0.33 Hz). Note the reduction in facilitation after KN62 incubation. (B) Summary graph of frequency facilitation evoked at various stimulation frequencies for mossy fiber and assoc/com fEPSPs normalized to 0.0125 Hz (n = 5). Note that varying stimulation frequency, even within the range of very low frequencies, induces significant changes in mossy fiber fEPSPs. (C) Summary graph of the difference in frequency facilitation before and during application of KN62 for mossy fibers and assoc/com fEPSPs (n = 5). A significant reduction in facilitation (P < 0.02, two-tailed paired Student’s t test) was observed for mossy fiber fEPSPs at frequencies higher than 0.1 Hz. KN62 had no significant effect on baseline transmission or the assoc/com responses. (D) KN62 has no effect on mossy fiber LTP (n = 5). LTP was first induced on a control mossy fiber input in the absence of KN62 by four 1-s tetani at 100 Hz with 20-s intervals in the presence of d-2-amino-5-phosphonovaleric acid (50 μM) (○). Sixty minutes after the induction of LTP, KN62 (3.5 μM) was bath applied for at least 1 h, and an identical LTP inducing protocol was applied to a second independent mossy fiber pathway (•). The typical decaying phase of mossy fiber LTP is increased due to the elevated concentration of external Ca2+. (Similar results were obtained in the presence of 2.5 mM external Ca2+; n = 2.) (E) Summary graph showing no significant difference in frequency facilitation before and during application of the PKA inhibitor KT5720 for mossy fibers and assoc/com fEPSPs (n = 5).
Figure 5
Figure 5
The effect of decreasing the Ca2+/Mg2+ ratio on frequency facilitation at Schaffer collateral/com synapses. Decreasing the Ca2+/Mg2+ ratio reduced the slope of the fEPSP by 93 ± 0.6%, increased the PPF to 231 ± 53%, and increased the frequency facilitation by 55 ± 14% (n = 6). Voltage traces: Superimposed fEPSPs collected at two different frequencies. The experiments were performed in the presence of d-2-amino-5-phosphonovaleric acid (50 μM).
Figure 6
Figure 6
Mossy fiber LTP reduces the dynamic range of frequency facilitation. (A) Amplitude of mossy fiber fEPSPs evoked at various stimulation frequencies before and after induction of LTP. Arrows indicate changes in stimulation frequencies (successively 0.0125 Hz, 0.025 Hz, 0.05 Hz, 0.1 Hz, 0.2 Hz, and 0.33 Hz). After LTP the stimulus strength was decreased to avoid possible nonlinearities during frequency facilitation. The voltage traces represent averaged fEPSPs collected at 0.0125 Hz and 0.33 Hz before and after induction of LTP. (B) Summary graph of the range of frequency facilitation before and after induction of LTP normalized to 0.0125 Hz (n = 6). The facilitation is significantly reduced at frequencies of stimulation higher than 0.1 Hz. (P < 0.001, two-tailed paired Student’s t test). (C) Correlation between amplitude of LTP and decrease in facilitation for the six experiments shown in B. The amplitude of the LTP was computed over a time window of 5 min, 30 min after induction. The decrease in facilitation was computed for 0.2 Hz stimulation.

References

    1. Castro-Alamancos M A, Connors B W. Science. 1996;272:274–277. - PubMed
    1. Dempsey E W, Morison R S. Am J Physiol. 1943;138:283–296.
    1. Bliss T V P, Collingridge G L. Nature (London) 1993;361:31–39. - PubMed
    1. Nicoll R A, Malenka R C. Nature (London) 1995;377:115–118. - PubMed
    1. Buonomano D V, Merzenich M M. Science. 1995;267:1028–1030. - PubMed

Publication types

MeSH terms

LinkOut - more resources