. 1996 Dec 1;16(23):7496-504.
doi: 10.1523/JNEUROSCI.16-23-07496.1996.

Direct measurement of AMPA receptor desensitization induced by glutamatergic synaptic transmission

Affiliations

Direct measurement of AMPA receptor desensitization induced by glutamatergic synaptic transmission

T Otis et al. J Neurosci. .

Abstract

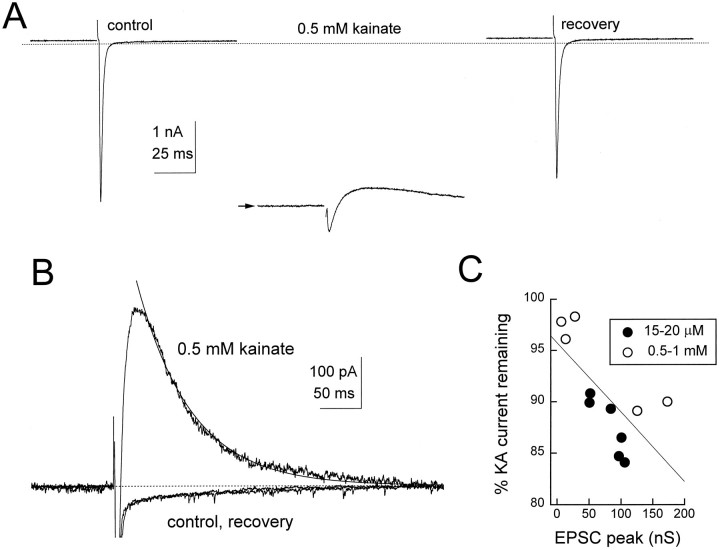
Although almost all ionotropic neurotransmitter receptors undergo desensitization, the onset and recovery of desensitization at a synapse have never been observed directly. We have found changes in postsynaptic AMPA receptor sensitivity in neurons of the chick cochlear nucleus, the nucleus magnocellularis (nMAG), by photolysis of caged glutamate immediately after activation of a single synaptic input. Additionally, synaptic desensitization was demonstrated via competition between synaptically released glutamate and an exogenous nondesensitizing agonist, kainate. Both approaches indicated that at least 35-40% of the receptors were desensitized after a single synaptic stimulus. Miniature synaptic currents were depressed after an evoked synaptic current, indicating that desensitization led to a reduction in the response to individual transmitter quanta. Stimulation of adjacent glutamatergic inputs to the same cell demonstrated that nearby terminals did not depress one another, suggesting that the desensitizing level of glutamate is restricted to each axon terminal. These findings confirm that postsynaptic neurons may use desensitization to regulate the strength of transmission on a synapse-specific basis.


Figures

Fig. 1.
Fig. 1.
Synaptic AMPA receptor desensitization measured by photolysis of caged glutamate. A, A family of eight trials in response to photolysis of 500 μmγ-O-CNB glutamate with shutter openings beginning at the times marked by the inverted triangles. In four of the trials (marked by asterisks), the photolysis currents have been preceded by eEPSCs (arrow; peaks not shown). Note the recovery of depression of the peak photolysis currents as the interval between conditioning eEPSC and shutter opening is lengthened. B, The average inhibition of the peak photolysis current (100 ×ITEST/ICON; ±SEM) versus time after the eEPSC is plotted for 11 neurons, in whichICON is the unconditioned photolysis current. C, Inhibition of the peak photolysis current versus the peak conductance of the conditioning synaptic current at the shortest interval (15 msec), showing that larger synaptic currents result in greater depression of the photolysis current. A linear regression (r = −0.71) has been superimposed.
Fig. 2.
Fig. 2.
Synaptically released glutamate displaces kainate and desensitizes AMPA receptors. A, eEPSCs at a holding potential of −17 mV in control conditions, superimposed on a steady-state kainate current, and after recovery. Each traceis the mean of two to four responses with no leak subtraction.B, The same responses, filtered at 1 kHz and with the steady-state currents subtracted, show a net positive current attributable to a block of the kainate current during the falling phase of the synaptic current. The continuous curve superimposed on the 0.5 mm kainate response is a single exponential with a time constant of 66 msec. C, The relation between the unblocked current and the magnitude of the peak control synaptic conductance in the presence of a low or high kainate concentration. The percentage of kainate current remaining was determined after baseline subtraction, as in B, by subtracting the record in control. The peak positive current then was divided by the steady-state kainate current to yield fractional blocked kainate current. The percentage of remaining current = 100 × (1 − fractional blocked current). The line is a linear regression; r = −0.7. Dotted linesin A and B show the zero current level.
Fig. 5.
Fig. 5.
Synaptic depression is synapse-specific.A, Schematic showing the whole-cell recording pipette and two extracellular stimulating pipettes (S1,S2), each with an isolated ground. R is the recording pipette. B1, B2, Pairs of stimuli delivered to either of the two stimulating pipettes elicit strong depression. B3, B4, By contrast, stimulation with one, followed 10 msec later by the other, extracellular pipette evokes eEPSCs with no depression. C, Conditioning trains of stimuli (4 at 100 Hz) elicit strong homosynaptic depression, but no heterosynaptic depression.
Fig. 3.
Fig. 3.
Quantal size is transiently reduced after a stimulus-evoked EPSC (eEPSC) only under conditions of high-release probability. A, Twelve eEPSCs (peaks truncated) recorded in 2 mm SrCl2/3 mm CaCl2, demonstrating a transient depression in mEPSC size. To the right, five control traces recorded before five stimuli are displayed.B, Mean mEPSC amplitude versus time from the initial rise in the eEPSC for the same cell. Open circles, Mean ± SEM of 20 mEPSCs; filled circle, mean of 140 control EPSCs. The solid line is a single exponential curve with a time constant of 68 msec.
Fig. 4.
Fig. 4.
Quantal depression is absent when transmitter release is reduced. A, No depression of mEPSCs is seen in 2 mm SrCl2/0 mmCaCl2. B, In the same neuron as inA, mEPSCs in 2 mm SrCl2/3 mm CaCl2 show depression. C, Mean mEPSC amplitude ± SEM versus time from initial rise of eEPSC from the same cell shown in A and B.Filled triangles, open circles, Mean of 20 mEPSCs in 0 mm or 3 mm Ca2+solutions, respectively. Filled circle, Mean of 344 control mEPSCs. D, Cumulative probability distributions of mEPSC amplitudes from the same cell demonstrate that mEPSCs within 100 msec of an eEPSC in normal Ca2+ (3 Ca2+, poststimulus) are significantly depressed as compared with events after an eEPSC in 0 Ca2+ (0 Ca2+, poststimulus), or preceding eEPSCs in 0 Ca2+ (0 Ca2+, prestimulus) or 3 Ca2+ (3 Ca2+, prestimulus; Komolgorov–Smirnov test, p < 0.0005). Calibration bar in B applies also to A.

References

    1. Barbour B, Keller BU, Llano I, Marty A. Prolonged presence of glutamate during excitatory synaptic transmission to cerebellar Purkinje cells. Neuron. 1994;12:1331–1343. - PubMed
    1. Callaway EM, Katz LC. Photostimulation using caged glutamate reveals functional circuitry in living brain slices. Proc Natl Acad Sci USA. 1993;90:7661–7665. - PMC - PubMed
    1. Clements J. Transmitter time course in the synaptic cleft: its role in central synaptic function. Trends Neurosci. 1996;19:163–171. - PubMed
    1. Colquhoun D, Jonas P, Sakmann B. Action of brief pulses of glutamate on AMPA/kainate receptors in patches from different neurones of rat hippocampal slices. J Physiol (Lond) 1992;458:261–287. - PMC - PubMed
    1. Diamond JS, Jahr CE. Asynchronous release of synaptic vesicles determines the time course of the AMPA receptor-mediated EPSC. Neuron. 1995;15:1097–1107. - PubMed

Publication types

LinkOut - more resources