. 1996 Dec 1;16(23):7610-8.
doi: 10.1523/JNEUROSCI.16-23-07610.1996.

Metaphase spindles rotate in the neuroepithelium of rat cerebral cortex

Affiliations

Metaphase spindles rotate in the neuroepithelium of rat cerebral cortex

R J Adams. J Neurosci. .

Abstract

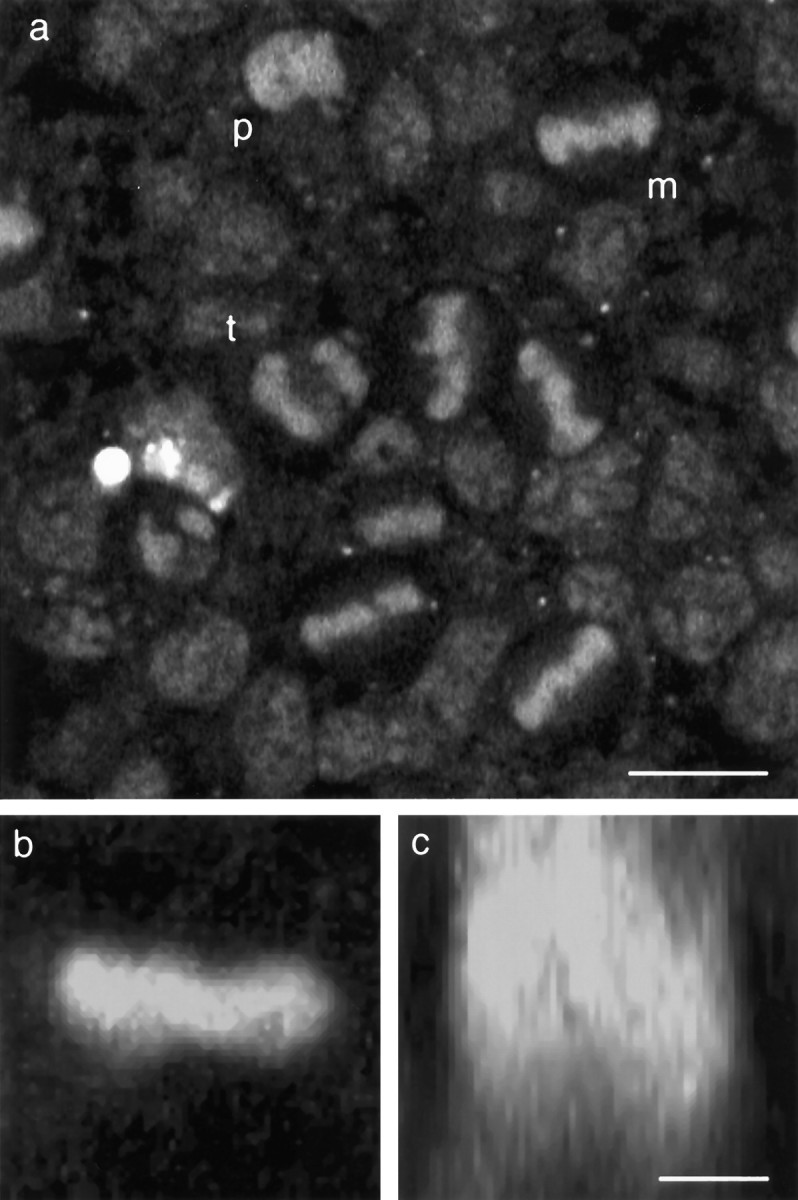
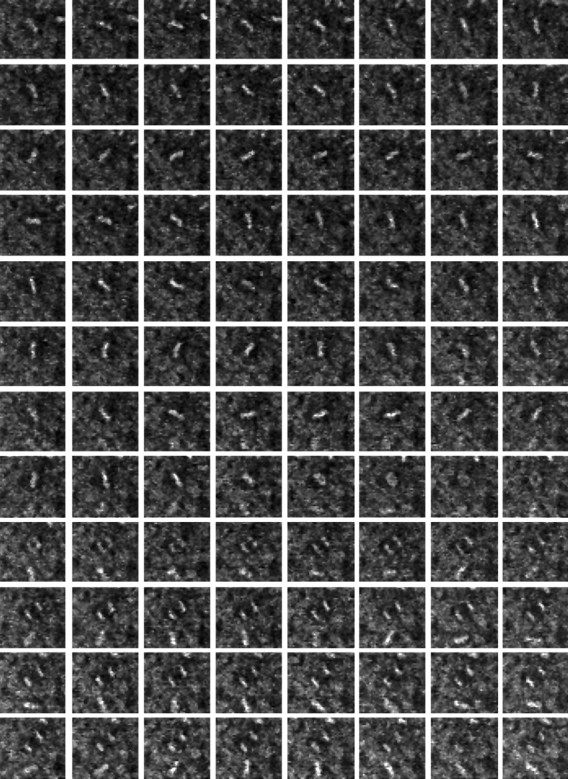
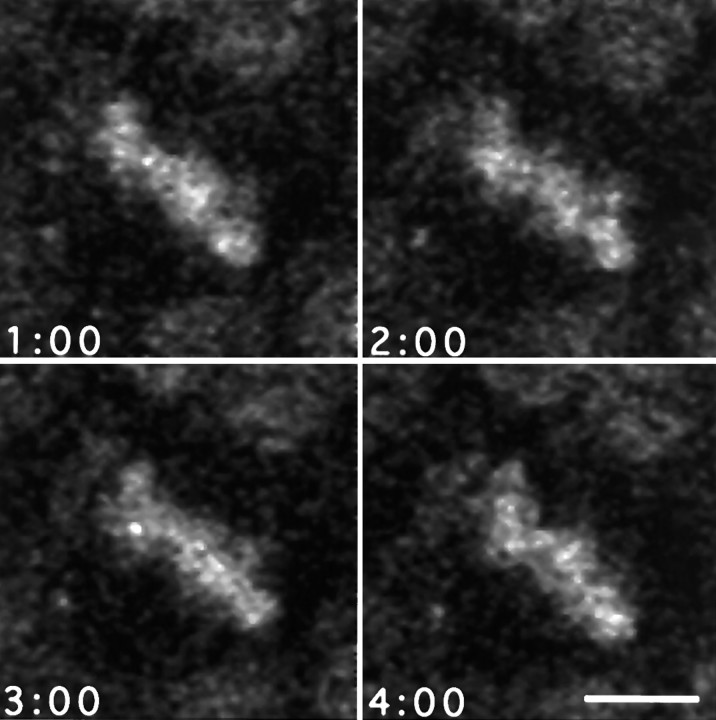
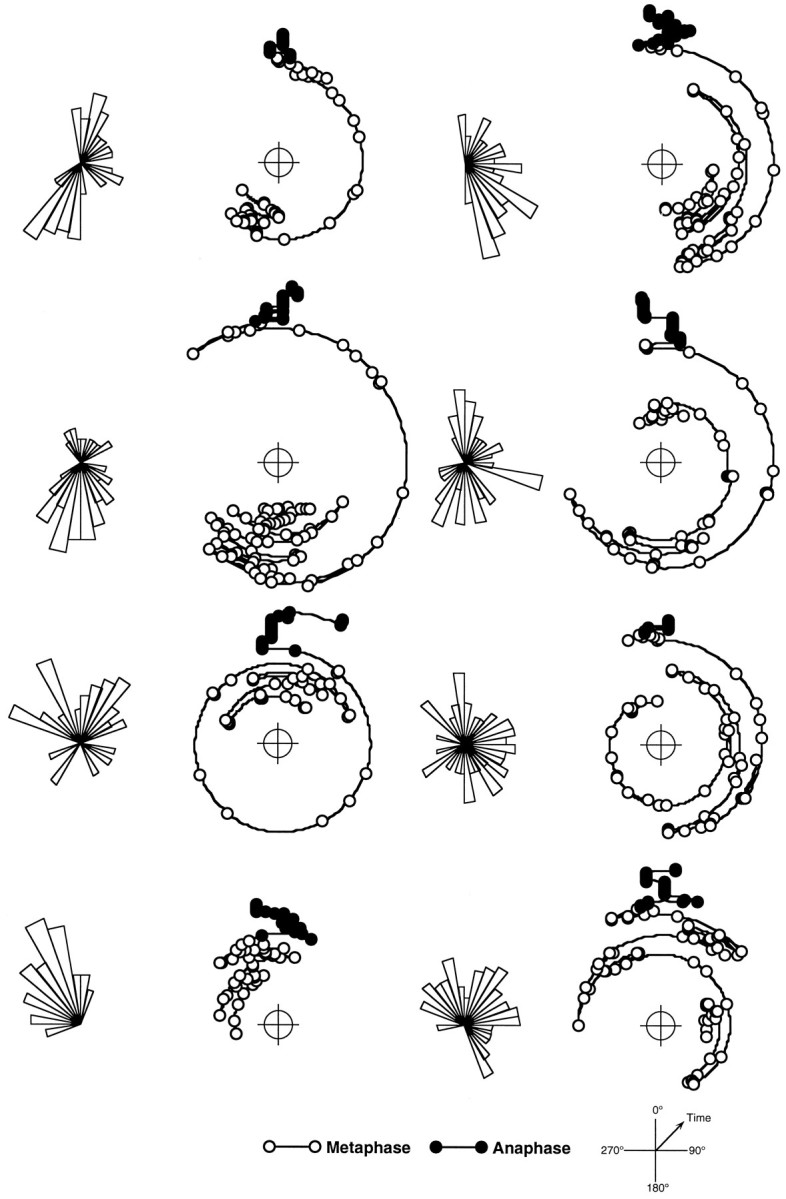
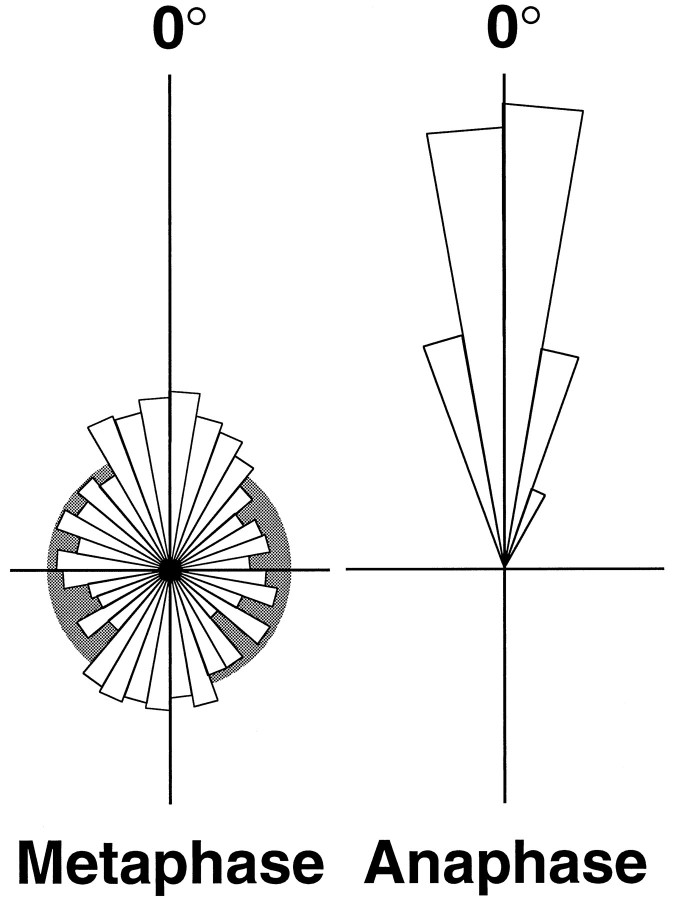
Time-lapse confocal microscopy has been used to image cells in mitosis at the apical surface of neuroepithelium from the rat cerebral cortex during the period of neurogenesis. Staining with vital chromatin dyes reveals that mitotic spindles that are aligned parallel to the surface of the tissue are highly motile, rotating within the plane of the epithelium throughout metaphase, and come to rest only as anaphase begins. Spindles may make several complete turns, parallel to the epithelium, but only rarely tumble into an orientation perpendicular to the epithelial sheet. Analysis shows that spindles do not rotate randomly; rather, they spend most of their time aligned parallel or antiparallel to the direction in which they will later enter anaphase and undergo cell division. This conclusion is strongly supported by statistical analyses of the data. Stereotyped movements of this kind show that the direction of division is determined early in mitosis. This suggests the existence of intracellular and perhaps intercellular signals that define the polarity of the cell both in the apico-basal direction and within the plane of the epithelium. Such mechanisms may be important for maintaining the structure of the epithelium and cell-cell communication during development and may also provide a mechanism for the precise distribution of cytoplasmic determinants that might influence the fate of the daughter cells at a time when neuronal fate is being determined.


Figures

Fig. 1.
Fig. 1.
Confocal microscopy of mitotic cells at the ventricular surface of living neuroepithelium from the rat cerebral cortex. Explants from the lateral wall of the neocortical neuroepithelium of embryonic rat between the ages of E12 and E20 were cultured in vitro. The chromatin dye acridine orange (3.3 μm) was used to visualize mitotic figures at the ventricular surface of the tissue imaged by confocal microscopy.a, Single optical section taken parallel to the surface of a sheet of tissue from an E14 rat embryo. Mitotic nuclei in prophase (p), metaphase (m), and anaphase/telophase (t) can be seen. b,c, Two-dimensional extended-focus images generated from thirty-two 1 μm optical sections through a single metaphase cell dividing parallel to the surface of the epithelium. Projected along the apico–basal axis, the image appears as a bright bar (b) but rotated 90° to project along the axis of the spindle shows this to be a disk of chromatin within the depth of the tissue (c). Scale bars: a, 10 μm;b, c, 5 μm.
Fig. 2.
Fig. 2.
Time-lapse sequence of a single mitotic cell in the neuroepithelium of an E19 rat embryo. Neuroepithelium from an E19 embryo was stained with acridine orange and then imaged at 30 sec intervals for 1 hr by time-lapse confocal microscopy. Frames proceed by rows from left to right starting at thetop left. The metaphase plate of the cell seen in the center of frame 1 is in constant motion until frame 61 (row 8, column 5), 30 min into the sequence, when it enters anaphase. The two sets of daughter chromatids separate over the remainder of the frames with little change in the orientation of the spindle. Each frame is 40 μm wide.
Fig. 3.
Fig. 3.
Chromosomal movements within the metaphase plate during rotation. Four frames from a sequence of high-magnification images taken at 60 sec intervals during metaphase showing the changes in shape of the metaphase plate, consistent with the oscillatory behaviors of individual chromosomes described by others (Rieder et al., 1994). These movements are superimposed on the larger scale rotation of the entire spindle within the dividing cell. Scale bar, 5 μm.
Fig. 4.
Fig. 4.
Paths of spindle rotation during mitosis in the ventricular zone. Time course of orientation of eight representative mitotic spindles measured at 30 sec intervals through metaphase (open symbols) and anaphase through cytokinesis (filled symbols). Cells in movies of the kind shown in Figure 3 were analyzed frame by frame to measure the orientation of mitotic spindle over time. Results are presented as polar plots with increasing radius representing the progression of time and orientation normalized to the mean angle of all anaphase measurements for each cell (0°). To the left of each polar plot is a rose diagram showing the relative frequency distribution of orientations during metaphase. The top four examples show distinct bipolar preferences relative the direction of anaphase. The bottom four show either a unimodal preference or more extensive movements with no clear preference. This selection is representative of the total population measured.
Fig. 5.
Fig. 5.
Frequency distributions of orientations of spindles in anaphase and metaphase relative to the orientation of division. The orientations measured over time for a population of 24 dividing cells were individually normalized to their mean orientation during anaphase. Measurements were separated into two groups corresponding to those after the onset of anaphase and those preceding them, during metaphase. Each data set was binned at 10° intervals and presented as a rose diagram. The area of each sector is proportional to its frequency (radius proportional to the square root of frequency) such that the total areas of the two plots are equal. The distribution of 591 measurements of spindles in anaphase shows very little rotational movement. The distribution of orientations during metaphase (1051 measurements) is much broader, reflecting the extensive motion of the metaphase spindle. There are two major peaks in this distribution, one at 2.7°, parallel to the mean angle after the cessation of rotation, and the other at 179.6°. This shows that the spindles spend significantly more time aligned in this axis within the plane of the tissue than at angles perpendicular to it. The metaphase distribution is superimposed on the distribution (gray) that would be expected for a uniform (random) distribution of orientation.

References

    1. Alvarez IS, Martín-Patido G, Rodríguez-Gallardo L, González-Ramos C, Navasués J. Cell proliferation during early development of the chick otic anlage: quantitative comparison of migratory and nonmigratory regions of the otic epithelium. J Comp Neurol. 1989;290:278–288. - PubMed
    1. Barbe MF. Tempting fate and commitment in the developing forebrain. Neuron. 1996;16:1–16. - PubMed
    1. Bayer SA, Altman J. Neocortical development. Raven; New York: 1991.
    1. Bottenstein JE, Sato GH. Growth of a rat neuroblastoma cell line in serum-free supplemented medium. Proc Natl Acad Sci USA. 1979;83:514–517. - PMC - PubMed
    1. Chenn A, McConnell SK. Cleavage orientation and the asymmetric inheritance of notch1 immunoreactivity in mammalian neurogenesis. Cell. 1995;82:631–641. - PubMed

Publication types

LinkOut - more resources