. 1996 Dec 1;16(23):7733-41.
doi: 10.1523/JNEUROSCI.16-23-07733.1996.

Visual response properties of striate cortical neurons projecting to area MT in macaque monkeys

Affiliations

Visual response properties of striate cortical neurons projecting to area MT in macaque monkeys

J A Movshon et al. J Neurosci. .

Abstract

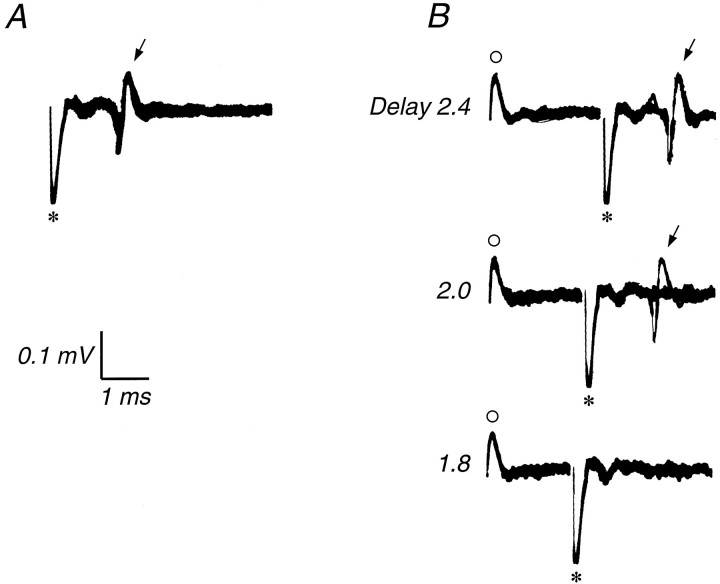
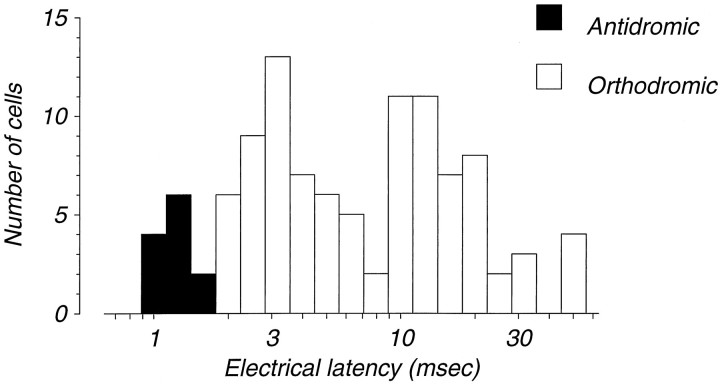
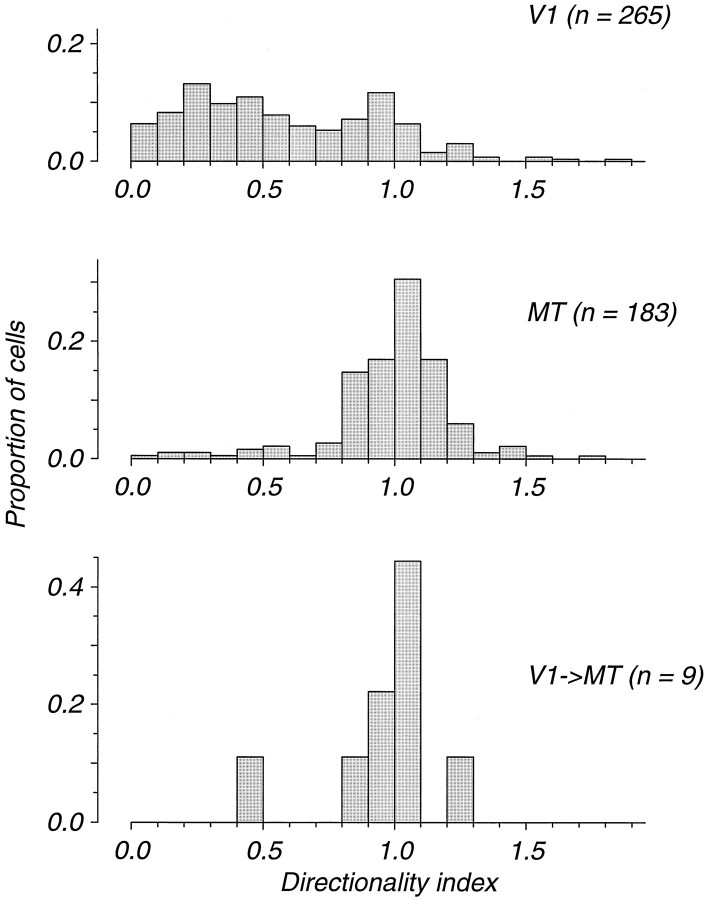
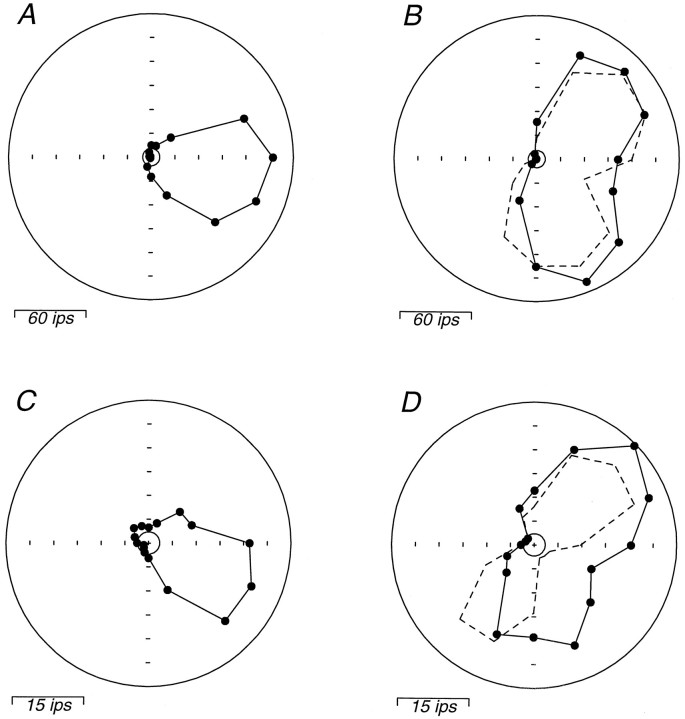
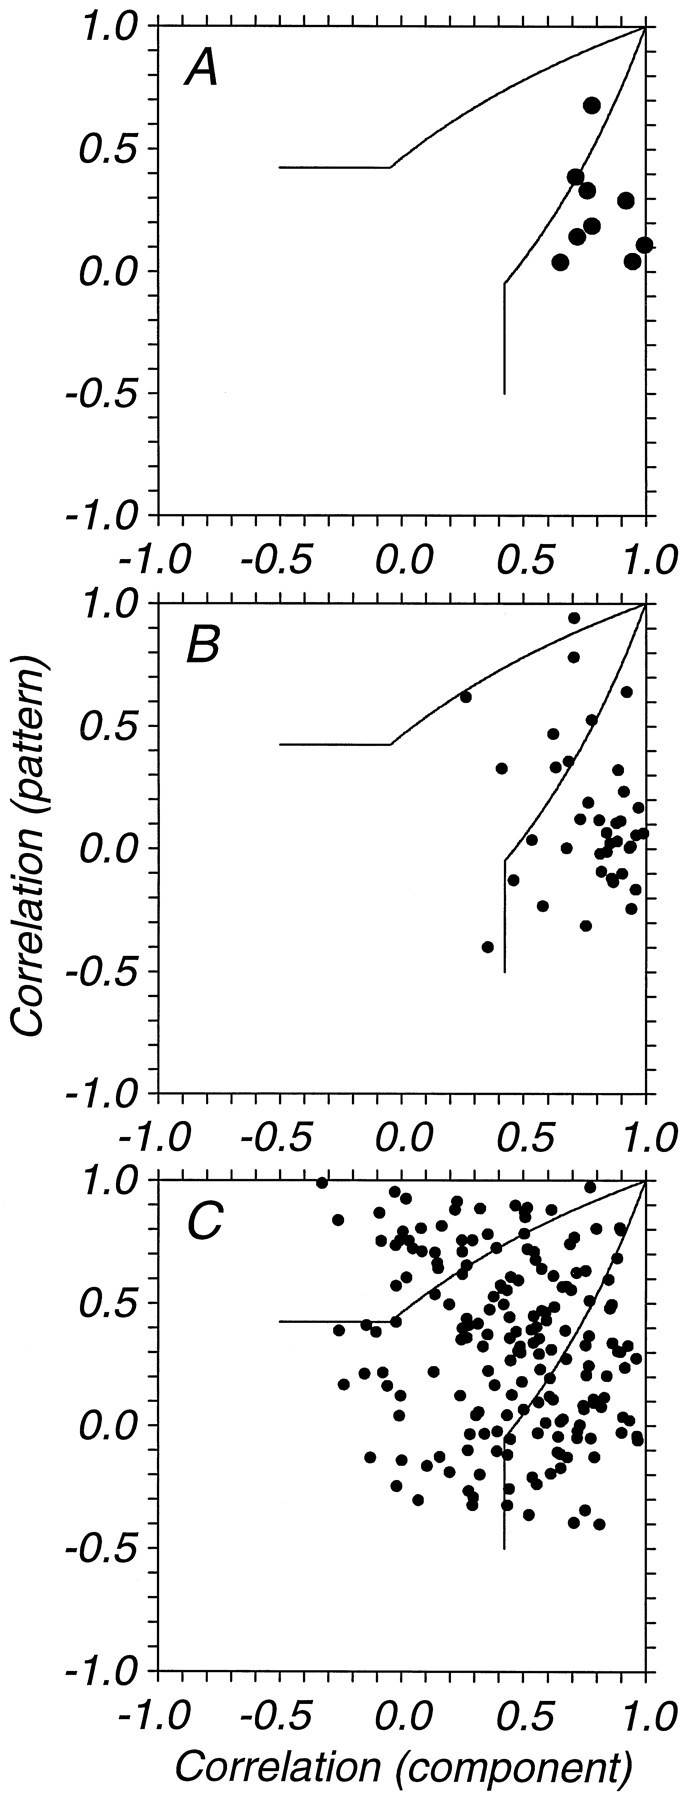
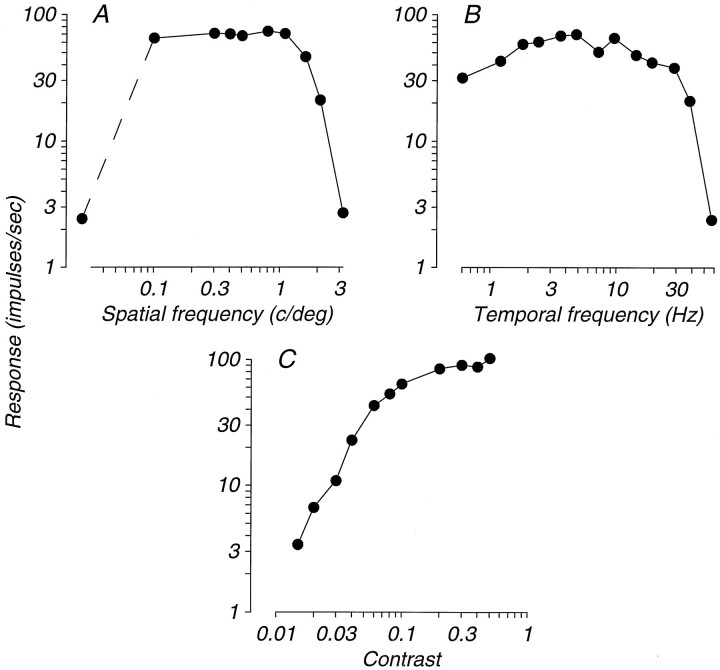
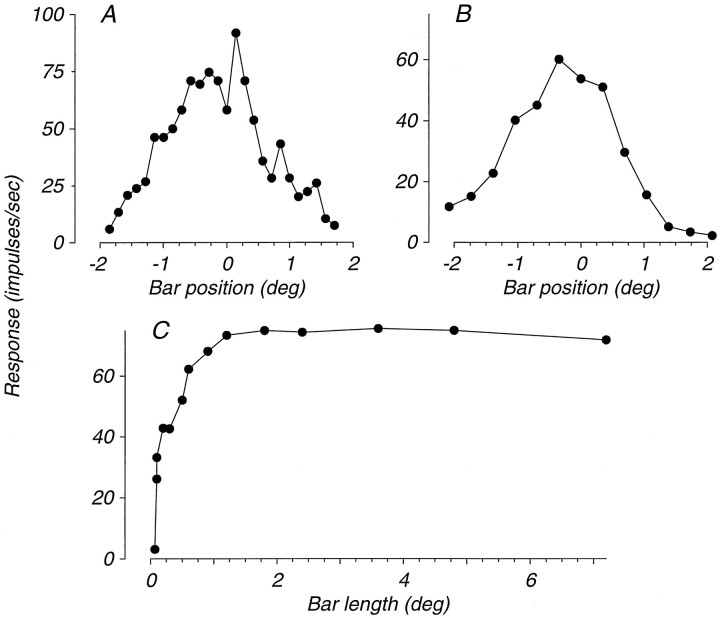
We have previously shown that some neurons in extrastriate area MT are capable of signaling the global motion of complex patterns; neurons randomly sampled from V1, on the other hand, respond only to the motion of individual oriented components. Because only a small fraction of V1 neurons projects to MT, we wished to establish the processing hierarchy more precisely by studying the properties of those neurons projecting to MT, identified by antidromic responses to electrical stimulation of MT. The neurons that project from V1 to MT were directionally selective and, like other V1 neurons, responded only to the motion of the components of complex patterns. The projection neurons were predominantly "special complex," responsive to a broad range of spatial and temporal frequencies, and sensitive to very low stimulus contrasts. The projection neurons thus comprise a homogeneous and highly specialized subset of V1 neurons, consistent with the notion that V1 acts as clearing house of basic visual measurements, distributing information appropriately to higher cortical areas for specialized analysis.


Figures

Fig. 1.
Fig. 1.
Collision test for identifying antidromically activated neurons. A, Ten superimposed traces; each shows an electrical stimulus artifact (*), followed 1.4 msec later by an action potential (arrow). Note the absence of discernible latency jitter in the response. B, Electrical activation of MT was triggered on a spontaneous action potential generated by the V1 neuron. The temporal interval between the spontaneous action potential and electrical stimulus was systematically varied from 2.4 to 1.8 msec. The first deflection in each trace (circle) is the spontaneous action potential, the second (*) is the electrical stimulus artifact, and third (top two traces only, arrow) is the antidromic action potential. Each trace shows the superimposition of five trials. When the interval between the spontaneous action potential and the electrical stimulus was 2.4 msec (top), the electrical stimulus elicited an antidromic action potential that never failed to reach the recording electrode in V1. When the interval was 1.8 msec (bottom), the antidromic action potential never reached V1 because it collided with the spontaneous orthodromic action potential. For an intermediate interval of 2.0 msec, the antidromic action potential reached V1 only once, being blocked by collision on the other four trials.
Fig. 2.
Fig. 2.
Example penetration through V1 (parasagittal section). Solid circles indicate neurons that were orthodromically activated from MT; the star represents the single neuron that was antidromically activated. Tick marks show neurons that were isolated and tested, but were not driven from MT. The inset shows the receptive field location at the MT recording site (stippled) as well as the receptive field centers in the three segments V1 of V1 gray matter: dorsal operculum (1), calcarine sulcus (2), and ventral operculum (3).
Fig. 3.
Fig. 3.
Frequency histogram of activation latencies for all neurons driven by electrical stimulation in MT. Dark bars represent antidromically activated neurons; open bars indicate orthodromically activated neurons.
Fig. 4.
Fig. 4.
Frequency histograms of directionality indices for randomly sampled V1 neurons (top), randomly sampled MT neurons (middle), and V1 neurons antidromically activated from MT (bottom). The directionality index is described in the text.
Fig. 5.
Fig. 5.
Direction tuning of two component direction-selective MT projection neurons to drifting sine wave gratings (A, C) and drifting plaids (B, D). Each polar plot shows the responses of the neuron to 16 directions of motion separated by equal intervals of 22.5°. The plaid stimuli were created by superimposing two sine wave gratings of equal contrast and spatial and temporal frequency, whose orientations differed by 135°. The direction of plaid motion is the direction of coherent motion perceived by human observers, which for these particular patterns lay equidistant between the directions of motion of the two component gratings. Thesolid lines and data in B andD illustrate the actual responses of the neuron; thedashed lines depict the predicted tuning curve if the neuron responded only to the motions of the two component gratings. Thesmall circles at the center of each plot show the spontaneous firing rates.
Fig. 6.
Fig. 6.
Partial correlation of plaid tuning curves with the predictions for component (abscissa) and pattern (ordinate) direction selectivity. The observed tuning curves were correlated with predictions derived either from the hypothesis that the plaid tuning curve was simply the sum of the independent responses of the neuron to the two components of the plaid (“component” prediction, dashed lines inB, D) or from the hypothesis that the plaid tuning curve was the same as the tuning curve for a single grating (“pattern” prediction, solid lines inA, C). To remove the influence of correlations between the predictions themselves, we calculated partial correlations Rp andRc (for the pattern and component predictions) using the standard formulas: Rp=(rprcrpc)(1rp2)(1rc2)and Rc=(rcrprpc)(1rp2)(1rc2),where rc and rpare the simple correlations between the data and the component and pattern predictions, respectively, and rpc is the simple correlation between the predictions. Note that these formulas were given incorrectly in earlier reports (Movshon et al., 1985; Gizzi et al., 1990). A, Scatterplot of the partial correlations for nine antidromically activated V1 neurons.B, Scatterplot for 38 randomly sampled V1 neurons.C, Scatterplot for 182 randomly sampled MT neurons. The different regions of each plot separated by the curved lines are described in the text.
Fig. 7.
Fig. 7.
Responses of an antidromically driven neuron from layer 6 to sinusoidal gratings. All stimuli drifted in the preferred direction. A, Spatial tuning curve, measured at a drift rate of 4.8 Hz. B, Temporal tuning curve, measured with a spatial frequency of 0.9 c/deg. C, Contrast–response function, measured with gratings of 0.9 c/deg drifting at 4.8 Hz. All responses are mean firing rates with baseline firing rate subtracted.
Fig. 8.
Fig. 8.
Responses to flashed and moving bars of the same antidromically activated neuron whose spatio-temporal properties were illustrated in Figure 7. A, Receptive field width profile. Neuronal response (firing rate in 80 msec of discharge containing the highest firing rate) to thin bars (0.13 deg) whose contrast was square-wave-modulated in time at 1 Hz. The neuron responded everywhere to both the dark–light and the light–dark transitions in this stimulus; the responses to light–dark transitions were consistently larger and are plotted here. B, Receptive field length measurement. Neuronal response (firing rate in the 80 msec of discharge containing the highest firing rate) is plotted for 13 positions of a bar 0.4° in length. This was the shortest bar that elicited a robust response as demonstrated by the length summation curve in C. The bar was drifted in the neuron’s preferred direction at each location. The receptive field was ∼3° wide. C, Length summation curve. Neuronal response (measured as for B) is plotted as a function of the length of an optimally oriented bar centered on the receptive field and drifted in the preferred direction. The response saturated for lengths greater than 1 deg, substantially less than the full 3 deg extent of the receptive field.

References

    1. Adelson EH, Bergen JR. Spatio-temporal energy models for the perception of motion. J Opt Soc Am [A] 1985;2:284–299. - PubMed
    1. Adelson EH, Movshon JA. Phenomenal coherence of moving visual patterns. Nature. 1982;300:523–525. - PubMed
    1. Allman JM, Kaas JH. A representation of the visual field in the caudal third of the middle temporal gyrus of the owl monkey (Aotus trivirgatus). Brain Res. 1971;31:85–105. - PubMed
    1. Bender DB. Receptive-field properties of neurons in the macaque inferior pulvinar. J Neurophysiol. 1982;48:1–17. - PubMed
    1. Bishop PO, Burke W, Davis R. Single-unit recording from antidromically activated optic radiation neurones. J Physiol (Lond) 1962;162:432–450. - PMC - PubMed

Publication types

LinkOut - more resources