Comparative Study
. 1996 Nov 15;16(22):7353-65.
doi: 10.1523/JNEUROSCI.16-22-07353.1996.

Different balance of excitation and inhibition in forward and feedback circuits of rat visual cortex

Affiliations
Comparative Study

Different balance of excitation and inhibition in forward and feedback circuits of rat visual cortex

Z Shao et al. J Neurosci. .

Abstract

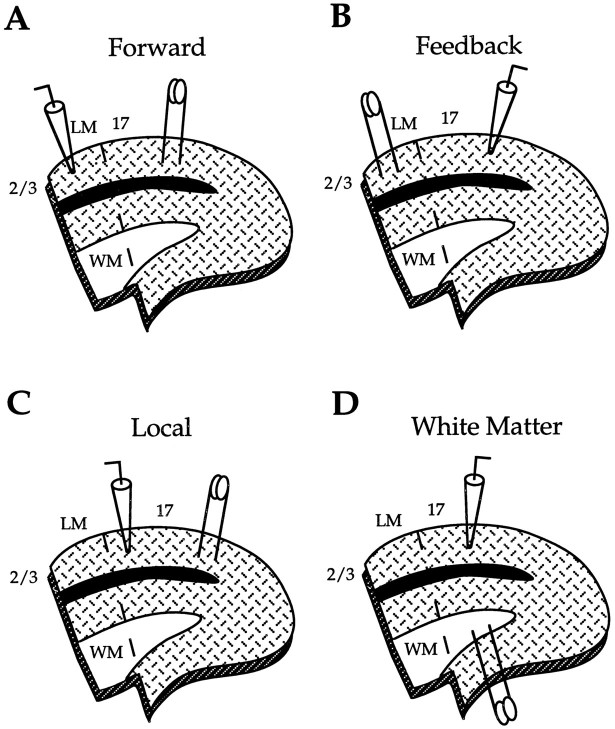
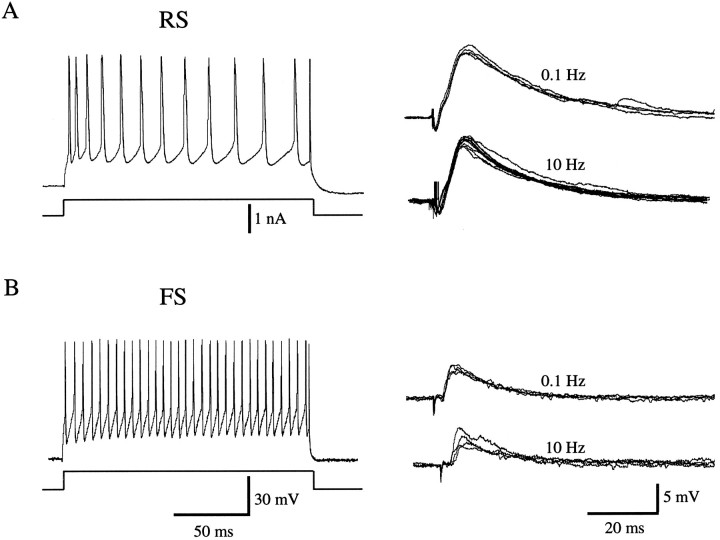
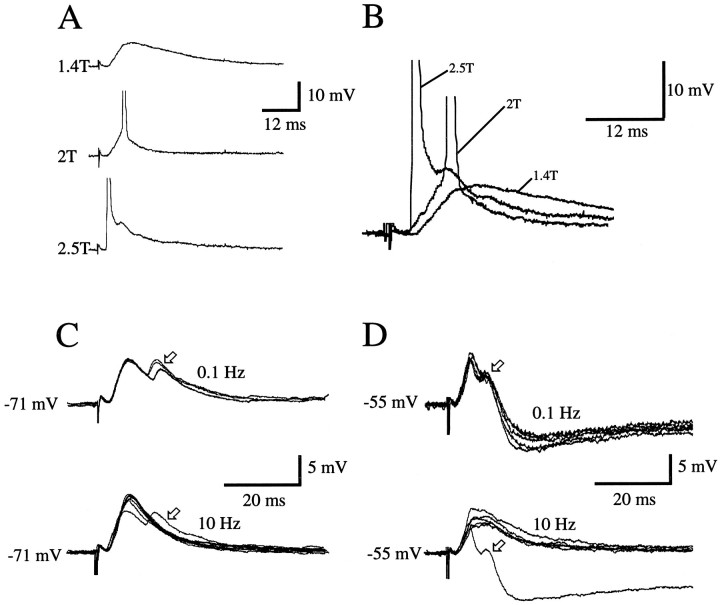
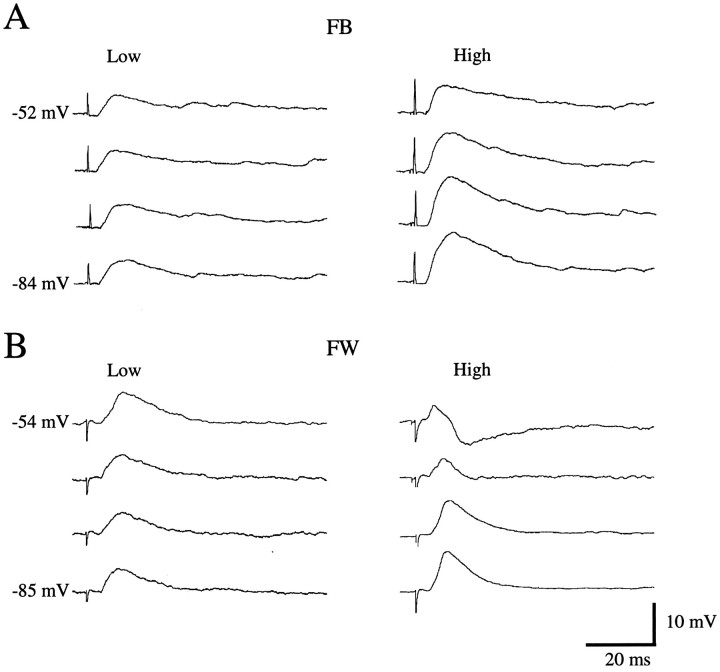
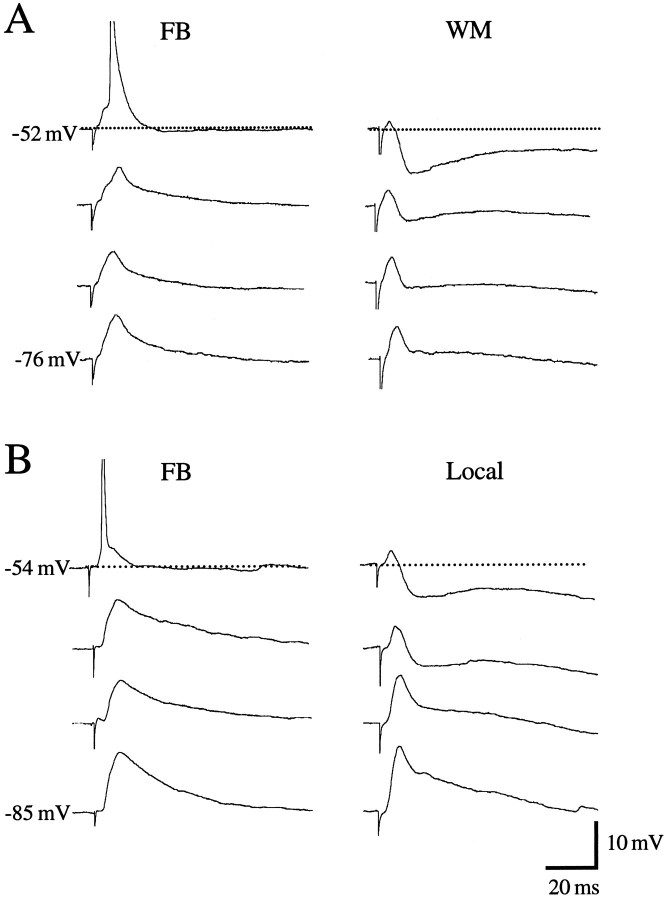
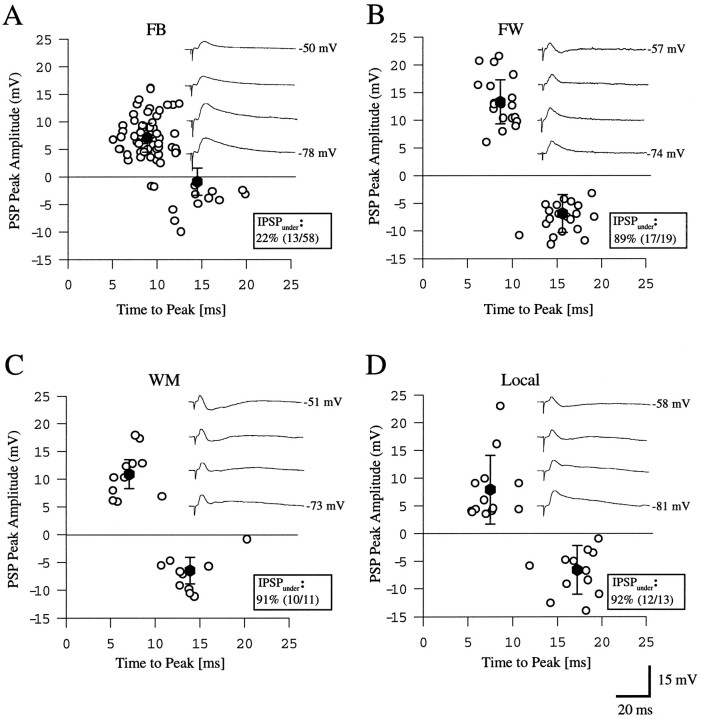
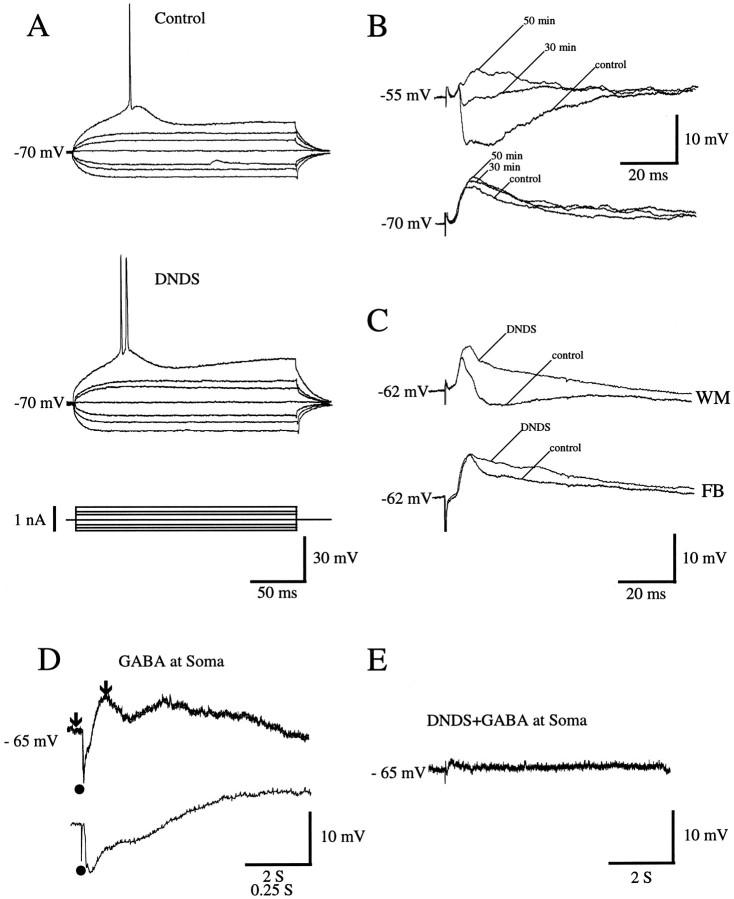
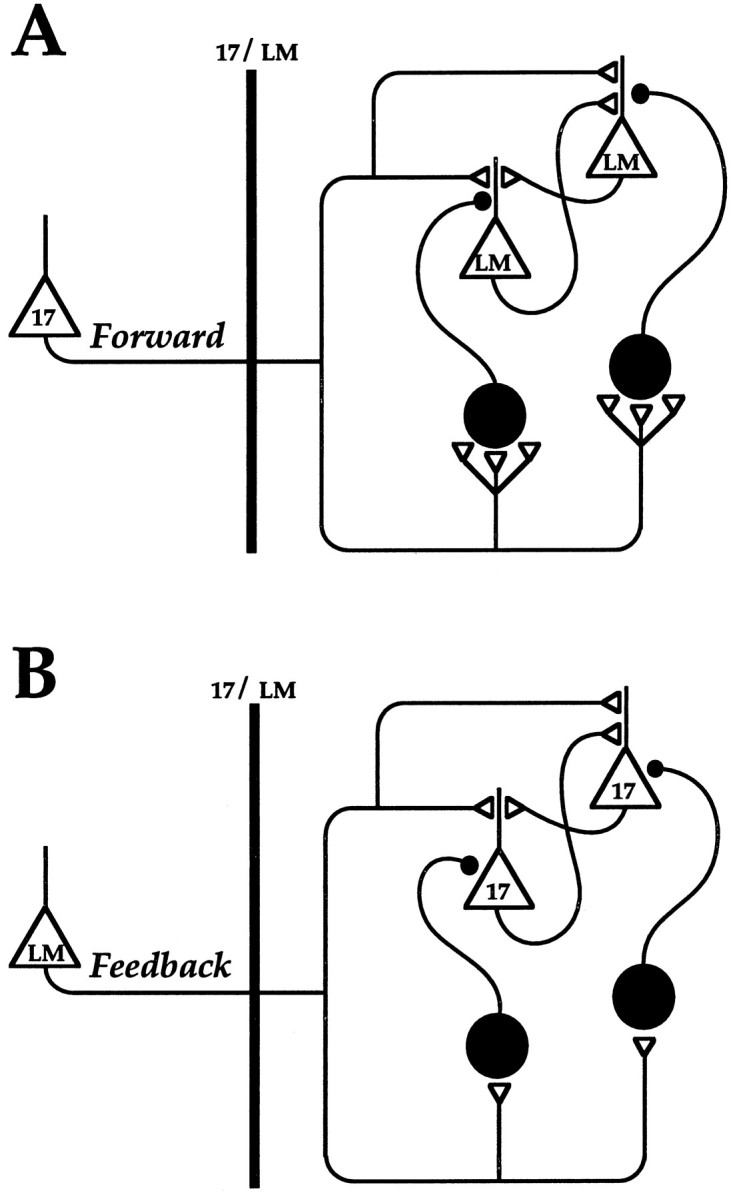
Different cortical areas are linked reciprocally via forward and feedback connections. Forward connections are involved in the representation of retinal images, whereas feedback pathways may play a role in the selection and interpretation of visual information. To examine the synaptic mechanisms of forward and feedback connections between primary and secondary visual cortical areas directly, we have performed intracellular recordings in slices of rat visual cortex. Irrespective of stimulus intensity and membrane potential, 78% (45/58) of the cells in striate cortex activated by feedback input showed monosynaptic responses that were depolarizing only, and inhibitory inputs were evident merely as a slight acceleration in the decay of EPSPs. In contrast, in 89% (17/19) of the cells, stimulation of forward input evoked monosynaptic excitatory postsynaptic potentials (EPSPs), followed by disynaptic, hyperpolarizing inhibitory postsynaptic potentials (IPSPs). EPSPs followed by IPSPs also were recorded after stimulation of local connections within primary visual cortex (92%, 12/13) and after activation of thalamocortical input (91%, 10/11). These results suggest that the synaptic organization of feedback connections are distinct from forward, local, and thalamocortical circuits. The findings further indicate that intracortical back projections exert modulatory influences via synaptic mechanisms in which weak inhibitory input is strongly dominated by excitation.


Figures

Fig. 1.
Fig. 1.
Arrangement of stimulating and recording electrodes for studying postsynaptic potentials evoked by forward (A), feedback (B), local (C), and thalamocortical (D) pathways in slices of rat visual cortex. The interrupted linerunning from the notch below white matter (WM) to the pial surface demarcates the myeloarchitectonic border between primary visual cortex (area17) and the secondary visual area (LM). Dorsal is up; medial is to the right.
Fig. 2.
Fig. 2.
Regular-spiking (RS) and fast-spiking (FS) neurons receive monosynaptic input from feedback connection. A, Left, Spike discharge pattern of RS neuron in layer 2/3 of area 17 during injection of depolarizing current pulse (200 msec, 0.5 nA). Recording atVm = −78 mV). Right, PSP of same cell after electrical stimulation at 0.1 and 10 Hz in area LM.B, Left, Spike discharge pattern of FS neuron in layer 2/3 of area 17 in response to intracellular current injection. Right, PSP of same cell after stimulation at different frequencies in LM. Recording at Vm = −69 mV.
Fig. 3.
Fig. 3.
A, B, Antidromic activation depends on stimulus strength. A, Intracellular recording from regular-spiking neuron in layer 2/3 of area 17. Subthreshold monosynaptic PSP evoked by stimulating feedback input with medium-intensity stimulus (1.4T). Stimulation at2T produces larger PSP that triggers an action potential. Recording at Vm = −73 mV. A further increase in stimulus intensity to 2.5T evokes an antidromic spike. B, Events in A shown at higher temporal resolution. Notice that antidromic spike is succeeded by synaptic potential, indicating that forward-projecting neurons receive feedback input. C, D, Monosynaptic and polysynaptic activity after stimulation of forward and feedback pathways. C, PSPs of regular-spiking layer 2/3 neuron in area 17 (recorded at the resting potential) after stimulation (1.5T) of feedback input. Top, Low frequency stimulation (0.1 Hz) reveals an early and a late peak (arrow). Bottom, High frequency stimulation (10 Hz) elicits early and late peak (arrow) only to first stimulus of the train; subsequent stimuli fail to evoke second peak. The amplitude of the early peak is increased because of elimination of polysynaptic inhibitory inputs. D, PSPs of regular-spiking layer 2/3 neuron in area LM (recording at depolarized potential) after stimulation (1.6T) of forward input.Top, 0.1 Hz stimulation (0.1 Hz) reveals an early and a late peak (arrow), followed by a long-lasting hyperpolarization. Bottom, With 10 Hz stimulation, the late peak and the pronounced afterhyperpolarization are present only in the first trial, and both are absent after subsequent stimuli. PSP amplitude is increased, and the decay is slowed because of elimination of polysynaptic EPSPs and IPSPs.
Fig. 4.
Fig. 4.
PSPs after stimulation of forward and feedback inputs. A, PSPs of regular-spiking layer 2/3 neuron in area 17 after low (1.3T) and high (1.8T) intensity stimulation of feedback input. Hyperpolarizing inhibition is absent at the membrane potentials tested. B, PSPs of regular-spiking layer 2/3 neuron in area LM after low (1.3T) and high (1.8T) intensity stimulation of forward input. At depolarized membrane potentials, high intensity stimulation reveals strong hyperpolarizing inhibition.
Fig. 5.
Fig. 5.
Distinct PSPs evoked by stimulation of converging inputs with different origins. A, PSPs of regular-spiking layer 2/3 neuron in area 17 after stimulation (1.8T) of feedback inputs (FB) and putative thalamocortical inputs entering from subcortical white matter (WM). Note that this neuron, which shows no hyperpolarizing inhibition to FB inputs, exhibits pronounced hyperpolarization (at depolarized membrane potentials) to WM stimulation. B, PSPs of regular-spiking layer 2/3 neuron in area 17 after stimulation (1.6T) of FB inputs and local horizontal connections (Local) within area 17. Note that this neuron, which shows no hyperpolarizing inhibition to FB inputs, exhibits strong hyperpolarizing response (at depolarized membrane potential) to local inputs.
Fig. 7.
Fig. 7.
Comparison of peak amplitude of monosynaptic EPSPs (open circles above zero line) and disynaptic IPSPs (open circles below zero line) evoked by high intensity stimulation (1.9T) of different pathways providing input to layer 2/3 neurons of rat visual cortex. All measurements were performed at depolarized membrane potentials, 10–15 mV positive to the rest.Filled circles in each panel (A–D) indicate mean ± SD of EPSPs and IPSPs.IPSPunder indicates the percentage of neurons that show hyperpolarizing inhibition. Insets, Comparison of PSPs evoked in regular-spiking layer 2/3 cells of rat visual cortex at different membrane potentials in response to high intensity stimulation (1.9T) of different inputs. A, Recording in area 17. Typical feedback input from area LM, representative for 78% of the cells tested. B, Recording in area LM. Forward input from area 17. C, Stimulation in white matter below recording site in area 17. D, Input from remote location within area 17.
Fig. 6.
Fig. 6.
A–C, Intracellular blockade of IPSPs by DNDS in regular-spiking neurons of rat visual cortex.A, Response of layer 2/3 neuron in area 17 to injection of hyperpolarizing and depolarizing current. Control records were obtained immediately after impalement; records in the presence of DNDS were obtained 30 min later. Note that intracellular injection of DNDS has no significant effect on input resistance or membrane time constant. B, PSPs (recordings at different membrane potentials) of layer 2/3 neuron in area LM evoked by stimulation (1.6T) of forward input. Control trace was obtained immediately after impalement with DNDS-filled electrode. As DNDS slowly enters the cell, IPSP amplitude is reduced markedly 30 min after impalement and disappears altogether at 50 min. C, PSPs of layer 2/3 cell in area 17 after stimulation (1.7T) of inputs from white matter (WM) and feedback (FB) connections. Control traces represent recordings before intracellular infusion of DNDS. Traces labeledDNDS show responses 45 min after impalement and after DNDS effectively blocks IPSPs. D, Intracellular infusion of DNDS blocks response to local application of GABA. Intracellular response to GABA application (filled circle) near soma of layer 2/3 neuron in area 17 shortly after impalement with DNDS-filled electrode (top). The initial phase of the response (indicated by arrows) is shown at expanded time scale (bottom). E, Response to GABA application in the same neuron 30 min after impalement and infusion of DNDS.
Fig. 8.
Fig. 8.
Proposed schematic of forward and feedback circuits. Openlarge triangles indicate pyramidal cells. Opensmall trianglesrepresent excitatory synapses. Filledlarge circles indicate inhibitory GABAergic interneurons.Filledsmall circles represent inhibitory synapses. Note that, in the forward circuit (A), inputs to inhibitory interneurons are more numerous than in the feedback circuit (B). Also note that, in the forward circuit, inhibitory axons terminate on proximal dendrites, whereas in the feedback circuit they terminate on cell bodies. 17, Primary visual cortical neurons; LM, neurons in secondary visual area LM; 17/LM, border between areas 17 and LM.

References

    1. Aghajanian GK, Rasmussen K. Intracellular studies in the facial nucleus illustrating a simple method for obtaining viable motoneurons in adult brain slices. Synapse. 1989;3:331–338. - PubMed
    1. Allman J, Miezin F, McGuinness E. Stimulus-specific responses from beyond the classical receptive field: neurophysiological mechanisms for local–global comparisons in visual neurons. Annu Rev Neurosci. 1985;8:407–430. - PubMed
    1. Asanuma H, Sakata H. Functional organization of a cortical efferent system examined with focal depth stimulation in cats. J Neurophysiol. 1967;30:35–54.
    1. Benardo LS. Separate activation of fast and slow inhibitory postsynaptic potentials in rat neocortex in vitro. J Physiol (Lond) 1994;476:203–215. - PMC - PubMed
    1. Buhl EH, Halasy K, Somogyi P. Diverse sources of hippocampal unitary inhibitory postsynaptic potentials and the number of synaptic release sites. Nature. 1994;368:823–828. - PubMed

Publication types

LinkOut - more resources