Review
. 1996 Nov 26;93(24):13453-9.
doi: 10.1073/pnas.93.24.13453.

A synaptic basis for memory storage in the cerebral cortex

Affiliations
Review

A synaptic basis for memory storage in the cerebral cortex

M F Bear. Proc Natl Acad Sci U S A. .

Abstract

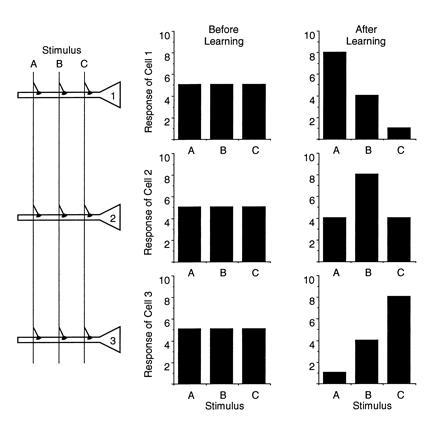
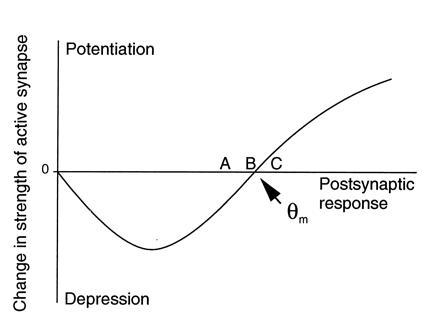
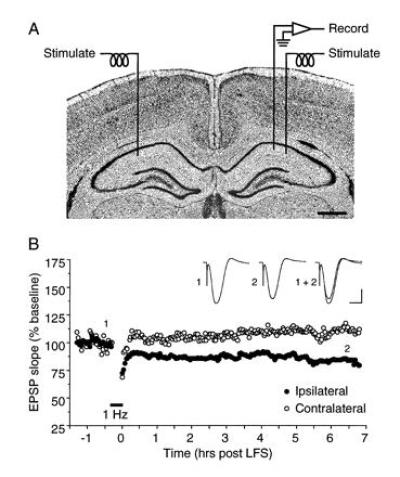
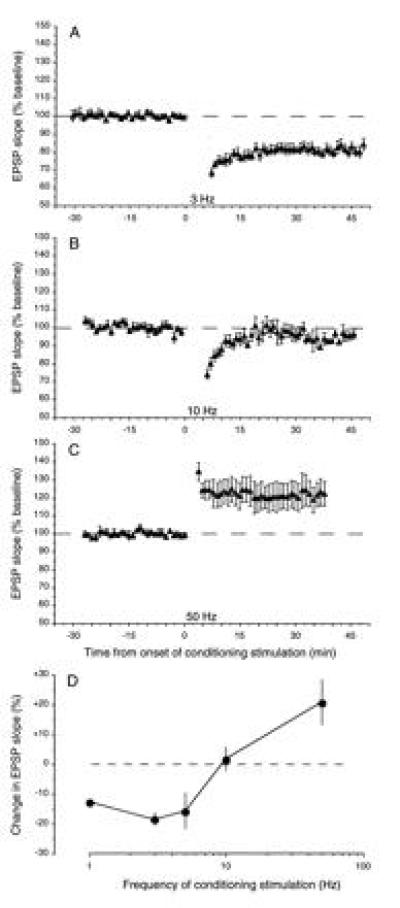
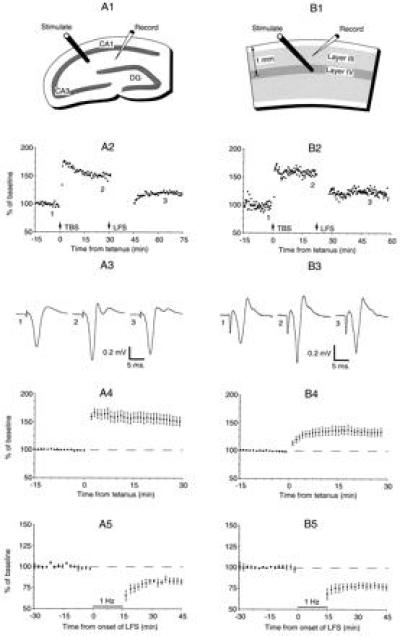
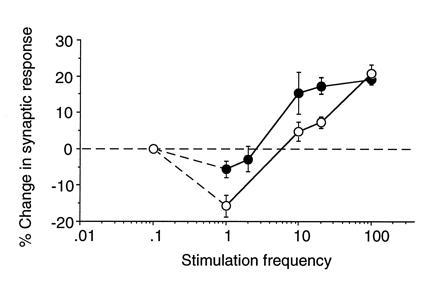
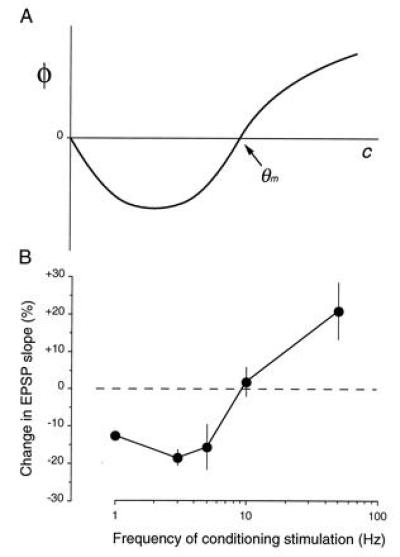
A cardinal feature of neurons in the cerebral cortex is stimulus selectivity, and experience-dependent shifts in selectivity are a common correlate of memory formation. We have used a theoretical "learning rule," devised to account for experience-dependent shifts in neuronal selectivity, to guide experiments on the elementary mechanisms of synaptic plasticity in hippocampus and neocortex. These experiments reveal that many synapses in hippocampus and neocortex are bidirectionally modifiable, that the modifications persist long enough to contribute to long-term memory storage, and that key variables governing the sign of synaptic plasticity are the amount of NMDA receptor activation and the recent history of cortical activity.


Figures

Figure 1
Figure 1
A model of distributed information storage. Three neurons (1, 2, and 3) receive inputs carrying information about three stimuli (A, B, and C). Before learning, all neurons respond equally to all stimuli. After learning, the neurons show stimulus selectivity, reflecting the modification of synapses in the network.
Figure 2
Figure 2
Function controlling synaptic plasticity at the Cooper synapse.
Figure 3
Figure 3
Homosynaptic LTD in adult hippocampus in vivo. (A) Schematic of the stimulation-recording configuration used in anesthetized rats. (B) LTD induced by a single episode of LFS (1 Hz, 900 pulses) is stable for as long as the preparation is viable. In this example, LFS of the ipsilateral Schaffer collaterals produced LTD that was stable for >6.5 hr. Displayed field potentials were evoked by stimulation of the ipsilateral Schaffer collaterals (averages of 10 consecutive sweeps) at times indicated by numerals. Scale bars: 2 mV, 10 ms. Figure modified from ref. .
Figure 4
Figure 4
Effects of conditioning stimulation delivered to the Schaffer collaterals at different frequencies. (AC) Normalized averages (±SEM) of experiments in which 900 pulses were delivered at different frequencies: A, 3 Hz, n = 5; B, 10 Hz, n = 6; C, 50 Hz, n = 5. (D) The mean (±SEM) effect of 900 pulses of conditioning stimulation delivered at various frequencies on the response measured 30 min postconditioning. For each point, n ≥ 5. Figure modified from ref. .
Figure 5
Figure 5
Common forms of synaptic plasticity in slices of adult rat hippocampus (A) and adult rat visual cortex (B). The top row shows the stimulation-recording configurations. DG, dentate gyrus. The second row shows changes in the extracellular field potential induced by theta-burst stimulation (TBS) and by LFS (900 pulses delivered at 1 Hz in A2 and at 3 Hz in B2). Response magnitude was measured as the change in the initial slope of the negative field potential in A2 and as the peak negativity in B2. The third row shows averages of four consecutive field potentials taken in each preparation before conditioning stimulation, after TBS, and after LFS for the experiments in row 2. The fourth row shows the average change in response magnitude after TBS (n = 4 for A4; n = 19 for B4). The fifth row shows the average change in response after LFS (900 pulses at 1 Hz), starting from an unpotentiated state (n = 5 for A5; n = 5 for B5). Figure modified from ref. .
Figure 6
Figure 6
Evidence for a sliding modification threshold. Frequency-response functions derived from visual cortex of light-deprived (solid symbols) and normal (open symbols) rats. Data points for stimulation frequencies ≥ 10 Hz represent the average change (±SEM) 20 min after the delivery of 120 pulses of conditioning stimulation. Data points for 1 and 2 Hz stimulation represent the average change (±SEM) 30 min after delivery of 900 pulses of conditioning stimulation. The data point for 0.07 Hz is inferred from the fact that baseline stimulation once every 15 sec does not appear to induce synaptic modification in light-deprived or normal cortex. Figure modified from ref. .
Figure 7
Figure 7
Comparison of theory and experiment.

References

    1. Hebb D O. Organization of Behavior. New York: Wiley; 1949.
    1. Anderson J A, Rosenfeld E, editors. Neurocomputing: Foundations of Research. Cambridge, MA: MIT Press; 1988.
    1. Anderson J A, Mozer M C. In: Parallel Models of Associative Memory. Hinton G E, Anderson J A, editors. Hillsdale, NJ: Erlbaum; 1981.
    1. Breese C, Hampson R, Deadwyler S. J Neurosci. 1989;9:1097–1111. - PMC - PubMed
    1. Wilson M, McNaughton B. Science. 1993;261:1055–1058. - PubMed

Publication types

Substances