. 1996 Dec 10;93(25):14333-7.
doi: 10.1073/pnas.93.25.14333.

Detection of a Yb3+ binding site in regenerated bacteriorhodopsin that is coordinated with the protein and phospholipid head groups

Affiliations

Detection of a Yb3+ binding site in regenerated bacteriorhodopsin that is coordinated with the protein and phospholipid head groups

C Roselli et al. Proc Natl Acad Sci U S A. .

Abstract

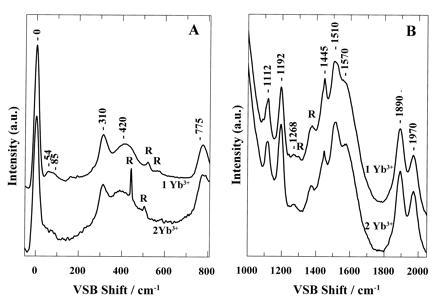
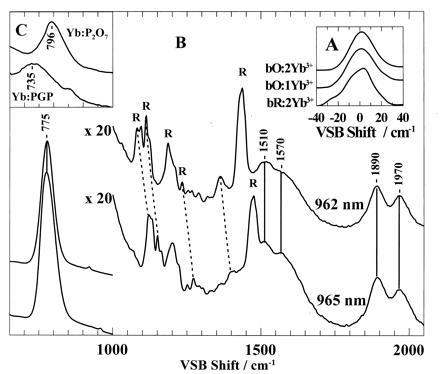
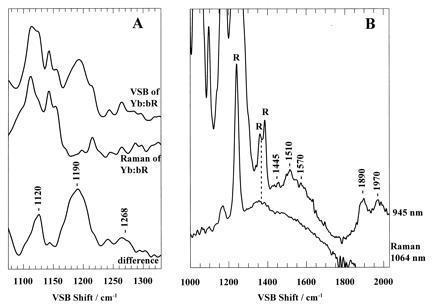
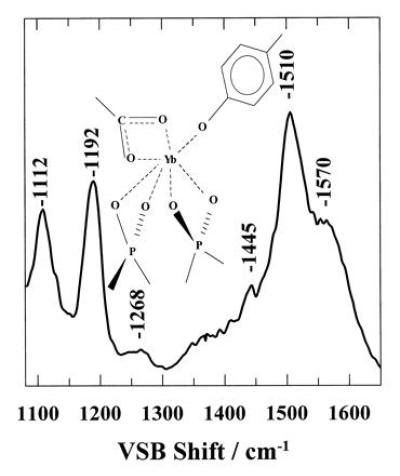
Near infrared Yb3+ vibronic sideband spectroscopy was used to characterize specific lanthanide binding sites in bacteriorhodopsin (bR) and retinal free bacteriorhodopsin (bO). The VSB spectra for deionized bO regenerated with a ratio of 1:1 and 2:1 ion to bO are identical. Application of a two-dimensional anti-correlation technique suggests that only a single Yb3+ site is observed. The Yb3+ binding site in bO is observed to consist of PO2- groups and carboxylic acid groups, both of which are bound in a bidentate manner. An additional contribution most likely arising from a phenolic group is also observed. This implies that the ligands for the observed single binding site are the lipid head groups and amino acid residues. The vibronic sidebands of Yb3+ in deionized bR regenerated at a ratio of 2:1 ion to bR are essentially identical to those in bO. The other high-affinity binding site is thus either not evident or its fluorescence is quenched. A discussion is given on the difference in binding of Ca2+ (or Mg2+) and lanthanides in phospholipid membrane proteins.


Figures

Figure 1
Figure 1
Near infrared Yb3+ VSB spectra of bO samples containing one Yb3+ (Upper) and two Yb3+ (Lower) atoms per bO. (A) Low frequency spectra: 878 nm, 450 mW, 500 scans. (B) High frequency spectra: 965 nm excitation, 450 mW, 10,000 scans.
Figure 2
Figure 2
Near infrared Yb3+ VSB spectra Yb3+ regenerated bR and bO. (A) Zero phonon lines for samples of bR containing two Yb3+ (Bottom; 870 nm excitation, 20 mW, 100 scans), bO containing one Yb3+ (Middle: 878 nm excitation, 650 mW, 1000 scans), and bO containing two Yb3+ atoms (Top: 884 nm excitation, 500 mW, 1000 scans). (B) VSB spectra of bR in the 700–2000 cm−1 VSB shift region, excited at 965 nm (Lower: 250 mW, 2000 scans) and 962 nm (Upper: 250 mW, 2000 scans). Obvious Raman bands from the retinal chromophore are designated R. (C) VSB bands arising from the phosphate symmetric P–O stretching mode of the PGP ( Lower: 886 nm, 180 mW, 200 scans) and P2O72− (Upper: 876 nm, 450 mW, 100 scans) Yb3+ complexes.
Figure 3
Figure 3
(A) Near infrared Yb3+ VSB spectrum, excited at 965 nm, of bR containing two Yb3+ atoms per bR in the 1100–1300 cm−1 VSB shift region (Top: 250 mW, 2000 scans) and the Fourier transform Raman spectrum of the same bR sample excited at 1064 nm (Middle: 280 mW, 2000 scans); 1064 nm excitation results in the observation of essentially only the Raman contributions of the retinal chromophore. Subtracting the retinal Raman contributions (middle spectrum) from the top spectrum results in a difference spectrum (Bottom) revealing VSB bands previously hidden by the Raman contributions. (B) VSB spectrum of the same bR sample excited at 945 nm (Upper: 450 mW, 2000 scans). At this wavelength of excitation, the retinal Raman contributions are not present in the 1400–2000 cm−1 VSB shift spectral region. The Fourier transformed Raman spectrum of the same bR sample is shown for comparison (Lower: excitation 1064 nm, 280 mW, 2000 scans).
Figure 4
Figure 4
VSB spectrum of bO containing one and two Yb3+ atoms per bO reconstructed from the two-dimensional correlation analysis. (Inset) Schematic diagram showing the possible configuration of the ligands of Yb3+ suggested by the results of this work.

Similar articles

Cited by

References

    1. Stoeckenius W, Lozier R, Bogomolni R A. Biochim Biophys Acta. 1979;505:215–278. - PubMed
    1. Lanyi J K. J Bioenerg Biomembr. 1992;24:169–179. - PubMed
    1. Mathies R A, Lin S W, Ames J B, Pollard W T. Annu Rev Biophys Biophys Chem. 1991;20:491–518. - PubMed
    1. Khorana H G. J Biol Chem. 1988;263:7439–7442. - PubMed
    1. Bridgen J, Walker I. Biochemistry. 1976;15:792–798. - PubMed

Publication types

MeSH terms

LinkOut - more resources