. 1996 Dec 10;93(25):14503-8.
doi: 10.1073/pnas.93.25.14503.

HDA1 and RPD3 are members of distinct yeast histone deacetylase complexes that regulate silencing and transcription

Affiliations

HDA1 and RPD3 are members of distinct yeast histone deacetylase complexes that regulate silencing and transcription

S E Rundlett et al. Proc Natl Acad Sci U S A. .

Abstract

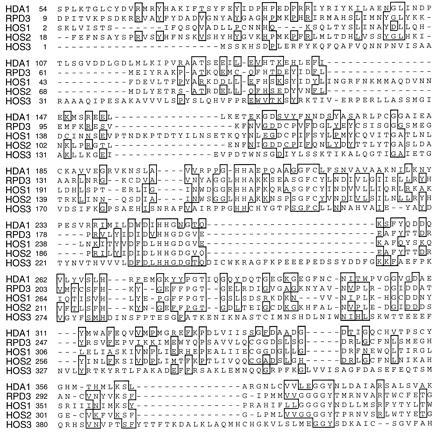
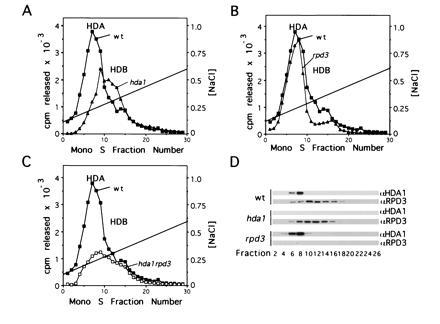
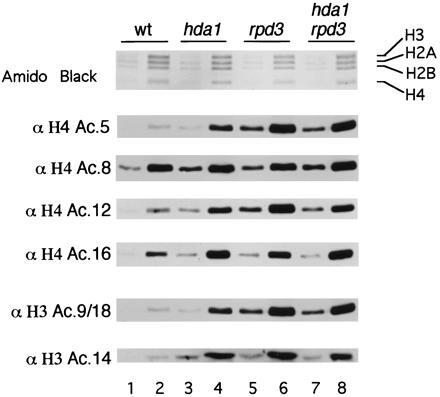
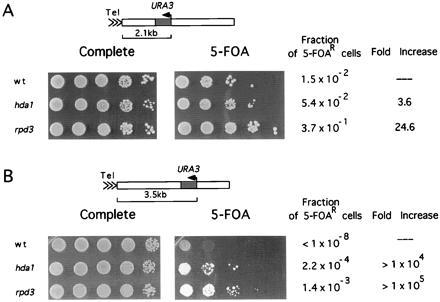
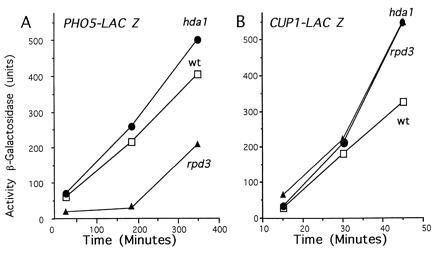
Increased histone acetylation has been correlated with increased transcription, and regions of heterochromatin are generally hypoacetylated. In investigating the cause-and-effect relationship between histone acetylation and gene activity, we have characterized two yeast histone deacetylase complexes. Histone deacetylase-A (HDA) is an approximately 350-kDa complex that is highly sensitive to the deacetylase inhibitor trichostatin A. Histone deacetylase-B (HDB) is an approximately 600-kDa complex that is much less sensitive to trichostatin A. The HDA1 protein (a subunit of the HDA activity) shares sequence similarity to RPD3, a factor required for optimal transcription of certain yeast genes. RPD3 is associated with the HDB activity. HDA1 also shares similarity to three new open reading frames in yeast, designated HOS1, HOS2, and HOS3. We find that both hda1 and rpd3 deletions increase acetylation levels in vivo at all sites examined in both core histones H3 and H4, with rpd3 deletions having a greater impact on histone H4 lysine positions 5 and 12. Surprisingly, both hda1 and rpd3 deletions increase repression at telomeric loci, which resemble heterochromatin with rpd3 having a greater effect. In addition, rpd3 deletions retard full induction of the PHO5 promoter fused to the reporter lacZ. These data demonstrate that histone acetylation state has a role in regulating both heterochromatic silencing and regulated gene expression.


Figures

Figure 1
Figure 1
Yeast sequences having similarity to HDA1 histone deacetylase. Comparison of HDA1 (GenBank accession no. Z71297Z71297), RPD3 (GenBank accession no. P32561P32561), HOS1 (GenBank accession nos. Z49219Z49219 23), HOS2 (GenBank accession no. X91837X91837), and HOS3 (GenBank accession no. U43503U43503). The sequences were aligned using the pileup program (Genetics Computer Group, Madison, WI). Regions of identity are blocked and shaded using the bestfit program. HDA1 and RPD3 show approximately 24.5% identity and 48.6% similarity over a region of approximately 498 amino acids. By comparison, the human HD1 protein and RPD3 show 60.3% identity and 78.4% similarity over a region of 450 amino acids, suggesting that HD1 may be the human RPD3 homolog. HDA1 and HOS1 show 21.1% identity, 52.9% similarity over 571 amino acids; HDA1 and HOS2, 28% identity, 51.3% similarity over 522 amino acids; HDA1 and HOS3, 24.9% identity, 45.7% similarity over 743 amino acids.
Figure 2
Figure 2
HDA1 and RPD3 are found in different histone deacetylase complexes. hda1 and rpd3 refer to hda1Δ and rpd3Δ, respectively. Mono S profiles of deacetylase activity in (A) YDS2U (wild-type) (▪), SRYD2U (hda1) (▴), (B) YDS2U (wild-type) (▪), SRYR34 (rpd3) (▴), and (C) YDS2U (wild-type) (▪), SRYR38 (hda1rpd3) (□). Nuclear extracts from 100 g cells were prepared and assayed as described (23), and proteins eluting between 150 mM and 350 mM NH4Cl from DEAE–Sepharose FF were dialyzed and chromatographed on Mono S HR 5/5 using identical parameters. Activity (3H-acetate released) is shown as a function of fraction number. (D) Western blots of Mono S fractions from YDS2U (wild-type), SRYD2U (hda1), and SRYR34 (rpd3) were probed with either anti-HDA1 (23) or anti-RPD3, and detected with ECL (Amersham).
Figure 3
Figure 3
HDA1 and RPD3 disruptions results in histone H4 and H3 hyperacetylation. Relative histone acetylation levels in YDS2U (wild-type) (lanes 1 and 2), SRYD2U (hda1) (lanes 3 and 4), SRYR34 (rpd3) (lanes 5 and 6), and SRYR38 (hda1 rpd3) (lanes 7 and 8) were determined by loading 1 μg (lanes 1, 3, 5, and 7) or 3 μg (lanes 2, 4, 6, and 8) of histones. After transfer, blots were probed separately with antibodies specific for H4 acetyl-lysine 5, 8, 12, or 16. Additonally, blots were probed with antibodies specific for H3 acetyl-lysine 9 and 18 (9/18) or 14. Antibody binding was then detected using ECL.
Figure 4
Figure 4
HDA1 and RPD3 disruptions increase telomeric silencing. The extent of URA3 gene repression was determined by measuring resistance to 5-FOA (29) (A) Strains YDS21U (wild-type), SRY21U (hda1), and SRYR39 (rpd3) containing URA3 integrated 2.1 kb from the telomere were grown on YEPD plates for 3 days at 30°C before 10-fold dilutions were spotted onto media with or without 5-FOA. To quantitate the fraction of cells capable of growing on 5-FOA-containing media, diluted cell suspensions were also spread and cell number was determined. (B) Strains YDS35U (wild-type), SRY35U (hda1), and SRYR40 (rpd3) containing URA3 integrated 3.5 kb from the telomere were grown on YEPD plates and assayed as in A.
Figure 5
Figure 5
The effects of HDA1 and RPD3 disruptions on gene activity. Determination of noninduced and activated transcription in wild-type, hda1, and rpd3 cells was performed through β-galactosidase assays. YDS3 (wild-type) (□), SRY3D2 (hda1) (•), or SRYR3 (rpd3) (▴) was transformed with either (A) pMH313 (containing a 2.4-kb DraI fragment of the PHO5 promoter fused to lacZ) (39) or (B) pCLUC (containing the entire CUP1 promoter fused to lacZ) (40), and induced for various time periods (38) before harvesting and determining β-galactosidase activity in cell extracts by the following formula: units = OD420 × 103 mg−1·min−1. The values given represent an average of the data obtained from at least five independent transformants. The standard deviations for these data were <30% and <10%, respectively, for the PHO5 and CUP1 promoters.

References

    1. Grunstein M. Annu Rev Cell Biol. 1990;6:643–678. - PubMed
    1. Turner B M. Cell. 1993;75:5–8. - PubMed
    1. Hebbes T R, Thorne A W, Clayton A L, Crane-Robinson C. Nucleic Acids Res. 1992;20:1017–1022. - PMC - PubMed
    1. Clayton A L, Hebbes T R, Thorne A W, Crane-Robinson C. FEBS Lett. 1993;336:23–26. - PubMed
    1. Bone J R, Lavender J, Richman R, Palmer M J, Turner B M, Kuroda M I. Genes Dev. 1994;8:96–104. - PubMed

Publication types

MeSH terms