. 1996 Dec 10;93(25):14804-8.
doi: 10.1073/pnas.93.25.14804.

Correction of obesity and diabetes in genetically obese mice by leptin gene therapy

Affiliations

Correction of obesity and diabetes in genetically obese mice by leptin gene therapy

P Muzzin et al. Proc Natl Acad Sci U S A. .

Abstract

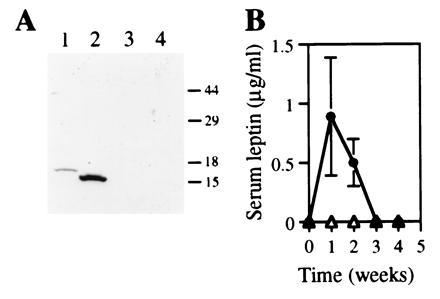
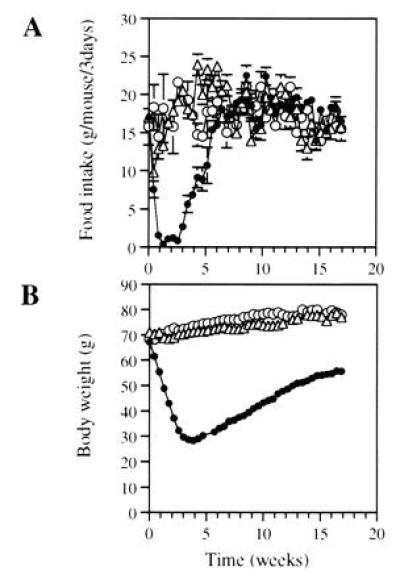
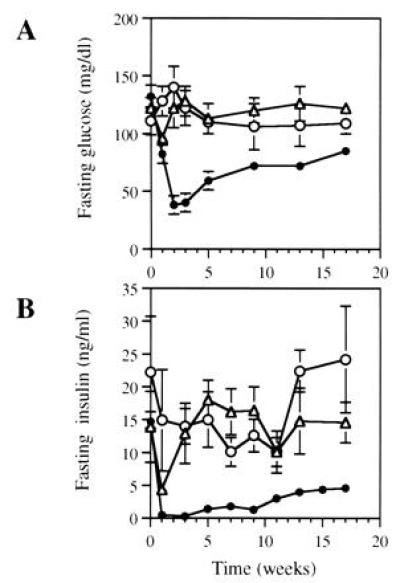
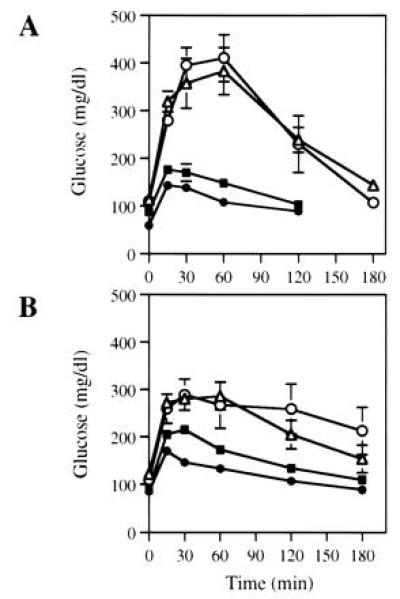
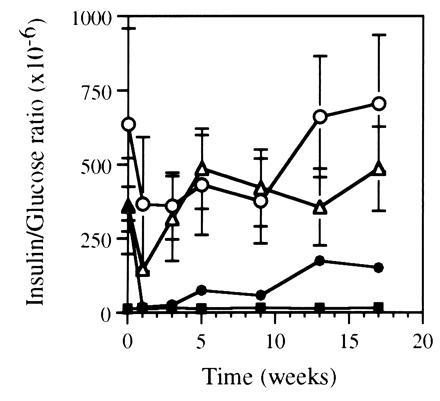
The ob/ob mouse is genetically deficient in leptin and exhibits both an obese and a mild non-insulin-dependent diabetic phenotype. To test the hypothesis that correction of the obese phenotype by leptin gene therapy will lead to the spontaneous correction of the diabetic phenotype, the ob/ob mouse was treated with a recombinant adenovirus expressing the mouse leptin cDNA. Treatment resulted in dramatic reductions in both food intake and body weight, as well as the normalization of serum insulin levels and glucose tolerance. The subsequent diminishment in serum leptin levels resulted in the rapid resumption of food intake and a gradual gain of body weight, which correlated with the gradual return of hyperinsulinemia and insulin resistance. These results not only demonstrated that the obese and diabetic phenotypes in the adult ob/ob mice are corrected by leptin gene treatment but also provide confirming evidence that body weight control may be critical in the long-term management of non-insulin-dependent diabetes mellitus in obese patients.


Figures

Figure 1
Figure 1
(A) Expression of leptin by HepG2 cells transduced with Ad.RSV-mLeptin (lane 2) or a recombinant adenovirus expressing the hAAT, Ad.RSV-hAAT (lane 3), or the buffer (lane 4). Recombinant leptin produced in E. coli is also shown (lane 1). Numbers at right indicate molecular mass standards (in kDa). (B) Serum leptin levels in ob/ob mice after recombinant adenovirus administration. The ob/ob mice were injected with either Ad.RSV-mLeptin (•) or Ad.RSV-hAAT (▵) at 3 × 10⁹ pfu per mouse. Serum leptin concentrations were measured by Western blot analysis. Two microliters of sera from treated mice was electrophoresed on SDS/PAGE gels. Each point represents the mean ± SEM of seven mice. The limit of detection was 0.05 μg/ml. Three of 10 mice injected with Ad.RSV-mLeptin died within the first 3 weeks for unknown reasons.
Figure 2
Figure 2
Reduction of food intake (A) and body weight (B) in ob/ob mice after leptin gene administration. The ob/ob mice were injected with either Ad.RSV-mLeptin (•) or Ad.RSV-hAAT (▵) at 3 × 10⁹ pfu per mouse or PBS only (○). The mice were caged individually. Food intake and body weight were measured every 3 days. Food intake data are expressed as number of grams consumed every 3 days. All points represent the mean ± SEM of seven mice (some error bars are hidden within symbols).
Figure 3
Figure 3
Fasting glucose (A) and insulin (B) levels in ob/ob mice after leptin gene administration. The ob/ob mice were injected with Ad.RSV-mLeptin (•) or Ad.RSV-hAAT (▵) at 3 × 10⁹ pfu per mouse or PBS only (○) and periodically bled for serum insulin and blood glucose measurements. These parameters were determined in 16-h fasted mice. Each value represents mean ± SEM of six to eight mice. The mean values of serum insulin and blood glucose levels in age-matched C57BL/6J mice were 0.4 ± 0.1 ng/ml and 88 ± 5 mg/dl, respectively.
Figure 4
Figure 4
Glucose tolerance test in ob/ob mice after leptin gene treatment. The ob/ob mice were injected with Ad.RSV-mLeptin (•) or Ad.RSV-hAAT (▵) at 3 × 10⁹ pfu/mouse or PBS only (○). Five weeks (A) and 17 weeks (B) after injection, glucose tolerance test were performed on treated mice. Blood glucose were measured prior to and at indicated times after intraperitoneal glucose injection. Glucose tolerance test was also performed with age-matched C57BL/6J mice (▪) for comparison. Each value represents mean ± SEM of six to eight mice.
Figure 5
Figure 5
Insulin resistance in ob/ob mice after leptin gene treatment. After administration of Ad.RSV-mLeptin (•) or Ad.RSV-hAAT (⋄) at 3 × 10⁹ pfu per mouse or PBS only (○), the mice were periodically bled for serum insulin and blood glucose measurements. The insulin-to-glucose molar ratio was determined in fasted mice. The same parameters were also measured in age-matched C57BL/6J mice (▪) for comparison. Each value represents mean ± SEM of six to eight mice.

References

    1. Olefsky J M, Kolterman O G, Scarlett J A. Am J Physiol. 1982;243:E15–E30. - PubMed
    1. Zuniga-Guajardo S, Jimenez J, Angel A, Zinman B. Metabolism. 1986;35:278–282. - PubMed
    1. Jahr H, Ratzman K P, Beckert R, Besch W, Hahn H J. Metabolism. 1983;32:1101–1106. - PubMed
    1. Felber J P. Int J Obesity. 1992;16:937–952. - PubMed
    1. Wing R R, Koeske R, Epstein L H, Nowalk M P, Gooding W, Becker D. Arch Intern Med (Moscow) 1987;147:1749–1753. - PubMed

Publication types