. 1996 Dec 10;93(25):14878-83.
doi: 10.1073/pnas.93.25.14878.

Detection of cortical activation during averaged single trials of a cognitive task using functional magnetic resonance imaging

Affiliations

Detection of cortical activation during averaged single trials of a cognitive task using functional magnetic resonance imaging

R L Buckner et al. Proc Natl Acad Sci U S A. .

Abstract

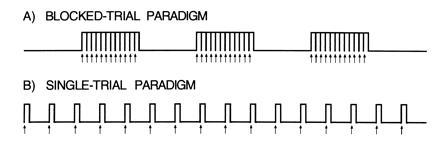
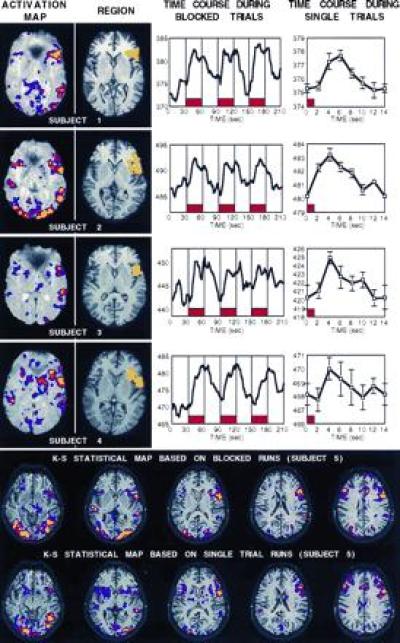
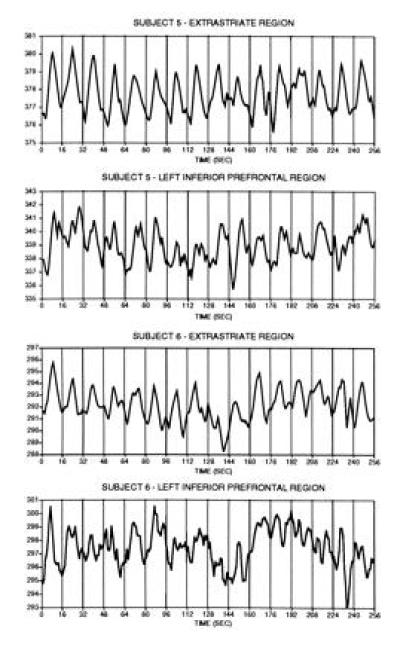
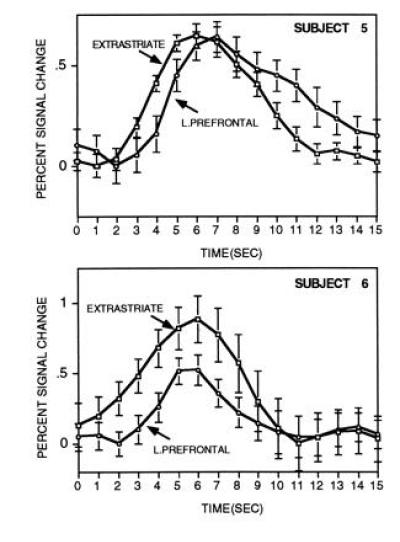
Functional neuroimaging studies in human subjects using positron emission tomography or functional magnetic resonance imaging (fMRI) are typically conducted by collecting data over extended time periods that contain many similar trials of a task. Here methods for acquiring fMRI data from single trials of a cognitive task are reported. In experiment one, whole brain fMRI was used to reliably detect single-trial responses in a prefrontal region within single subjects. In experiment two, higher temporal sampling of a more limited spatial field was used to measure temporal offsets between regions. Activation maps produced solely from the single-trial data were comparable to those produced from blocked runs. These findings suggest that single-trial paradigms will be able to exploit the high temporal resolution of fMRI. Such paradigms will provide experimental flexibility and time-resolved data for individual brain regions on a trial-by-trial basis.


Figures

Figure 1
Figure 1
Heuristic diagrams display the difference between a blocked-trial paradigm (A) and a single-trial paradigm (B). Arrows indicate the beginnings of the individual trials. The main advantage of the single-trial paradigm is the spacing of the trials. The trials are separated in time allowing the time course of activation to be appreciated and the trials to be averaged in relation to their onset.
Figure 2
Figure 2
(Upper) The top figure shows experiment one data for each of the four subjects. For each subject, four kinds of data are shown left to right including: an activation map (threshold = P < 0.01, red = P < 10−5, yellow = P < 10−8) plotted superimposed on top of a raw T2* weighted functional image; the region constructed to include the left inferior prefrontal activation (yellow) on top of a T1-weighted echo planar image showing more detailed anatomy; the region’s mean MR signal intensity during the runs with blocked trials of word-stem completion (placement of blocks shown in red, time course smoothed to three time points); and the region’s mean MR signal intensity during the single-trial runs (placement of trial shown in red, time point at 0 sec duplicated at time point 14 sec to show continuation of trial, no temporal smoothing, plus standard error of the mean). (Lower) K-S activation maps are shown for all slices collected in subject 5, plotted on top of the T1-weighted images (threshold lowered to P < 0.05 to allow more complete comparison, red = P < 10−4). Top activation map shows data derived from the blocked runs while the bottom map shows data derived solely from the single-trial runs. The two maps overlap considerably.
Figure 3
Figure 3
Time-course data from the extended single-trial runs in experiment two are shown for each subject (eight runs averaged per subject, see text). Data from each run comprise the mean MR signal magnitude within the individual regions indicated (separate data are shown for extrastriate and left inferior prefrontal regions). Each vertical line represents the start of a trial, each of which was spaced 16 sec apart. Clear signal changes in relation to the 16 temporally separate trials can be observed and most clearly for the extrastriate regions. Single-trial responses were more robust in the earlier trials as compared with the later trials. These signal changes were averaged to produce the time-course data presented in Fig. 4.
Figure 4
Figure 4
The time course for averaged single-trial responses are shown for separate brain regions in experiment two (plus standard error of the mean). Both regions come from the same slice and were selected based on data from the blocked runs. Each time course comprises the average of 128 individual trials and is plotted in relation to percent signal change to make the comparison across brain regions. Time-course data are smoothed across adjacent time points. As can be seen, robust signal increases occur starting at about two sec after the onset of the stimulus (0 sec) and continue for about 10 sec. The prefrontal response was delayed in relation to the extrastriate response in both subjects.

Comment in

References

    1. Deyoe E A, Bandettini P, Neitz J, Miller D, Winans P. Neurosci Methods. 1994;15:171–187. - PubMed
    1. Raichle M E. In: The Handbook of Physiology. Plum F, Mountcastle V, editors. Vol. 5. Bethesda, MD: Am. Physiol. Assoc.; 1987. pp. 643–674.
    1. Cohen M S, Weisskoff R M. Magn Reson Imaging. 1991;9:1–37. - PubMed
    1. Hinke R M, Hu X, Stillman A E, Kim S-G, Merkle H, Salmi R, Ugurbil K. NeuroReport. 1993;14:675–678. - PubMed
    1. Binder J R, Rao S M, Hammeke T A, Frost J A, Bandettini P A, Jesmanowicz A, Hyde J S. Arch Neurol. 1995;52:593–601. - PubMed

Publication types

LinkOut - more resources