. 1996 Dec 1;184(6):2141-51.
doi: 10.1084/jem.184.6.2141.

Resting memory CD8+ T cells are hyperreactive to antigenic challenge in vitro

Affiliations

Resting memory CD8+ T cells are hyperreactive to antigenic challenge in vitro

M Pihlgren et al. J Exp Med. .

Abstract

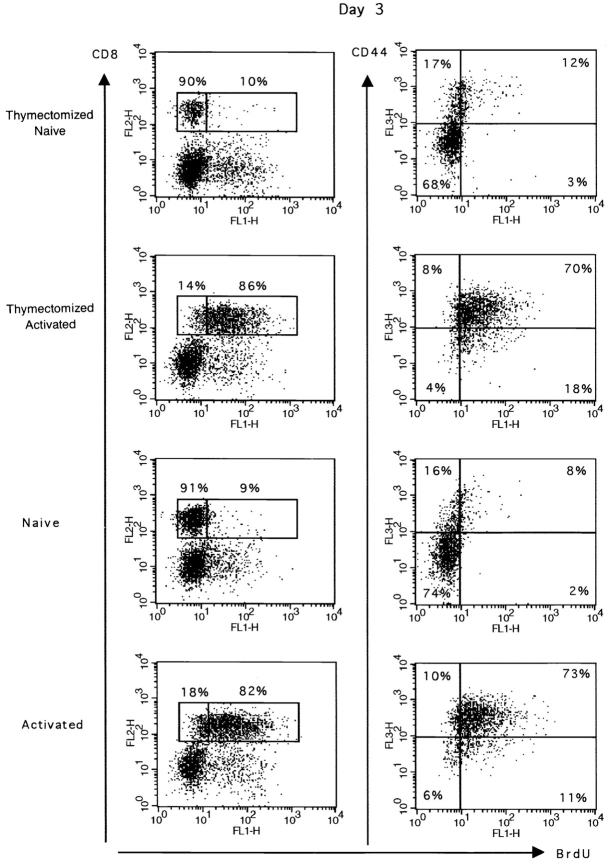
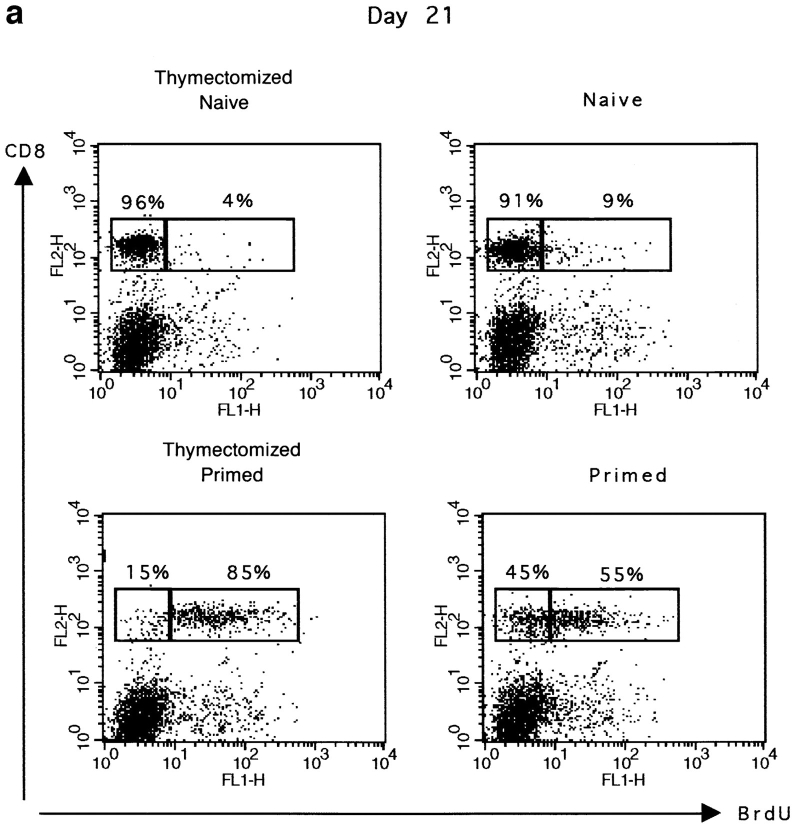
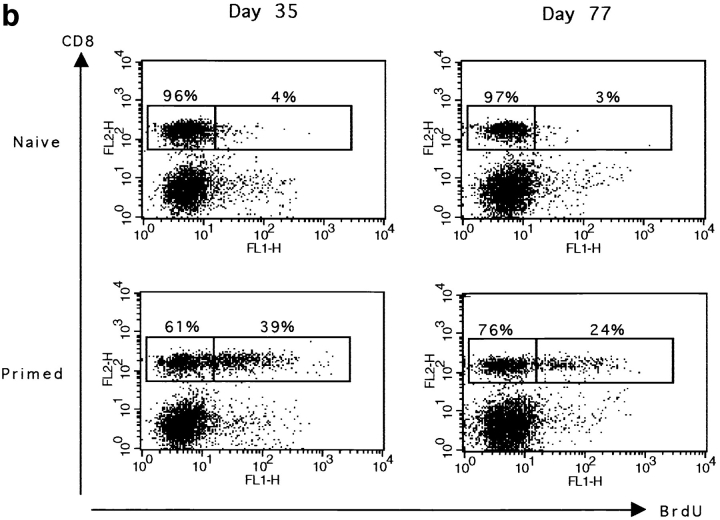
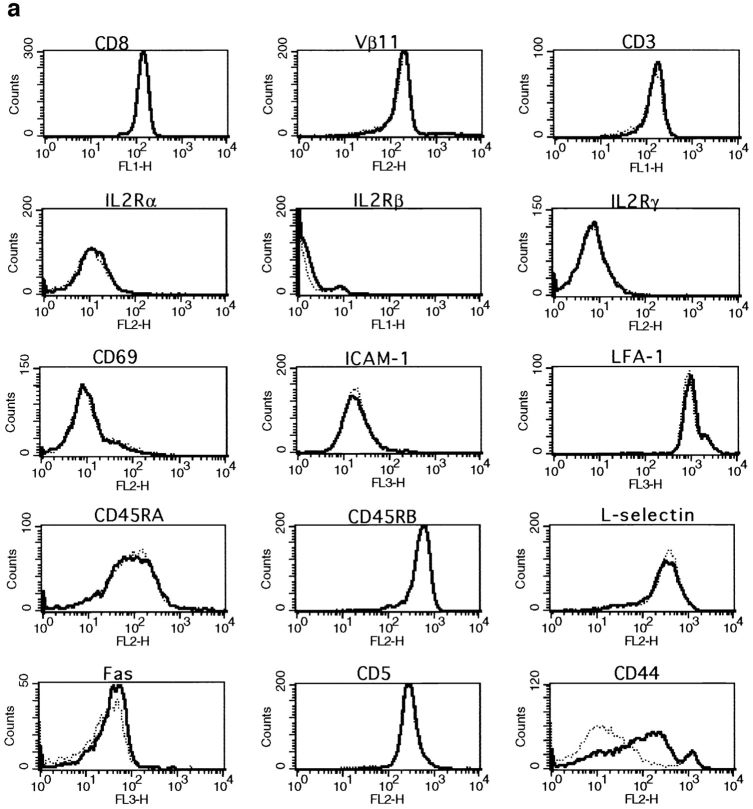
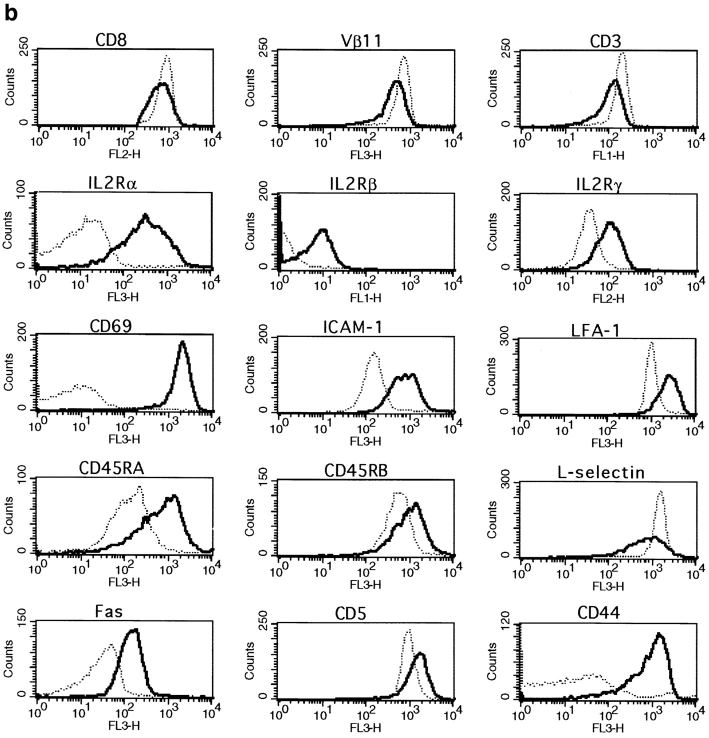
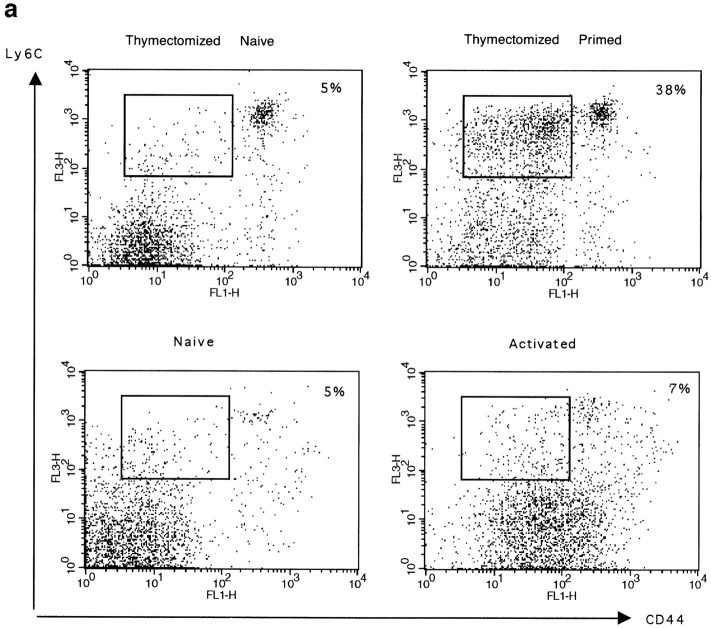
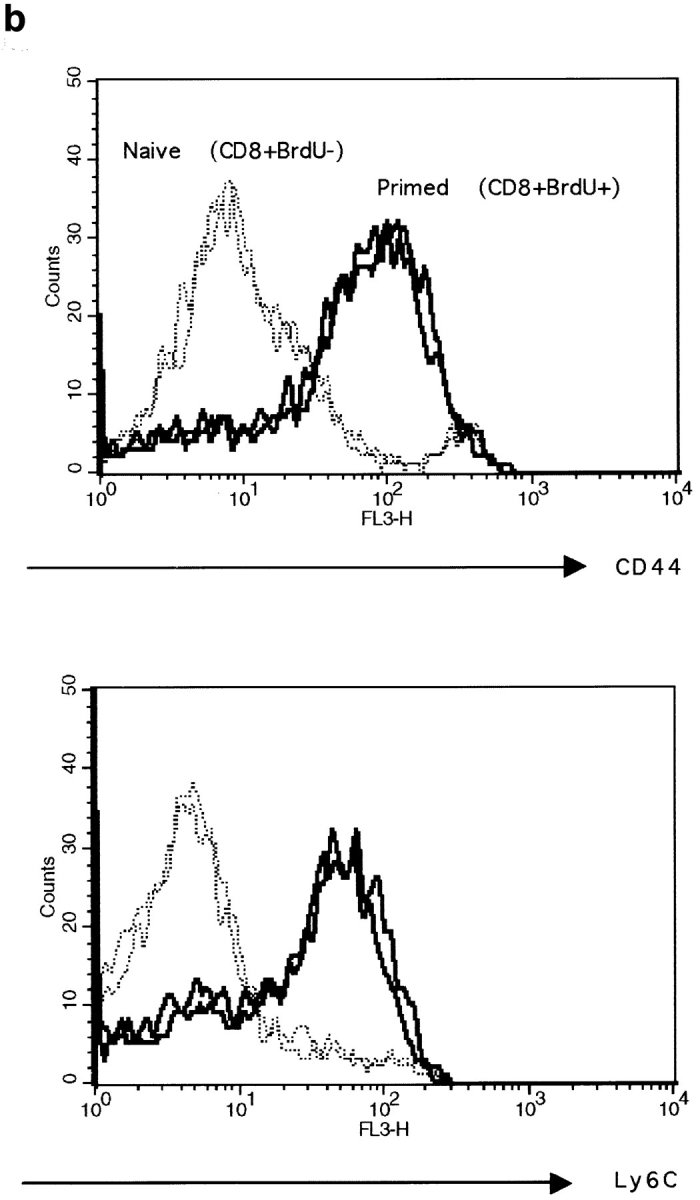
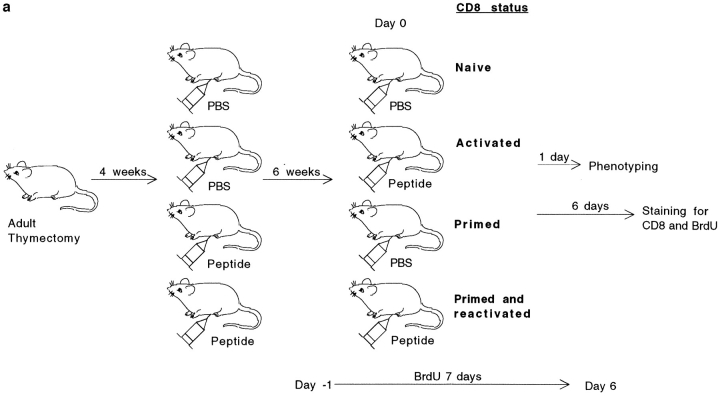
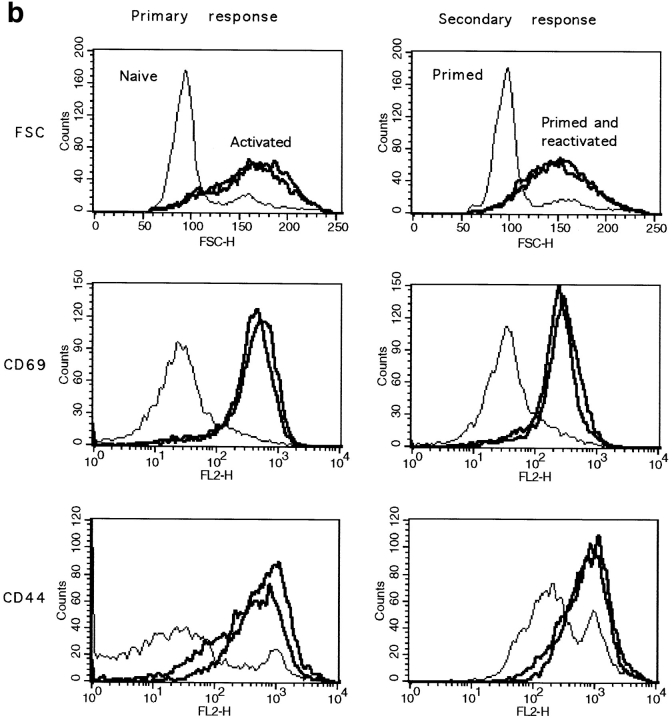
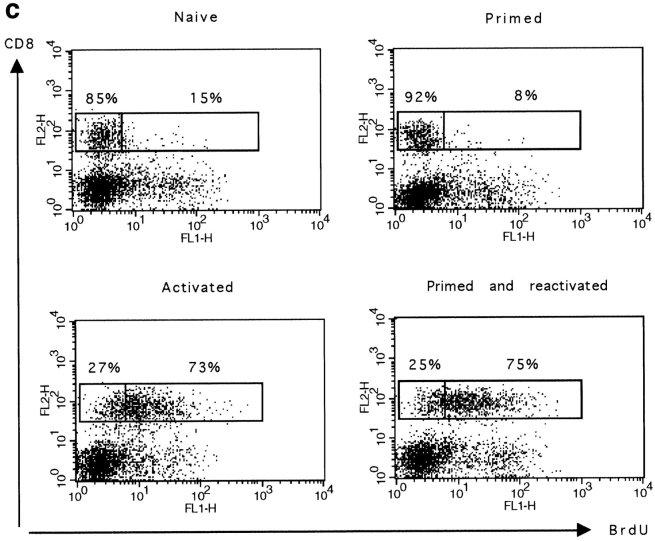
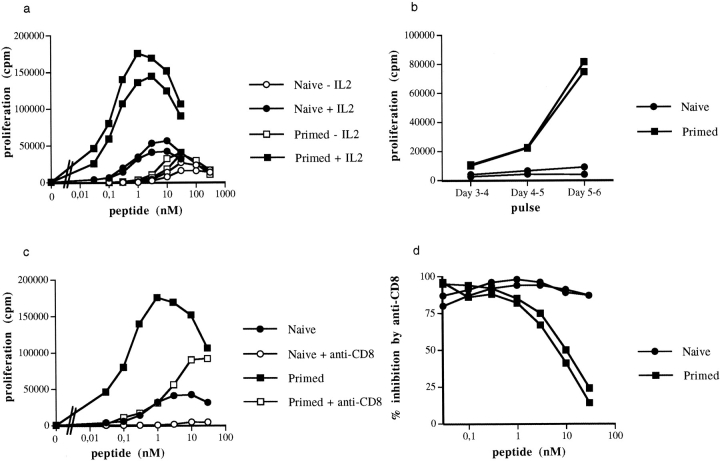
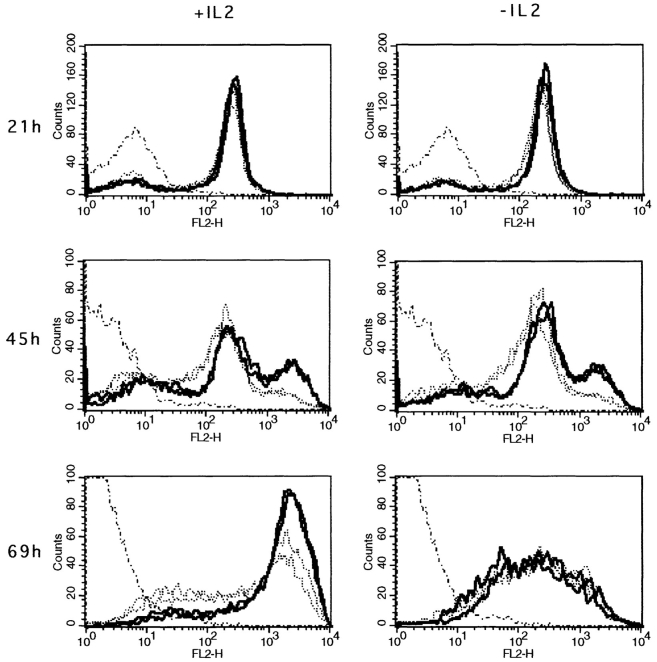
The characteristics of CD8+ T cells responsible for memory responses are still largely unknown. Particularly, it has not been determined whether different activation thresholds distinguish naive from memory CD8+ T cell populations. In most experimental systems, heterogeneous populations of primed CD8+ T cells can be identified in vivo after immunization. These cells differ in terms of cell cycle status, surface phenotype, and/or effector function. This heterogeneity has made it difficult to assess the activation threshold and the relative role of these subpopulations in memory responses. In this study we have used F5 T cell receptor transgenic mice to generate a homogeneous population of primed CD8+ T cells. In the F5 transgenic mice, peptide injection in vivo leads to activation of most peripheral CD8+ T cells. In vivo BrdU labeling has been used to follow primed T cells over time periods spanning several weeks after peptide immunization. Our results show that the majority of primed CD8+ T cells generated in this system are not cycling and express increased levels of CD44 and Ly6C. These cells remain responsive to secondary peptide challenge in vivo as evidenced by short term upregulation of activation markers such as CD69 and CD44. The activation thresholds of naive and primed CD8+ T cells were compared in vitro. We found that CD8+ T cells from primed mice are activated by peptide concentrations 10-50-fold lower than naive mice. In addition, the kinetics of interleukin 2R alpha chain upregulation by primed CD8+ T cells differ from naive CD8+ T cells. These primed hyperresponsive CD8+ T cells might play an important role in the memory response.


Figures

Figure 1
Figure 1
In vivo BrdU incorporation by transgenic CD8+ T cells after peptide stimulation. Thymectomized and euthymic mice were either immunized with 50 nmol peptide on day 0 (Activated) or received only PBS (Naive). BrdU was given in the drinking water for 4 d starting 1 d before peptide injection. 3 d after peptide challenge, spleen cells were double stained for BrdU and CD8 or triple stained for BrdU, CD8, and CD44. Results for one representative mouse are shown. The percentage of BrdU+ and BrdU CD8+ T cells is given in the first column. The total number (×106) of BrdU+CD8+ cells is given in brackets. The expression of CD44 by BrdU labeled cells is shown for gated CD8+ T cells. Results for one representative mouse out of two naive or four primed mice are shown.
Figure 2
Figure 2
Primed CD8+ T cells are long lived. The maintenance of BrdU labeled CD8 T cells was measured at different times after peptide stimulation and BrdU labeling. Thymectomized or euthymic mice were either immunized with 50 nmol peptide on day 0 (primed) or received only PBS (naive). BrdU was given in the drinking water for 5 d starting 1 d before peptide injection. Spleen cells were double stained for BrdU and CD8. Results for one representative mouse are shown. (a) The percentage of BrdU+ and BrdU CD8+ T cells in thymectomized and euthymic mice 21 d after peptide stimulation. (b) The percentage of BrdU+ and BrdU CD8+ T cells in euthymic mice 35 and 77 d after peptide priming. The total number (×106) of BrdU+CD8+ cells is given in brackets. Results for one representative mouse out of two naive or four primed mice are shown.
Figure 2
Figure 2
Primed CD8+ T cells are long lived. The maintenance of BrdU labeled CD8 T cells was measured at different times after peptide stimulation and BrdU labeling. Thymectomized or euthymic mice were either immunized with 50 nmol peptide on day 0 (primed) or received only PBS (naive). BrdU was given in the drinking water for 5 d starting 1 d before peptide injection. Spleen cells were double stained for BrdU and CD8. Results for one representative mouse are shown. (a) The percentage of BrdU+ and BrdU CD8+ T cells in thymectomized and euthymic mice 21 d after peptide stimulation. (b) The percentage of BrdU+ and BrdU CD8+ T cells in euthymic mice 35 and 77 d after peptide priming. The total number (×106) of BrdU+CD8+ cells is given in brackets. Results for one representative mouse out of two naive or four primed mice are shown.
Figure 3
Figure 3
Surface phenotype of primed, naive and recently activated CD8+ T cells. The expression of CD8, Vβ11, CD3, CD69, IL-2Rα, IL-2Rβ, IL-2Rγ, ICAM-1, LFA-1, CD45RA, CD45RB, l-selectin, Fas, and CD5 by naive, activated, or primed CD8 spleen cells was measured by double staining. Cells were gated for CD8+ at the acquisition level. Results for one representative mouse out of a minimum of four are shown. (a) CD8+ T cells (- - -) from naive thymectomized mice were compared with CD8+ T cells (—) from thymectomized mice primed 6 wk earlier. (b) CD8+ T cells from naive mice (- - -) were compared with recently activated CD8+ T cells (—). Expression of CD8, CD3, and Vβ11 was measured 3 d after peptide stimulation. All other markers were analyzed on day 1.
Figure 3
Figure 3
Surface phenotype of primed, naive and recently activated CD8+ T cells. The expression of CD8, Vβ11, CD3, CD69, IL-2Rα, IL-2Rβ, IL-2Rγ, ICAM-1, LFA-1, CD45RA, CD45RB, l-selectin, Fas, and CD5 by naive, activated, or primed CD8 spleen cells was measured by double staining. Cells were gated for CD8+ at the acquisition level. Results for one representative mouse out of a minimum of four are shown. (a) CD8+ T cells (- - -) from naive thymectomized mice were compared with CD8+ T cells (—) from thymectomized mice primed 6 wk earlier. (b) CD8+ T cells from naive mice (- - -) were compared with recently activated CD8+ T cells (—). Expression of CD8, CD3, and Vβ11 was measured 3 d after peptide stimulation. All other markers were analyzed on day 1.
Figure 4
Figure 4
Expression of Ly6C and CD44 by naive, activated, or primed CD8+ T cells. (a) Spleen cells from thymectomized mice primed 5 wk earlier or from naive thymectomized mice and from euthymic mice primed 1 d earlier (activated) or from naive euthymic mice (naive) were triple stained for CD44, Ly6C, and CD8. Cells were gated for CD8+ at the acquisition level. The expression of CD44 and Ly6C is shown. The percentage of CD8+ cells expressing intermediate levels of CD44 and intermediate to high levels of Ly6C is given. The total number (×106) of CD8+CD44intLy6Chigh cells is given in brackets. Results for one mouse out of a minimum of three are shown. (b) The expression of CD44 and Ly6C by BrdU+CD8+ T cells from primed euthymic mice (—) was measured 11 wk after peptide stimulation. The CD8+ BrdU T cells (- - -) from the same mice are shown as a control. CD8 cells were labeled with BrdU for 5 d starting 1 d before peptide stimulation. Cells were gated for CD8+BrdU or CD8+BrdU+ at the acquisition level. Results are shown for two mice per group.
Figure 4
Figure 4
Expression of Ly6C and CD44 by naive, activated, or primed CD8+ T cells. (a) Spleen cells from thymectomized mice primed 5 wk earlier or from naive thymectomized mice and from euthymic mice primed 1 d earlier (activated) or from naive euthymic mice (naive) were triple stained for CD44, Ly6C, and CD8. Cells were gated for CD8+ at the acquisition level. The expression of CD44 and Ly6C is shown. The percentage of CD8+ cells expressing intermediate levels of CD44 and intermediate to high levels of Ly6C is given. The total number (×106) of CD8+CD44intLy6Chigh cells is given in brackets. Results for one mouse out of a minimum of three are shown. (b) The expression of CD44 and Ly6C by BrdU+CD8+ T cells from primed euthymic mice (—) was measured 11 wk after peptide stimulation. The CD8+ BrdU T cells (- - -) from the same mice are shown as a control. CD8 cells were labeled with BrdU for 5 d starting 1 d before peptide stimulation. Cells were gated for CD8+BrdU or CD8+BrdU+ at the acquisition level. Results are shown for two mice per group.
Figure 5
Figure 5
In vivo primed CD8+ T cells are responsive to secondary challenge with peptide. (a) Experimental plan of the in vivo CD8+ T cells restimulation. (b) 1 d after peptide stimulation, spleen cells were double stained for CD8 and CD69 or CD8 and CD44. The cell size of CD8+ T cells as well as the expression of CD69 or CD44 by these cells are shown. Results for one naive and two primed mice are shown. (c) The percentage of CD8+ T cells proliferating in response to peptide challenge was measured by BrdU incorporation. Spleen cells were double stained for BrdU and CD8. The percentage of BrdU+ and BrdU CD8+ T cells is given. The total number (×106) of BrdU+CD8+ cells is given in brackets. Results for one representative mouse out of two are shown.
Figure 5
Figure 5
In vivo primed CD8+ T cells are responsive to secondary challenge with peptide. (a) Experimental plan of the in vivo CD8+ T cells restimulation. (b) 1 d after peptide stimulation, spleen cells were double stained for CD8 and CD69 or CD8 and CD44. The cell size of CD8+ T cells as well as the expression of CD69 or CD44 by these cells are shown. Results for one naive and two primed mice are shown. (c) The percentage of CD8+ T cells proliferating in response to peptide challenge was measured by BrdU incorporation. Spleen cells were double stained for BrdU and CD8. The percentage of BrdU+ and BrdU CD8+ T cells is given. The total number (×106) of BrdU+CD8+ cells is given in brackets. Results for one representative mouse out of two are shown.
Figure 6
Figure 6
In vitro proliferative responses of CD8 T cells from primed and naive thymectomized mice. (a) 5 × 10⁴ spleen cells were activated with different concentrations of peptide in the presence or absence of IL-2 as described in Materials and Methods. Cell proliferation was measured by [3H]thymidine uptake after 4 d in culture. Results for two mice per group are shown. The percentages of CD8+ T cells in the spleen of primed or naive mice were comparable, 23 and 17% versus 21 and 18%, respectively. This experiment was performed at least four times with similar results. (b) The proliferation rate of primed and naive CD8+ T cells was measured at different times after activation with 0.1 nM peptide in the presence of IL-2. (c and d) The activation of CD8+ T cells by different concentrations of peptide was inhibited by anti-CD8 mAb (1 μg/ml final concentration in the wells). Proliferation was measured after 4 d of culture. The proliferative response of one naive and one primed mouse in the presence or absence of anti-CD8 mAb is shown in c. The percentage inhibition in the presence of anti-CD8 antibodies was calculated for each dose of peptide from the following formula: ([proliferation in the absence of anti-CD8 − proliferation in the presence of anti-CD8]/proliferation in the absence of anti-CD8) ×100. The percentage inhibition for two naive and two primed mice is shown in d.
Figure 7
Figure 7
Expression of IL-2Rα on naive and primed CD8+ T cells after activation with peptide in vitro. 106 spleen cells were activated with 1 nM peptide in the presence or absence of 2.5% IL-2. Expression of IL-2Rα by CD8+ T cells was measured by double staining after 21, 45, or 69 h of stimulation. Cells were gated for CD8+ at the acquisition level. The results for two representative naive (. . . .) or primed mice (—) out of six are shown. Fresh resting CD8+ T cells from a naive mouse were used as a negative control (· –·  –·).

References

    1. Ahmed R, Gray D. Immunological memory and protective immunity: understanding their relation. Science (Wash DC) 1996;272:54–60. - PubMed
    1. McHeyzer-Williams MG, Davis MM. Antigenspecific development of primary and memory T cells in vivo. Science (Wash DC) 1995;268:106–111. - PubMed
    1. Horgan KJ, Van Seventer GA, Shimizu Y, Shaw S. Hyporesponsiveness of naive (CD45RA+) human T cells to multiple receptor-mediated stimuli but augmentation of responses by co-stimuli. Eur J Immunol. 1990;20:1111–1118. - PubMed
    1. Sanders ME, Makgoba MW, June CH, Young HA, Shaw S. Enhanced responsiveness of human memory T cells to CD2 and CD3 receptor-mediated activation. Eur J Immunol. 1989;19:803–808. - PubMed
    1. Kearney ER, Pape KA, Loh DY, Jenkins MK. Visualization of peptide-specific T cell immunity and peripheral tolerance induction in vivo. Immunity. 1994;1:327–339. - PubMed

MeSH terms