. 1996 Dec 1;184(6):2327-39.
doi: 10.1084/jem.184.6.2327.

Proliferation kinetics associated with T cell receptor-beta chain selection of fetal murine thymocytes

Affiliations

Proliferation kinetics associated with T cell receptor-beta chain selection of fetal murine thymocytes

I Falk et al. J Exp Med. .

Abstract

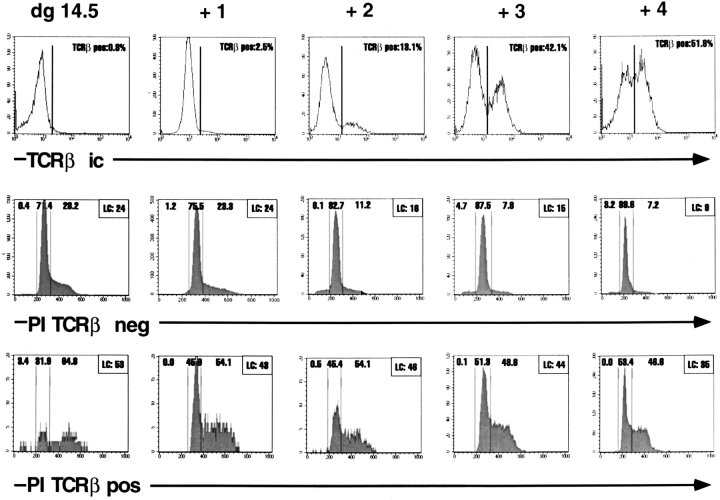
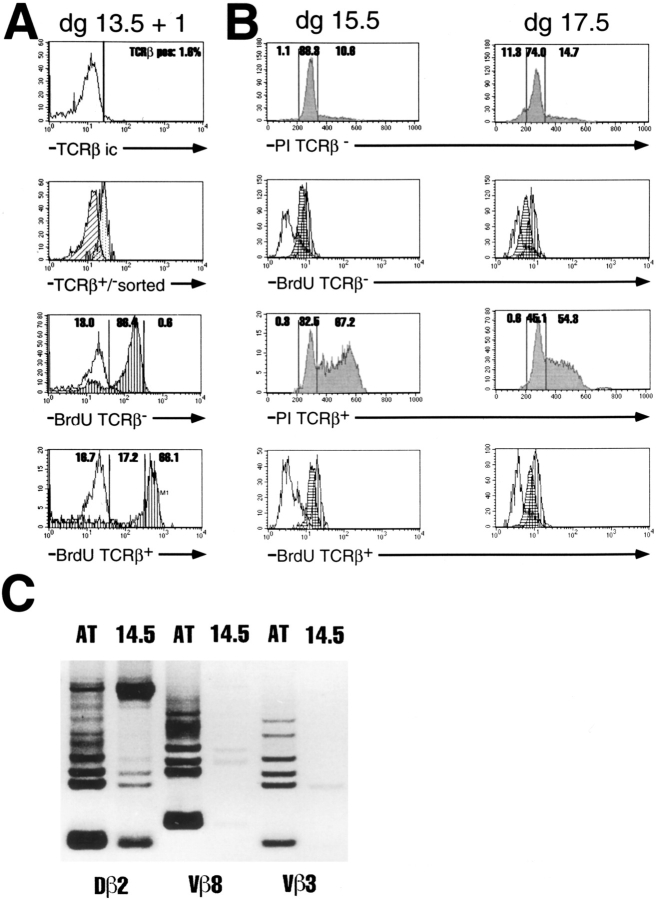
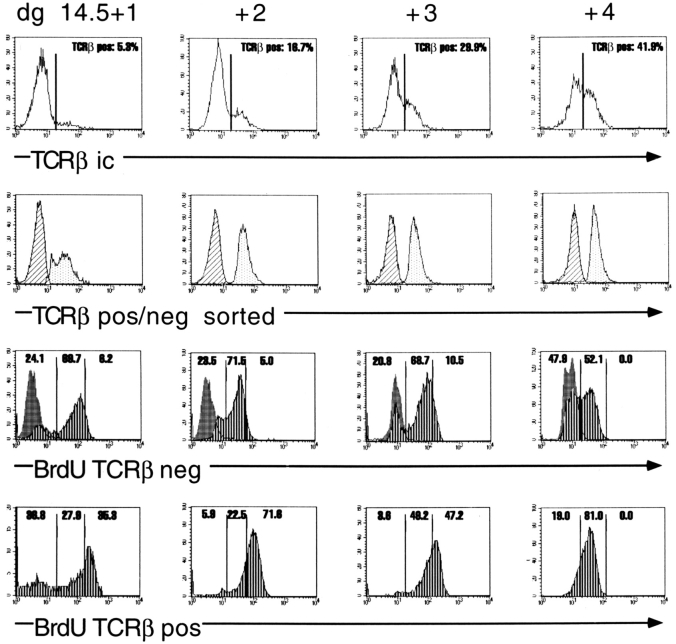
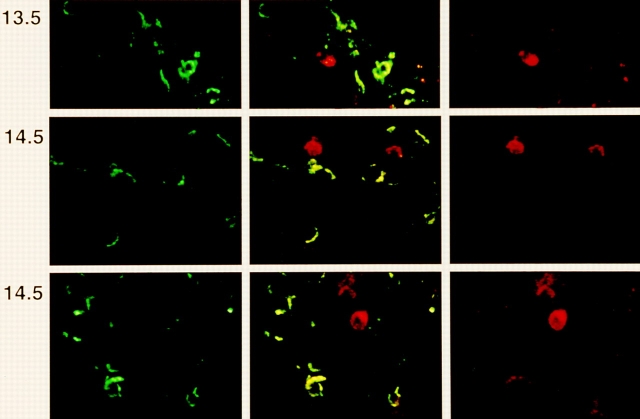
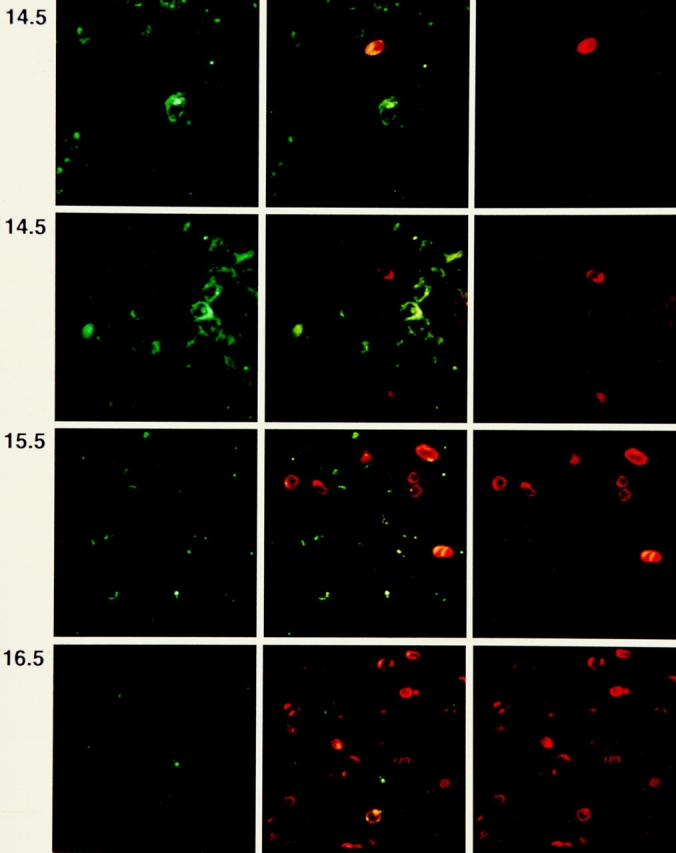
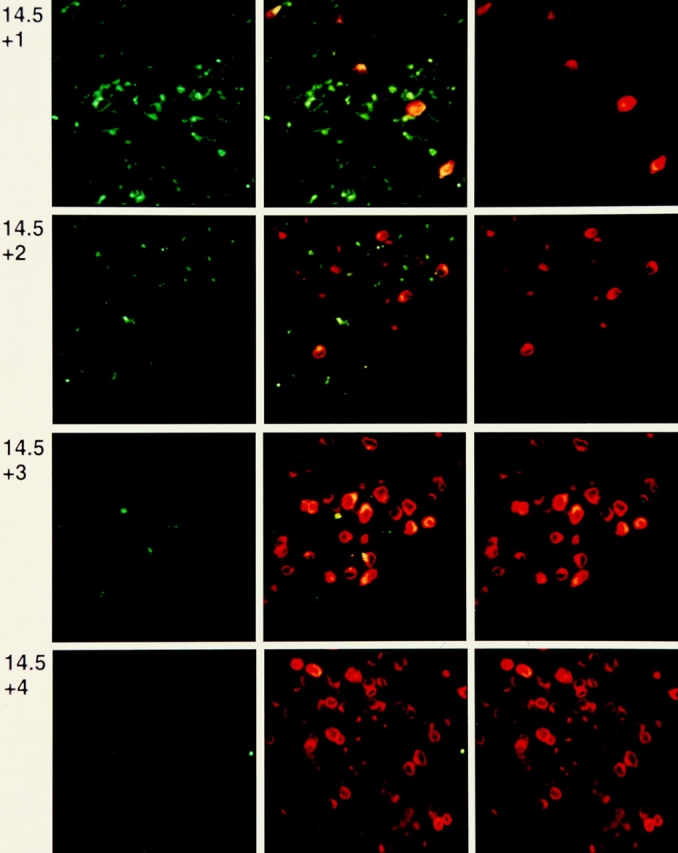
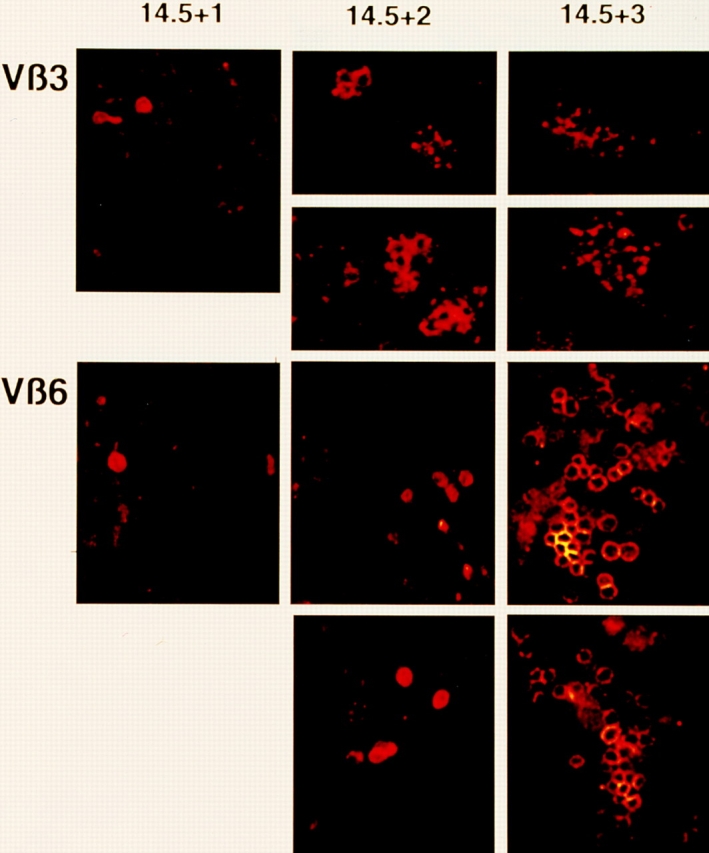
After productive rearrangement of a TCR beta chain gene, CD4-8- double negative (DN) thymocytes express TCR beta polypeptide chains on the cell surface together with pre-T alpha and the CD3 complex forming the pre-TCR. Signals transmitted through the pre-TCR select TCR beta + DN thymocytes for further maturation to the CD4+8+ double positive stage, whereas DN cells that fail to generate a productive TCR beta gene rearrangement do not continue in development. This process is termed TCR beta chain selection. Although it is likely that differences between proliferation dynamics of TCR beta + and TCR beta-cells may play a role, the exact mechanisms of TCR beta chain selection have not been elucidated. We therefore studied the proliferation dynamics of TCR beta + and TCR beta-thymocytes during fetal development, i.e., when TCR beta chain selection takes place for the first time. We analyzed in situ accumulation of TCR beta + thymocytes by confocal microscopy, and determined cell cycle and division parameters of TCR beta + and TCR beta-populations by flow cytometry. About 600 TCR beta + cells/thymic lobe are generated by independent induction events between days of gestation (dg) 13.5, and 15.5. As of dg 14.5, most TCR beta + cells have entered S/G2 phase of cell cycle, followed by seven to eight rapid cell divisions in fetal thymic organ culture, suggesting a corresponding burst of nine cell divisions within 4 d in vivo. By dg 18.5, the division rate of TCR beta + cells has slowed down to less than 1/d. About three quarters of TCR beta-cells divide at a slow rate of 1/d on dg 14.5, the proportion of nondividing cells increasing to 50% within the following four d. From dg 16.5 onwards, TCR beta-cells, but not TCR beta + cells, contain a significant proportion of apoptotic cells. The results suggest that failure to become selected results in shutdown of proliferation and eventual programmed cell death of fetal TCR beta-cells. Positive selection of fetal TCR beta + cells is achieved by an increased rate of cell divisions lasting for approximately 4 d.


Figures

Figure 5
Figure 5
Cell cycle analysis by PI staining of TCRβ+ and TCRβ thymocytes from fetal thymic lobes recovered from BALB/c fetuses at dg 14.5, and from dg 14.5 FTOC cultured for 1–4 d. Thymocytes were double stained for intracellular TCRβ (TCRβIC, top) and PI. The lower panels show the PI staining (shaded patterns) of cells gated positively or negatively for TCRβ. Percentages of TCRβ+ cells and of cells with hypodiploid, diploid, and hyperdiploid amounts of DNA are given in each frame. LC, percentage of large blastoid cells as determined by scatter parameters.
Figure 7
Figure 7
(A) BrdU incorporation into fetal thymic lobes recovered from BALB/c fetuses on dg 13.5 and kept in organ culture for 1 d. Experimental procedure and data representation essentially as in Fig. 6, except that the negative controls for BrdU staining are unmarked. (B) Triple analysis for TCRβ, BrdU incorporation, and PI staining of thymocytes recovered from dg 15.5 and 17.5 fetal thymic lobes of pregnant BALB/c mothers injected 18 h earlier with BrdU. IC TCRβ staining and sorting not shown. Sorted TCRβ+ and TCRβ cells were double stained with PI (top, shaded patterns) and for BrdU incorporation (bottom). BrdU incorporation is shown separately for cells with diploid (horizontal stripes) and hyperdiploid (vertical stripes) PI staining. The small difference in BrdU intensity between the two populations is not significant, as there is some spillover of PI fluorescence into the FITC chanel. Negative controls (unmarked patterns) are as described in Fig. 6. (C) Analysis of TCRβ locus DJ and VDJ rearrangements by PCR in dg 14.5 fetal thymocytes (14.5), and in adult thymus (AT). Ethidium bromide–stained gel shown, inversely photographed. The six fragments seen with 5′Vβ8 and 5′Vβ3 primers correspond, from top to bottom, from VDβ2Jβ2.1 to VDβ2Jβ2.6 rearrangements. The additional fragment at the top of the Dβ2 to Jβ2 rearrangements represents the germline configuration.
Figure 6
Figure 6
BrdU incorporation in fetal thymic lobes recovered from BALB/c fetuses on dg 14.5 and kept in organ culture for 1–4 d. BrdU was added to the culture medium 18 h before termination of culture. Thymocytes were stained for TCRβ (upper panels, percentages of TCRβ+ cells indicated), sorted into TCRβ and TCRβ+ cells (second panels, cross-hatched and dotted patterns, respectively), and analyzed for BrdU incorporation (third and fourth panels). Note the three levels of BrdU staining (vertical stripes). Percentages of BrdU negative cells and of partially and completely BrdU-labeled cells indicated in each frame. Negative controls (shaded) used thymocytes recovered from thymic lobes cultured without BrdU, and then incubated with BrdU for 30 min on ice, washed, and subjected to the antiBrdU staining procedure.
Figure 1
Figure 1
Confocal laser scanning microscopy of fetal thymic lobes recovered from BALB/c fetuses on dg 13.5 and 14.5. Two examples of dg 14.5 are shown. Left, Staining with FITC labeled anti-CD44; right, PE-labeled anti-panTCRβ; center, two color representation. Horizontal side length of one field is 100 μm.
Figure 2
Figure 2
Confocal laser scanning microscopy of fetal thymic lobes recovered from BALB/c fetuses on dg 14.5, 15.5, and 16.5. Two examples of dg 14.5 are shown. Left, staining with FITC-labeled mAb to CD25; right, PE-labeled anti-panTCRβ mAb; center, two color representation. Note that the TCRβ+ cell in the upper example of dg 14.5 is CD25low, and in the lower example is CD25. The side length of one square field is 100 μm.
Figure 3
Figure 3
Confocal laser scanning microscopy of fetal thymic lobes recovered from BALB/c fetuses at dg 14.5 and kept in organ culture for 1–4 d. Left, FITC-labeled anti-CD25; right, PE-labeled anti-panTCRβ; center, two color representation. The side length of one square field is 100 μm.
Figure 4
Figure 4
Confocal laser scanning microscopy of fetal thymic lobes obtained from BALB/c fetuses on dg 14.5 and kept in organ culture for 1–3 d. PE-labeled anti-Vβ3 and anti-Vβ6 mAb used for staining, as indicated. For each cluster, a single optical section is shown. The total number of cells/cluster is usually considerably larger than the number of cells seen in the sections shown ( see Table 2).

References

    1. Godfrey DI, Zlotnik A. Control points in early T-cell development. Immunol Today. 1993;14:547–554. - PubMed
    1. Robey E, Fowlkes BJ. Selective events in T cell development. Ann Rev Immunol. 1994;12:675–705. - PubMed
    1. Groettrup M, Ungewiss K, Azogui O, Palacios R, Owen MJ, Hayday AC, von Boehmer H. A novel disulphide-linked heterodimer on pre–T cells consists of the T cell receptor β chain and a 33 kD glycoprotein. Cell. 1993;75:283–294. - PubMed
    1. Saint-Ruf C, Ungewiss K, Groettrup M, Bruno L, Fehling HL, von Boehmer H. Analysis and expression of a pre-T cell receptor gene. Science (Wash DC) 1994;266:1208–1212. - PubMed
    1. Groettrup M, von Boehmer H. Role for a pre–T cell receptor in T cell development. Immunol Today. 1993;14:610–614. - PubMed

Substances