Comparative Study
. 1996 Dec 24;93(26):15081-5.
doi: 10.1073/pnas.93.26.15081.

Architectural limits on split genes

Affiliations
Comparative Study

Architectural limits on split genes

D A Sterner et al. Proc Natl Acad Sci U S A. .

Abstract

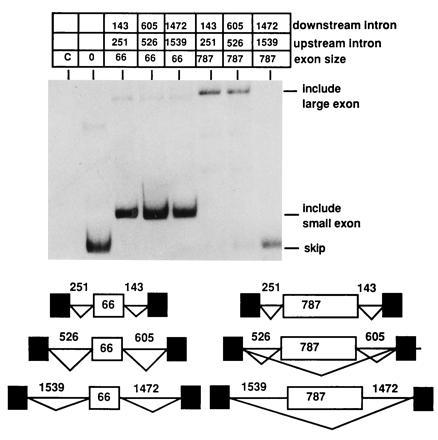
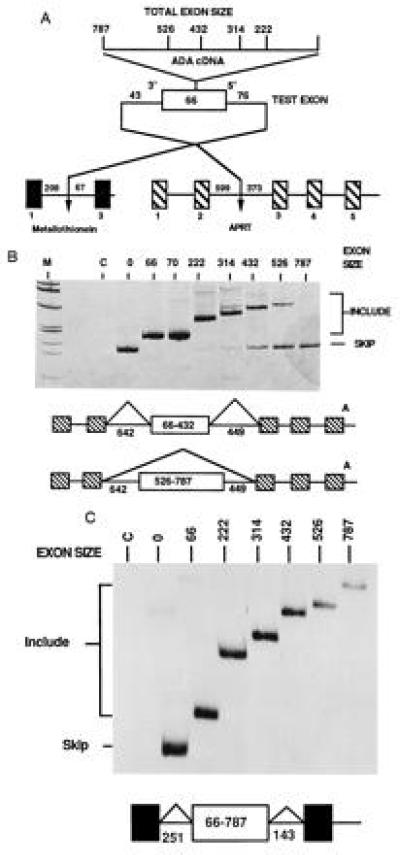
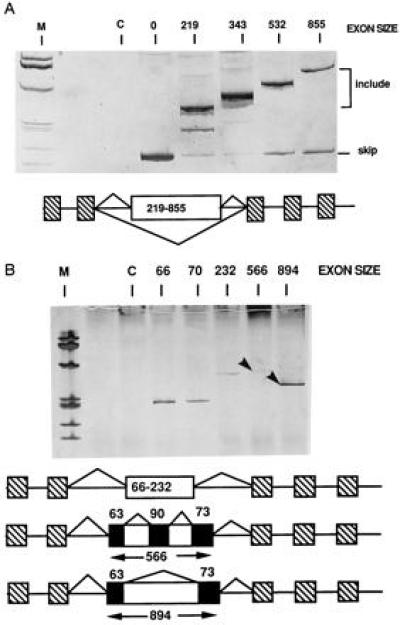
Exon/intron architecture varies across the eukaryotic kingdom with large introns and small exons the rule in vertebrates and the opposite in lower eukaryotes. To investigate the relationship between exon and intron size in pre-mRNA processing, internally expanded exons were placed in vertebrate genes with small and large introns. Both exon and intron size influenced splicing phenotype. Intron size dictated if large exons were efficiently recognized. When introns were large, large exons were skipped; when introns were small, the same large exons were included. Thus, large exons were incompatible for splicing if and only if they were flanked by large introns. Both intron and exon size became problematic at approximately 500 nt, although both exon and intron sequence influenced the size at which exons and introns failed to be recognized. These results indicate that present-day gene architecture reflects at least in part limitations on exon recognition. Furthermore, these results strengthen models that invoke pairing of splice sites during recognition of pre-mRNAs, and suggest that vertebrate consensus sequences support pairing across either introns or exons.


Figures

Figure 2
Figure 2
Expanding small introns flanking a large exon causes exon skipping. The MT constructs shown in Fig. 1C containing either the natural 66-nt second exon from MT or the 787-nt internally expanded second exon were altered to increase the lengths of both introns. Intron lengths in the final constructs are indicated. RNA splicing phenotypes were determined by RT-PCR as described in Fig. 1 using radiolabeled PCR primers. Products resulting from skipping of the middle exon or inclusion of either the small or large internal exon are indicated.
Figure 1
Figure 1
Large internal exons have different splicing phenotypes when placed in different genes. (A) Structure of the genes used to test exon size limits. Exon expansion cassettes derived from cDNAs were used to expand the natural second exon of mouse MT II which was then placed into test genes. (B) In vivo splicing phenotypes of expanded exons containing an expansion cassette from ADA cDNA within the CHO APRT gene. The hatched exons are from the resident APRT gene, the white exon is the expanded exon 2 from MT. Splicing phenotypes were determined by RT-PCR analysis of total cell RNA. To emphasize visualization of RNAs resulting from exon inclusion, the amplification products were detected by silver staining; therefore, an equal intensity of skipping to inclusion products with exons of 400–800 nt represents a strong bias toward skipping. Lanes C and 0 indicate amplification of RNA from nontransfected cells and the parental APRT gene, respectively. (C) In vivo splicing phenotypes of the same expanded exons tested within the MT gene. The gel shown is an autoradiogram of an amplification reaction using labeled PCR primers. The results shown are from transfection of CHO cells; a similar result was observed when the recipient cells were NIH 3T3 cells.
Figure 3
Figure 3
Exon sequence influences splicing phenotype. APRT genes containing an expanded MT exon similar to those described in Fig. 1A were created in which the exon expansion cassette was derived from either chicken OVA (A) or human HPRT (B) cDNAs. RNA splicing phenotypes were determined by RT-PCR as described in Fig. 1. Products resulting from skipping or inclusion of the middle exon are indicated. The unexpected products in B from the constructs with middle exons of 556 or 894 nt are indicated with an arrow and were sequenced. The splicing patterns as determined from sequencing data are depicted below the figure. Both gels were silver-stained to visually emphasize inclusion products. The cryptic spliced transcripts produced in B are denoted with an arrow.

References

    1. Hawkins J D. Nucleic Acids Res. 1988;16:9893–9908. - PMC - PubMed
    1. Moore M J, Query C C, Sharp P A. In: RNA World. Gesteland R F, Atkins J F, editors. Plainview, NY: Cold Spring Harbor Lab. Press; 1993. pp. 305–358.
    1. Ruby S, Abelson J. Trends Genet. 1991;7:79–85. - PubMed
    1. Guthrie C. Science. 1991;253:157–163. - PubMed
    1. Berget S M. J Biol Chem. 1995;270:2411–2414. - PubMed

Publication types

MeSH terms