. 1996 Dec 24;93(26):15114-8.
doi: 10.1073/pnas.93.26.15114.

Determination of the lifetime and force dependence of interactions of single bonds between surface-attached CD2 and CD48 adhesion molecules

Affiliations

Determination of the lifetime and force dependence of interactions of single bonds between surface-attached CD2 and CD48 adhesion molecules

A Pierres et al. Proc Natl Acad Sci U S A. .

Abstract

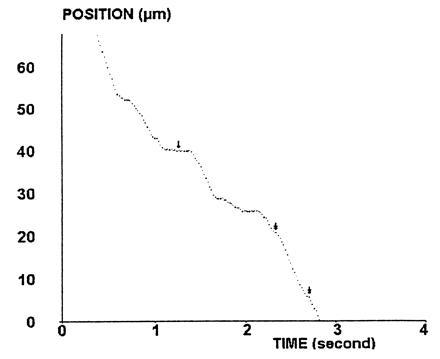
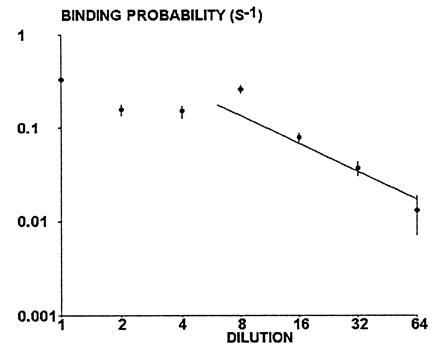
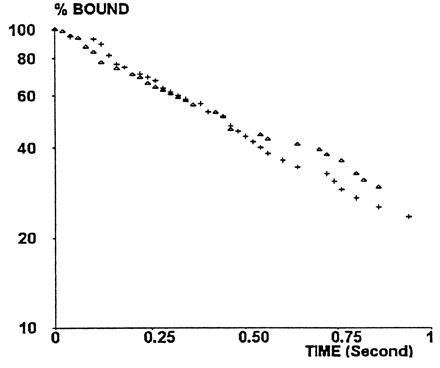
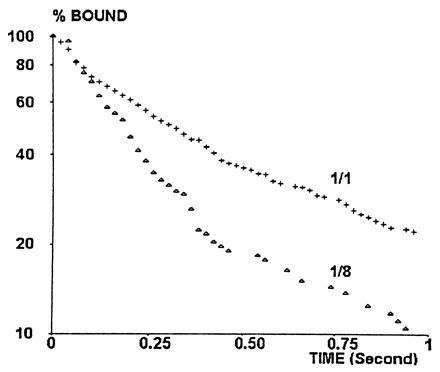
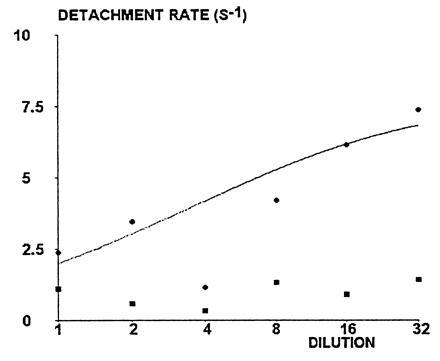
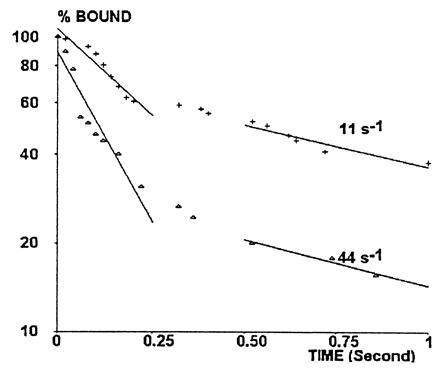
We studied single molecular interactions between surface-attached rat CD2, a T-lymphocyte adhesion receptor, and CD48, a CD2 ligand found on antigen-presenting cells. Spherical particles were coated with decreasing densities of CD48-CD4 chimeric molecules then driven along CD2-derivatized glass surfaces under a low hydrodynamic shear rate. Particles exhibited multiple arrests of varying duration. By analyzing the dependence of arrest frequency and duration on the surface density of CD48 sites, it was concluded that (i) arrests were generated by single molecular bonds and (ii) the initial bond dissociation rate was about 7.8 s-1. The force exerted on bonds was increased from about 11 to 22 pN; the detachment rate exhibited a twofold increase. These results agree with and extend studies on the CD2-CD48 interaction by surface plasmon resonance technology, which yielded an affinity constant of approximately 10(4) M-1 and a dissociation rate of > or = 6 s-1. It is concluded that the flow chamber technology can be an useful complement to atomic force microscopy for studying interactions between isolated biomolecules, with a resolution of about 20 ms and sensitivity of a few piconewtons. Further, this technology might be extended to actual cells.


Figures

Figure 1
Figure 1
Typical trajectory. The position of a CD48-coated bead driven along a CD2-derivatized surface by a wall shear rate of 22 s−1 is shown. Periods of regular motion with constant velocity (of order of 20 μm/s) are interspersed by arrests of variable duration ranging from a few tens of milliseconds (double arrows) to several hundreds of milliseconds (simple arrow) or more (not shown).
Figure 2
Figure 2
Dependence of binding probability on binding site density. Beads were coated with various densities of CD48 sites and driven along CD2-derivatized surfaces with a wall shear rate of 22 s−1. The binding probability was calculated as the mean number of detectable arrests per second of observation. Each point represents between 32 and 115 arrests, determined on hundreds of beads for each concentration. Each vertical bar represents twice the theoretical standard error calculated as explained. The straight line is a regression line determined on the five highest dilutions. The slope is 0.989 and the correlation coefficient is 0.919.
Figure 3
Figure 3
Dependence of the detachment rate on the criteria used for defining arrests. In a representative experiment (with a wall shear rate of 22 s−1), particles were defined as arrested if they moved by less than 0.34 μm during an interval of 60 ms (▵) or 120 ms (+). Distributions of arrest durations were fairly similar.
Figure 4
Figure 4
Typical detachment curves. The percent of particles remaining bound at time t after an arrest at time zero was plotted versus t on a semilogarithmic scale. The wall shear rate was 22 s−1. Site dilution was 1/1 (+, 115 arrests) or 1/8 (▵, 94 arrests). Typically, lines were fairly linear during the first 0.25 s, a significant curvature occurred between 0.25 and 0.5 s, and fairly linear aspect was again found during the next 0.5 s.
Figure 5
Figure 5
Effect of site dilution on detachment rate. Wall shear rate was 22 s−1. Circles represent the initial detachment rate. The solid line represents a theoretical plot of detachment rate versus dilution. The theoretical detachment rate was defined as the first decay constant of binding probability [i.e., as shown in Eq. 7, (r + 3 - δ)k/2]; this was calculated assuming that k was independent of dilution, whereas k+ was inversely proportional to the dilution factor. Fitted values of unknown parameters were k+ = 39.6 s−1 and k = 7.8 s−1. Squares represent the mean detachment rate between 0.5 and 1 s after arrest.
Figure 6
Figure 6
Effect of wall shear rate on detachment rate. Bead motion was followed with a wall shear rate of 11 s−1 (+) or 44 s−1 (▵) with maximum site density. Detachment curves were constructed as described above (see legend of Fig. 4).

References

    1. Tha S P, Shuster J, Goldsmith H L. Biophys J. 1986;50:1117–1126. - PMC - PubMed
    1. Evans E, Berk D, Leung A. Biophys J. 1991;59:838–848. - PMC - PubMed
    1. Tees D F, Coenen O, Goldsmith H L. Biophys J. 1993;65:1318–1334. - PMC - PubMed
    1. Pierres A, Benoliel A M, Bongrand P. In: Cell Mechanics and Cellular Engineering. Mow V C, Guilak F, Tran-Son-Tay R, Hochmuth R, editors. New York: Springer; 1994. pp. 145–159.
    1. Alon R, Hammer D A, Springer T. Nature (London) 1995;374:539–542. - PubMed

Publication types