. 1997 Jan 1;17(1):32-44.
doi: 10.1523/JNEUROSCI.17-01-00032.1997.

A novel subunit for shal K+ channels radically alters activation and inactivation

Affiliations

A novel subunit for shal K+ channels radically alters activation and inactivation

T Jegla et al. J Neurosci. .

Abstract

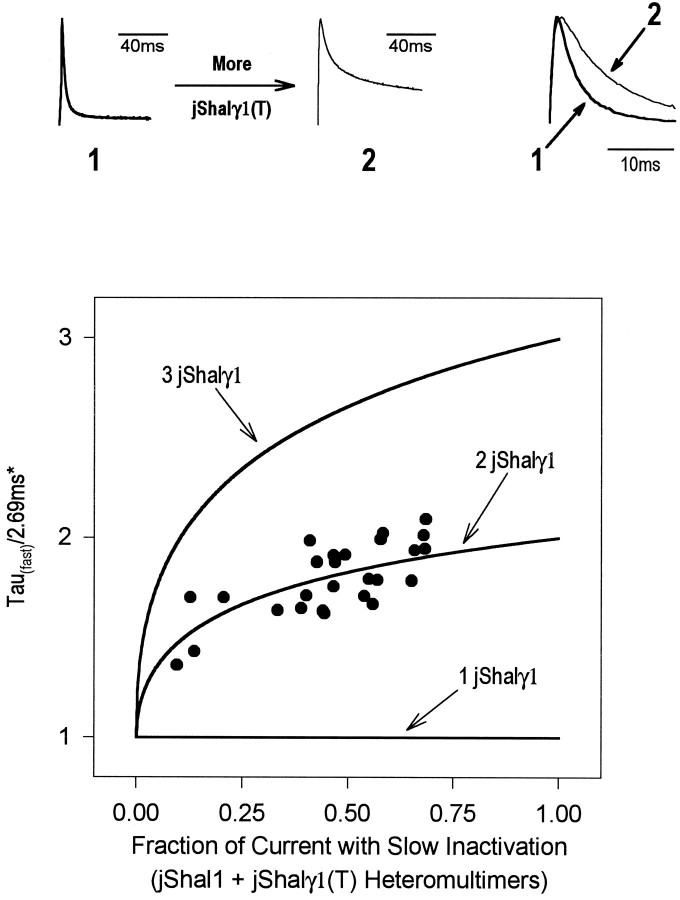
Shal (Kv4) potassium channel genes encode classical subthreshold A-currents, and their regulation may be a key factor in determining neuronal firing frequency. The inactivation rate of Shal channels is increased by a presently unidentified class of proteins in both Drosophila and mammals. We have cloned a novel Shal channel subunit (jShalgamma1) from the jellyfish Polyorchis penicillatus that alters Shal currents from both invertebrates and vertebrates. When co-expressed with the conserved jellyfish Shal homolog jShal1, jShalgamma1 dramatically changes both the rate of inactivation and voltage range of activation and steady-state inactivation. jShalgamma1 provides fast inactivation by a classic N-type mechanism, which is independent of its effects on voltage dependence. jShalgamma1 forms functional channels only as a heteromultimer, and jShalgamma1 + jShal1 heteromultimers are functional only in a 2:2 subunit stoichiometry.


Figures

Fig. 1.
Fig. 1.
jShal1 and jShalγ1 amino acid sequences. Jellyfish Shal homologs jShal1 and jShalγ1 are compared with Shal channels from Drosophila (dShal; Wei et al., 1990) and mouse (mShal, Kv4.1; Pak et al., 1991). Identical residues are shown in reversed lettering (white on black). Predicted transmembrane domains (S1–S6) and a K+ channel pore motif (P-domain; Hartmann et al., 1991; Yool and Schwarz, 1991) areunderlined. Also underlined is the cytoplasmic N-terminal domain (T1), which is believed to mediate subfamily-specific assembly of voltage-gated K+ channel subunits (Li et al., 1992; Shen et al., 1993; Shen and Pfaffinger, 1995). Large italic letters and plus symbols mark five evenly spaced positively charged residues found in S4 voltage sensor (Papazian et al., 1991) and seven positively charged residues near the N terminal of jShalγ1 that are part of a motif similar to N-terminal inactivation ball motifs (Murrell-Lagnado and Aldrich, 1993). The positions of two introns conserved in jShal1, dShal, and mShal are marked with arrows. Of these two, only the intron position in the P-domain motif is also found in jShalγ1. A third jShalγ1-specific intron near S6 is labeled with anarrow bracketed by asterisks. Residue numbers are shown on the right. Asterisksby the residue numbers at the end of the dShal and mShal sequences indicate that they are incomplete. The GenBank accession numbers forjShal1 and jShalγ1 are U78642 andU78641, respectively.
Fig. 2.
Fig. 2.
Phylogenetic analysis places jShal1 and jShalγ1 in the Shal subfamily. A consensus maximum parsimony tree of jShal1, jShalγ1, and 15 voltage-gated K+ channel genes representing the Shaker, Shab, Shal, and Shaw subfamilies is derived from the 18 most parsimonious trees found in a heuristic search. Numbers indicate the percentage of times a particular branch point was observed in these trees. For the unresolved branchings seen in the Shaker subfamily, no single pattern was observed in >50% of the trees from which the consensus is derived. Branches defining each subfamily are bracketed at the right edge of the figure. Shaker homologs are from rat (rKv1.1, X12589; Baumann et al., 1988), Drosophila (dShak, M17211; Papazian et al., 1987), Aplysia (aShak, M95914; Pfaffinger et al., 1991), a platyhelminth (pShak, L26968; Kim et al., 1995), and the jellyfish Polyorchis (jShak1 and jShak2, U32922 and U32923; Jegla et al., 1995). Shab subfamily members are from rat [rKv2.1, X16476, Frech et al. (1989); IK8 and K13, M81783 and M81784,Drewe et al. (1992)], Drosophila (dShab, M32659, Butler et al., 1989), and Aplysia (aShab, S68356, Quattrocki et al., 1994). The Shaw subfamily is represented by rKv3.1 [rat, M68880,Rettig et al. (1992)] and dShaw [Drosophila, M32661,Butler et al. (1989)]. The Shal subfamily includes sequences from mouse [mKv4.1, M64226, Pak et al. (1991)] andDrosophila [dShal, M32660, Wei et al. (1990)] as well as jShal1 and jShalγ1.
Fig. 7.
Fig. 7.
jShal1 and jShalγ1 form functional channels in a single stoichiometry. 1 and 2 show current traces (normalized in amplitude) for oocytes expressing jShal1 + jShalγ1 in a jShalγ1-biased mix (1) or a jShal1-biased mix (2). The large, slowly inactivating component in 2 has the properties of a jShal1 homomultimer current. On the right, the fast-inactivating components of 1 and 2have been normalized to the same amplitude and plotted together, showing nearly identical inactivation rates. The graph shows a plot of the fast-inactivation time constant versus fraction of the total current with slow inactivation (jShal1 homomultimeric current) for individual experiments in which oocytes were injected with varying ratios of jShal1 and jShalγ1 (solid circles). The time constants are normalized to the mean fast-inactivation time constant calculated from the leftmost group of data points (2.69 msec), representing jShalγ1-biased mixes in which virtually no slowly inactivating current is seen. Inactivation rate was not increased by further biasing the ratio toward jShalγ1. The straight line (Fixed Stoichiometry) indicates the predicted relationship between the fast-inactivation time constant and the fraction of current with slow inactivation if only a single stoichiometry of heteromultimer is functional. The curve(Free Mixing) represents the prediction of fast-inactivation time constant if jShal1 and jShalγ1 form functional channels in all possible stoichiometries.
Fig. 8.
Fig. 8.
Functional jShal1–jShalγ1 heteromultimers have a 2:2 stoichiometry. 1 and 2 show currents (normalized in amplitude) from an oocyte expressing only jShal1 + jShalγ1 (1) and an oocyte expressing jShal1 + jShalγ1 + jShalγ1(T) (2) [jShalγ1 and jShalγ1(T) are in a 1:1 ratio]. The slowly inactivating current fraction is almost completely produced by jShal1 + jShalγ1(T) heteromultimers. jShal1 homomultimers contribute little to this slow current, because cRNA mixes were biased toward jShalγ1 + jShalγ1(T). Therefore, the inactivation time constants and steady-state inactivation curves for slowly inactivating fractions closely matched the inactivation time constants of jShal1 + jShalγ1(T) heteromultimers. The traces on the rightshow a comparison of the fast-inactivating fractions of1 and 2 normalized to the same amplitude. This shows that adding jShalγ1(T) slows N-type inactivation. The graph shows predictions of the fast-inactivation time constant versus fraction of slowly inactivating current, in which the functional heteromultimeric channels contain either 1, 2, or 3 jShalγ1-based-subunits. Solid circles represent data from individual experiments; the fit assumes two jShalγ1-subunits in the functional heteromultimers.
Fig. 3.
Fig. 3.
Comparison of the jShal1 and dShal currents. Families of outward currents are shown for Xenopusoocytes expressing either jShal1 (A) or dShal (B). Currents were recorded in response to 1 sec test pulses from −90 mV to +50 mV in 20 mV increments. Five second prepulses to −140 mV (from a holding potential of −90 mV) preceded each test pulse to ensure complete recovery from inactivation.C, Conductance versus voltage curves are shown for jShal1 (solid circles) and dShal (open circles). Error bars indicate SEM, and solid curves represent Boltzmann fits of the data (G/Gmax = 1/(1 + exp(− (VV50)/a), whereG is the conductance at voltage V,Gmax is the maximal conductance,V50 is the voltage at whichG = 0.5 × Gmax, and a is the slope factor. D, Steady-state inactivation curves for jShal1 and dShal. Currents were obtained by measuring the peak current during test pulses to +40 mV, after 10 sec prepulses to the voltage shown on thex-axis. Holding potentials were −90 mV with 5 sec prepulses to −140 mV preceding test pulses. The curvesrepresent best fits of the data to the Boltzmann functionI/Imax = 1/(1 + exp((VV50)/a), whereI is the peak current measured during the test pulse after a prepulse to voltage V,Imax is the maximal current measured,V50 is the prepulse voltage at whichI = 0.5 × Imax, anda is the slope factor.
Fig. 4.
Fig. 4.
jShalγ1 modifies the inactivation and activation range of jShal1. A, Currents recorded from aXenopus oocyte expressing only jShalγ1. Test pulses (400 msec) from −70 mV to +50 mV were as described in Figure3A. B, Rapidly inactivating outward currents recorded from an oocyte co-expressing jShalγ1 and jShal1. The same voltage protocol was used, except that test pulses were 100 msec in duration. The thin dotted line is a jShal1 homomultimeric current (+50 mV) scaled to the same amplitude for comparison of inactivation rate. C, Conductance versus voltage curves for jShal1 homomultimers (solid circles), dShal homomultimers (open circles), and jShal1 + jShalγ1 heteromultimers (solid triangles).D, Steady-state inactivation curves for jShal1, dShal, and jShal1 + jShalγ1 co-injection. Data collection, analysis, and curve fitting for C and D are as in Figure 3, C and D.
Fig. 5.
Fig. 5.
jShalγ1 confers rapid inactivation by an N-type mechanism. An N-terminal truncated form of jShalγ1, jShalγ1(T), was constructed by replacing the N-terminal amino acids MYSVTSTATYFLTRKVKNRHRTNVTRNKwith an initiator Met. Seven positively charge residues (bold) that distinguish jShalγ1 from Shal α-subunits were removed. A, Current traces from oocytes expressing jShal1, or jShal1 + jShalγ1, or jShal1 + jShalγ1(T) recorded in response to depolarizations to +50 mV. Traces are scaled to the same amplitude for comparison of inactivation rate. B, Conductance voltage curves for jShal1 (solid circles), jShal1 + jShalγ1 (solid triangles), and jShal1 + jShalγ1(T) (open triangles). C, Steady-state inactivation curves for jShal1, jShal1 + jShalγ1, and jShal1 + jShalγ1(T). D, Time course of recovery from inactivation for jShal1, jShal1 + jShalγ1, and jShal1 + jShalγ1(T). Recovery rates were determined by a double-pulse protocol in which test pulses to +40 mV were separated by a recovery pulse of increasing duration. Recovery was at either −100 mV or −120 mV (jShal1). Because the recovery rate of all Shal channels increases with increasing hyperpolarization (T. Jegla and L. Salkoff, unpublished observations), the difference in recovery rate between jShalγ1(T) heteromultimers and jShal1 homomultimers at an identical voltage is likely to be even greater than the difference we show here. Pulse series were preceded by 5 sec prepulses to −140 mV to ensure complete recovery from inactivation. Test pulse durations were 1 sec for jShal1 and jShal1 + jShalγ1(T) and 200 msec for jShal1 + jShalγ1. Curves were generated using the equationIt = {a × (1 − exp(−t/τ1))} + {b × (1 − exp(−t/τ2))}, whereIt is the current amplitude of the second +40 mV pulse divided by the current amplitude of the first pulse,t is the interval of the recovery step at −100 mV, anda and b are the components of current recovering exponentially with time constants of τ1 and τ2, respectively.
Fig. 6.
Fig. 6.
Heteromultimerization of jShalγ1 with dShal and mShal. A, Current traces recorded in response to a test pulse to +50 mV for Xenopus oocytes expressing dShal, dShal + jShalγ1, and dShal + jShalγ1(T) are shown normalized in amplitude for comparison of inactivation rates. B, Similar traces for oocytes expressing mShal, mShal + jShalγ1, and mShal + jShalγ1(T). C, Comparison of currents produced by co-expression of jShalγ1 + jShal1, jShalγ1 + dShal, and jShalγ1 + mShal. Although jShalγ1(T) appears to have opposite effects on the inactivation rates of dShal and mShal relative to jShal1 (Fig. 5A), the absolute inactivation rates of all three heteromultimers are actually quite similar.

References

    1. Anderson PAV. Ionic basis of action potentials and bursting activity in the hydromedusan jellyfish Polyorchis penicillatus. J Exp Biol. 1979;78:299–302.
    1. Anderson PAV, McKay MC. The electrophysiology of cnidocytes. J Exp Biol. 1987;133:215–230.
    1. Anderson PAV, Holman MA, Greenberg RM. Deduced amino acid sequence of a putative sodium channel from the scyphozoan jellyfish Cyanea capillata. Proc Natl Acad Sci USA. 1993;90:7419–7423. - PMC - PubMed
    1. Baumann A, Grupe A, Ackermann A, Pongs O. Structure of the voltage-dependent potassium channel is highly conserved from Drosophila to vertebrate central nervous systems. EMBO J. 1988;7:2457–2463. - PMC - PubMed
    1. Bradley J, Li J, Davidson N, Lester HA, Zinn K. Heteromeric olfactory cyclic nucleotide-gated channels: a subunit that confers increased sensitivity to cAMP. Proc Natl Acad Sci USA. 1994;91:8890–8894. - PMC - PubMed

Publication types

LinkOut - more resources