. 1997 Jan 1;17(1):91-106.
doi: 10.1523/JNEUROSCI.17-01-00091.1997.

The role of synaptic and voltage-gated currents in the control of Purkinje cell spiking: a modeling study

Affiliations

The role of synaptic and voltage-gated currents in the control of Purkinje cell spiking: a modeling study

D Jaeger et al. J Neurosci. .

Abstract

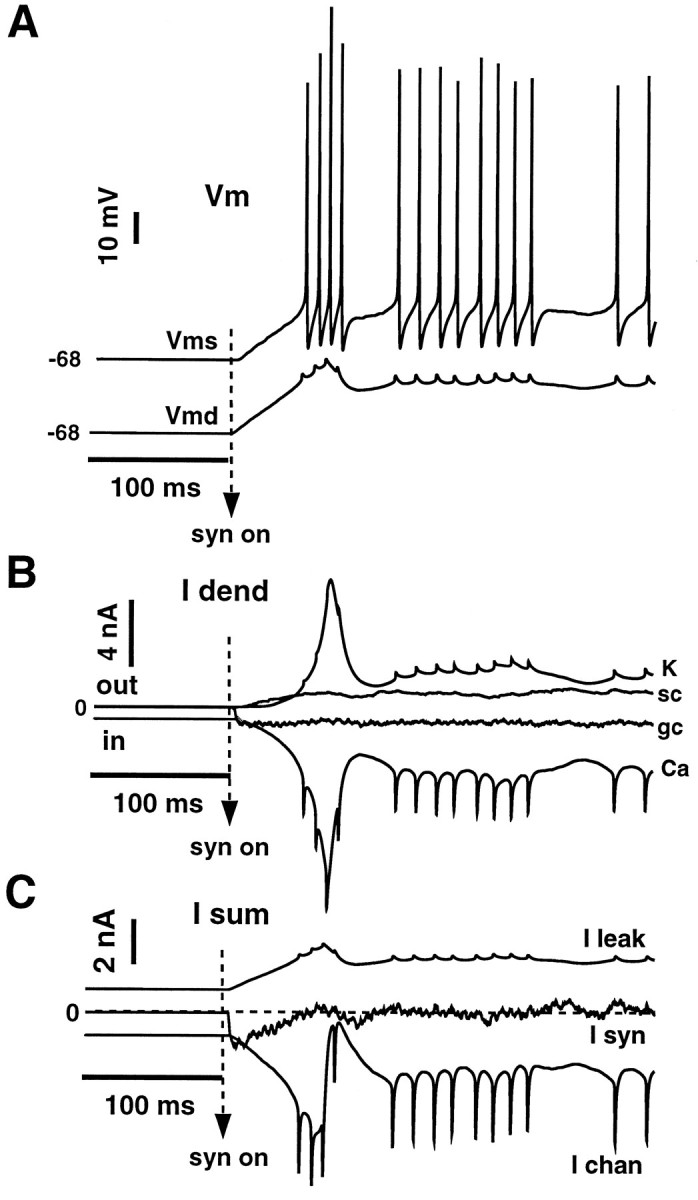
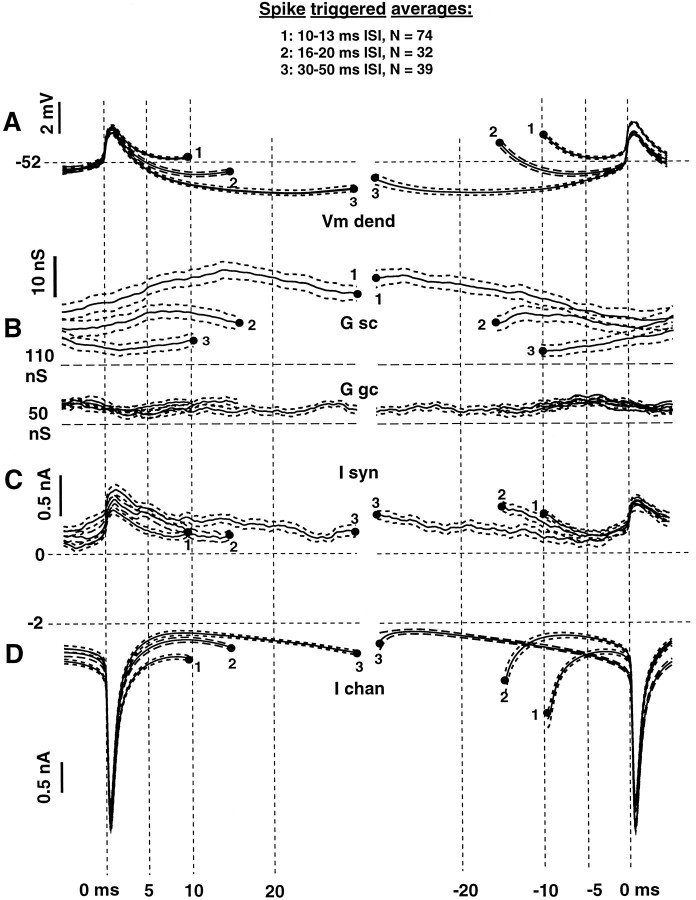
We have used a realistic computer model to examine interactions between synaptic and intrinsic voltage-gated currents during somatic spiking in cerebellar Purkinje cells. We have shown previously that this model generates realistic in vivo patterns of somatic spiking in the presence of continuous background excitatory and inhibitory input (). In the present study, we analyzed the flow of synaptic and intrinsic currents across the dendritic membrane and the interaction between the soma and dendrite underlying this spiking behavior. This analysis revealed that: (1) dendritic inward current flow was dominated by a noninactivating P-type calcium current, resulting in a continuous level of depolarization; (2) the mean level of this depolarization was controlled by the mean rate of excitatory and inhibitory synaptic input; (3) the synaptic control involved a voltage-clamping mechanism exerted by changes of synaptic driving force at different membrane potentials; (4) the resulting total current through excitatory and inhibitory synapses was near-zero, with a small outward bias opposing the P-type calcium current; (5) overall, the dendrite acted as a variable current sink with respect to the soma, slowing down intrinsic inward currents in the soma; (6) the somato-dendritic current showed important phasic changes during each spike cycle; and (7) the precise timing of somatic spikes was the result of complex interactions between somatic and dendritic currents that did not directly reflect the timing of synaptic input. These modeling results suggest that Purkinje cells act quite differently from simple summation devices, as has been assumed previously in most models of cerebellar function. Specific physiologically testable predictions are discussed.


Figures

Fig. 1.
Fig. 1.
Comparison of voltage traces during current injection into the soma between a physiological recording and the model. A, Intracellular recording of Purkinje cell somain vitro. A current injection pulse (cip) of 1.5 sec duration and 0.24 nA amplitude was started at 100 msec into the recording. B, Somatic voltage trace of simulation of same current injection paradigm in the Purkinje cell model. In both cases, the current injection was started when the cell was in a quiescent state. The voltage response to current injection in the model and in vitro started with an initial period of slow depolarization, followed by fast regular somatic spiking. This spiking continued at a slightly reduced rate after offset of the current injection pulse (cip off).
Fig. 2.
Fig. 2.
Current flow underlying voltage response to current injection in the model. Traces shown are taken from the same simulation for which the somatic voltage response is depicted in Figure1B. The time around onset and offset of the current injection pulse (cip) was expanded for improved resolution of details, and the middle section of current injection was left out. A, Voltage response in the soma.B, Current flow between the soma and the main dendritic segment. Current depolarizing the dendrite is depicted upward. The large amplitude of I s-d during somatic spiking (peaks at +25 and −2.2 nA) is truncated at ±1.0 nA. C, Dendritic membrane potential averaged over all dendritic compartments (Vmd). D, Dendritic currents through voltage-gated channels (I chan) during the same simulation. The traces shown represent the summed current over all dendritic compartments for each conductance type. Inward (depolarizing) currents are depicted downward. See Materials and Methods for description of each type of current. E, The sum of all voltage-gated currents (I chan) shown individually in D was largely compensated by the outward leak current (upper trace).
Fig. 3.
Fig. 3.
Somatic voltage and currents for a spike cycle after the offset of current injection. Somatic Vm (upper trace) and somatic currents (lower trace) during a spike cycle with current injection. Inward currents are plotteddownward. The dashed current tracerepresents the somato-dendritic current (I s-d). The NaF and I s-d currents are truncated at 10 nA maximal amplitude to give a better resolution of smaller currents. The first dashed vertical line marks the time of the most hyperpolarized somatic potential. Note that at this time I s-d flowed into the soma with an amplitude of 2 nA because of maintained dendritic depolarization. Thesecond dashed line marks the time in the spike cycle at which the injected current provided a significant proportion of the total inward current responsible for continued somatic depolarization.
Fig. 4.
Fig. 4.
Comparison of ISI histograms for spiking with and without synaptic input. A, Physiological recording of extracellular activity in vitro (solid line) and in vivo (dashed line). The gc input is inactive under in vitro conditions, and inhibitory input through sc inputs was blocked with bicuculline. Spontaneous spiking under these conditions most likely reflects purely intrinsic mechanisms. The resulting fast regular spike pattern showed a strong modal interval at 7.5 msec. The in vivo recording was obtained from an anesthetized rat in the absence of external stimulation. In this case, the recorded cell is embedded in an intact cerebellar network and presumably receives a background of spontaneous synaptic inputs. The modal ISI of 9.5 msec was longer than in thein vitro case, and a pronounced tail of very long intervals was present. B, Spike interval distributions obtained with the model in the absence (solid line) and presence (dashed line) of synaptic input. The spike train in the absence of synaptic input was obtained after a current injection of 0.24 nA. Synaptic input consisted of the random activation of all excitatory synapses at the rate of 37 Hz and inhibitory synapses at 1.5 Hz. The obtained interval distributions closely resemble the physiological recordings under in vitro and in vivo conditions, respectively.
Fig. 5.
Fig. 5.
Voltage response and membrane currents resulting from asynchronous synaptic input. The simulation was started at the stable resting membrane potential (−68 mV), and after 100 msec synaptic input was turned on. Each gc synapse was activated randomly with a mean rate of 12 Hz, whereas each sc synapse was activated randomly with a mean rate of 0.5 Hz. A, Membrane potential in the soma (Vms) and the average membrane potential over all dendritic compartments (Vmd).B, Total dendritic currents summed over all compartments. All K currents were combined (K trace) and the CaP and CaT current were also combined (Ca trace) in this and subsequent figures as both K currents with a significant amplitude (KC and K2) had the same pattern of activation, and the CaT current did not contribute significantly to the total Ca current. The spikes in dendritic voltage-gated currents associated with somatic spikes were a result of voltage transients conducted into the dendrite. Note that the spike-triggered activation of the Ca current was larger than that of the K current, resulting in a net inward dendritic current flow for each somatic spike. Total synaptic currents are depicted in the traces marked as gc (excitatory) and sc (inhibitory). C, The sum of inward and outward voltage-gated (I chan) and synaptic (I syn) currents is shown and contrasted with the leakage current out of the dendrite (I leak). Although the summed synaptic current was close to zero, a net inward current was provided by the sum of voltage-gated currents. This inward current was counteracted by the leak current.
Fig. 6.
Fig. 6.
Summary diagram of current amplitudes associated with various levels of gc and sc input. Simulations were run for a period of 2.0 sec for each level of synaptic input. The first 1.5 sec were treated as equilibration period, and only the final 0.5 sec was analyzed for spike rates and current amplitudes. In each panel of the figure, different levels of sc inhibition (0.5, 1.0, 1.5, 2.0 Hz) are depicted as separate curves. For each curve, the gc input rate was increased in small steps to study voltage responses and current amplitudes. A, Somatic spike rate as function of gc and sc input frequency. Note that the same spike rate could result from different total levels in synaptic input. B, Average membrane potential in soma and dendrite for different spike rates. Note that the soma was on average more depolarized than the dendrite and that the difference in potential is roughly proportional to the somato-dendritic current (E). C, Dendritic voltage-gated currents. Inward current (combined Ca currents) is down; outward current (combined K currents) isup. The sum of inward and outward currents (Ca+K) is inward for spike rates up to 150 Hz. The leak current counteracting this current to produce a stable membrane potential is not shown. Currents for the four different levels of inhibition are superimposed. D, Total inward (gc) and outward (sc) synaptic current as function of somatic spike rate. Inward current is down. The sum of inward and outward synaptic current (gc+sc) was outward for spike rates up to 120 Hz. The summed traces for different level of inhibition lie on top of each other. E, Temporal average of current flowing between soma and dendrite (I s-d). Although this current was strongly modulated during each spike cycle (Fig. 3), the mean direction of flow from soma to dendrite does indicate that overall the soma acted as a current source rather than as a current sink.
Fig. 9.
Fig. 9.
Spike-triggered averages of Vmd, synaptic currents, and channel currents. Spike-triggered averages were constructed for three sets of ISIs from 7 sec of simulation with 30 Hz gc and 1 Hz sc input. The ISI distribution for this level of input is shown in Figure 7C. Set 1 included 74 ISIs of 10–13 msec, set 2 included 32 ISIs of 16–20 msec, and set 3 included 39 ISIs of 30–50 msec. An upper and lower 95% confidence limit (1.7 SEs) is shown for each spike-triggered average as a pair of dashed traces. Vertical dashed lines denote the timing of dendritic traces with respect to the peak depolarization in the soma with each spike. Traces on the left are aligned to the initial spike in each ISI, and traces on the right are aligned to the terminating spike. A, Spike-triggered average of Vmd. B, Spike-triggered average of synaptic conductances summed for all gc inputs (G gc) and all sc inputs (G sc) in Siemens × 10e−9. Note that the total sc conductance is more than twice the amplitude of the gc conductance.C, Spike-triggered average of summed gc and sc currents (I syn). Note that the peak in synaptic current with each somatic spike is not a result of synaptic input but of the change in driving forces for gc and sc conductances with spike-related dendritic depolarization. D, Spike-triggered average of summed Ca and K currents (I chan). The inward peak of current after each somatic spike is a result of the activation of CaP conductance with spike-related dendritic depolarization.
Fig. 7.
Fig. 7.
ISI distributions for Purkinje cell spike trains.A, B, Baseline spike rate over 20 sec of recording from two Purkinje cells obtained in vivo in the anesthetized rat. The mean, mode, and coefficient of variation (cv = standard deviation/mean) of the spike interval distribution are printed above. These recordings presented two typical cases in the range of ISI distributions found in a sample of 15 recorded cells. Typically, the spontaneous spike rate was high and the peak in the ISI distribution around the modal interval was pronounced. The tail of the distribution was frequently larger than expected from an exponential decay. A pronounced tail was associated with a large cv. Values of cv in our sample ranged from 0.3 to 1.4 (mean = 0.7). The small number of very short intervals (<7 msec) was likely a result of spontaneous climbing fiber input that resulted in a brief burst of two to three spikes. C–F, ISI distributions obtained with different synaptic input rates in simulations of 20 sec duration. See Results for description.
Fig. 8.
Fig. 8.
The contribution of individual currents to fluctuations in dendritic membrane potential. A segment of 650 msec for a simulation with 30 Hz gc and 1 Hz sc input is shown.A, Time course of Vmd for a period of 650 msec.B, Time course of the contribution to fluctuations in Vmd by synaptic and voltage-gated currents. C, Contribution of somato-dendritic and leak current. D, The sum of the contributions of the currents shown in Band C reconstructed the time course of Vmd. The contribution of each current was obtained by calculating the charge carried with the current (charge is integral of current) and then rescaling the charge to its equivalent change in membrane potential byQ = V × C (see Materials and Methods). The linear component of each current was removed before this procedure. Note that the Vmd trace starts and ends with the same potential and, therefore, that the sum of all linear current components was zero.
Fig. 10.
Fig. 10.
A, Somatic currents during a 15 msec ISI. B, Same currents during a 23 msec ISI. Theblack arrows denote the time at which the current from the dendrite into the soma (I s-d) reversed, turning the dendrite from a current source into a current sink. As described in the text, the amplitude of the NaF current around the time of I s-d reversal was critical for obtaining a short or long ISI.
Fig. 11.
Fig. 11.
Scatter plots relating current levels and dendritic depolarization at the time of I s-d reversal to ISI duration. Each circle denotes the values for a single ISI out of 7 sec of simulated data for 30 Hz gc and 1 Hz sc input. Because short intervals (<20 msec) generally had a higher degree of correlation with different variables at the time of I s-d reversal, two linear regressions were calculated for short and long ISIs, respectively. The correlation coefficients (r2) for short and long ISIs are printed above each plot.A, Activation of NaF at the time of I s-d reversal versus ISI duration. B, NaF activation versus Vmd. Values associated with short ISIs (<20 msec) are denoted bycircles; values for long ISIs are denoted byasterisks. C, Vmd at the time of I s-d reversal versus ISI duration. D, Total sc conductances at the time of I s-d reversal versus ISI duration.

References

    1. Albus JS. A theory of cerebellar function. Math Biosci. 1971;10:25–61.
    1. Alzheimer C, Schwindt PC, Crill WE. Modal gating of Na+ channels as a mechanism of persistent Na+ current in pyramidal neurons from rat and cat somatosensory cortex. J Neurosci. 1993;13:660–673. - PMC - PubMed
    1. Bell AJ, Mainen ZF, Tsodyks M, Sejnowski TJ. Balancing of conductances may explain irregular cortical spiking. INC Technical Report no. INC-9502. University of California; San Diego: 1994.
    1. Bower JM, Woolston DC. Congruence of spatial organization of tactile projections to granule cell and Purkinje cell layers of cerebellar hemispheres of the albino rat: vertical organization of cerebellar cortex. J Neurophysiol. 1983;49:745–766. - PubMed
    1. Bower JM (1996) Is the cerebellum sensory for motor’s sake, or motor for sensory’s sake: the view from the whiskers of a rat. Prog Brain Res, in press. - PubMed

Publication types

LinkOut - more resources