Comparative Study
. 1997 Jan 1;17(1):107-16.
doi: 10.1523/JNEUROSCI.17-01-00107.1997.

A direct comparison of the single-channel properties of synaptic and extrasynaptic NMDA receptors

Affiliations
Comparative Study

A direct comparison of the single-channel properties of synaptic and extrasynaptic NMDA receptors

B A Clark et al. J Neurosci. .

Abstract

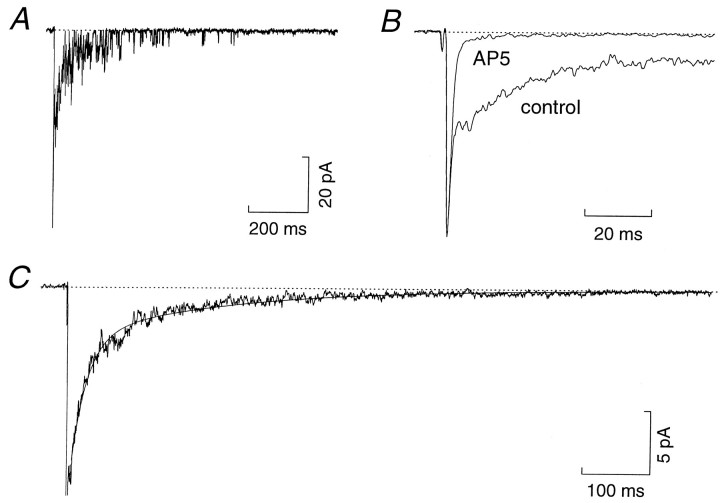
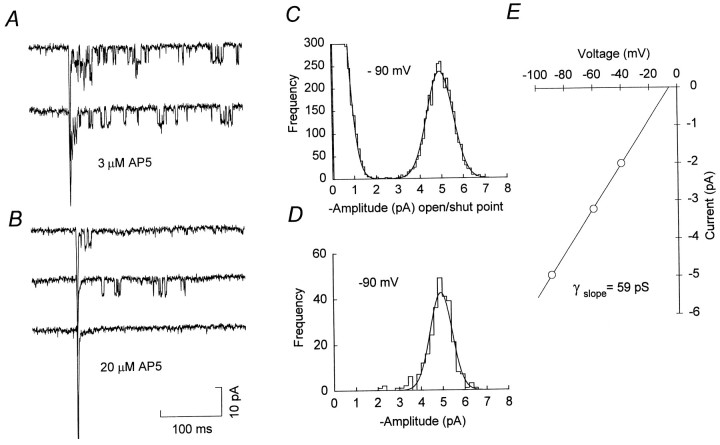
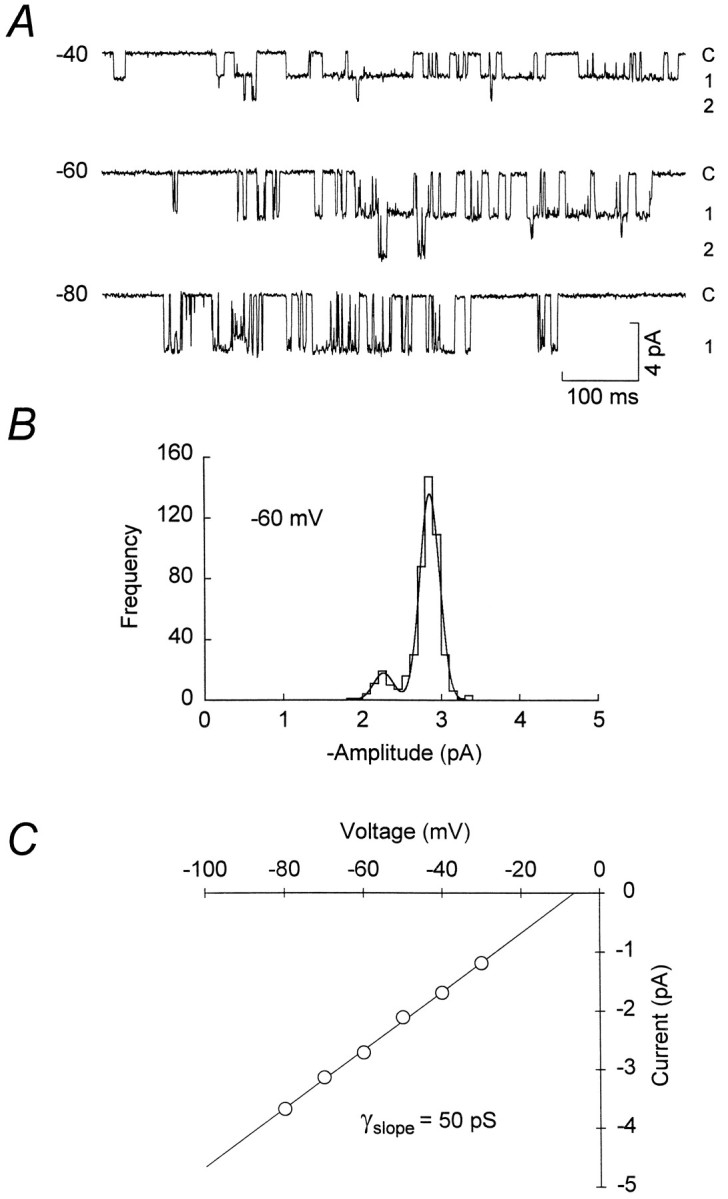
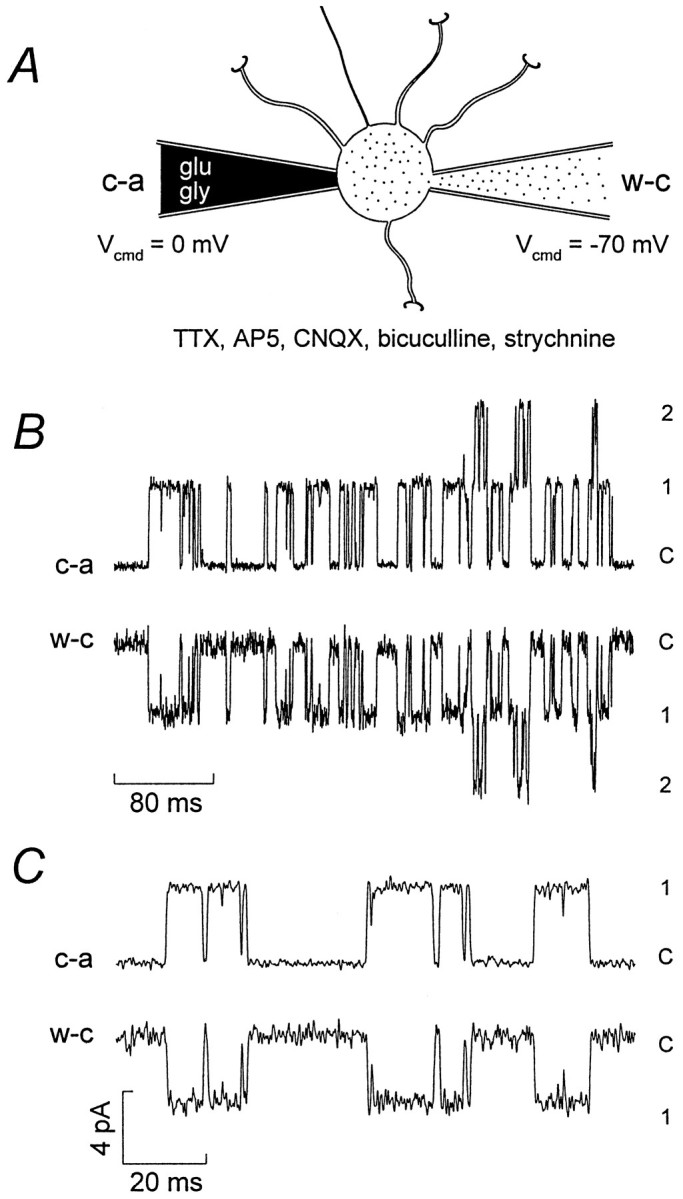
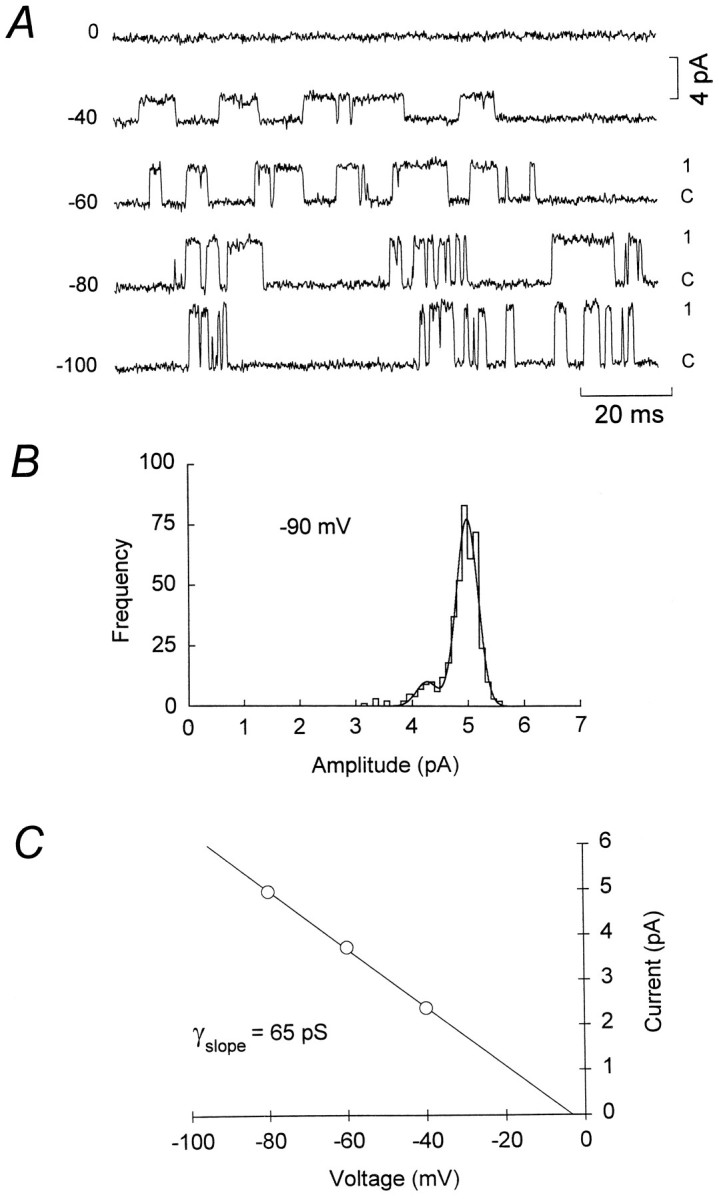
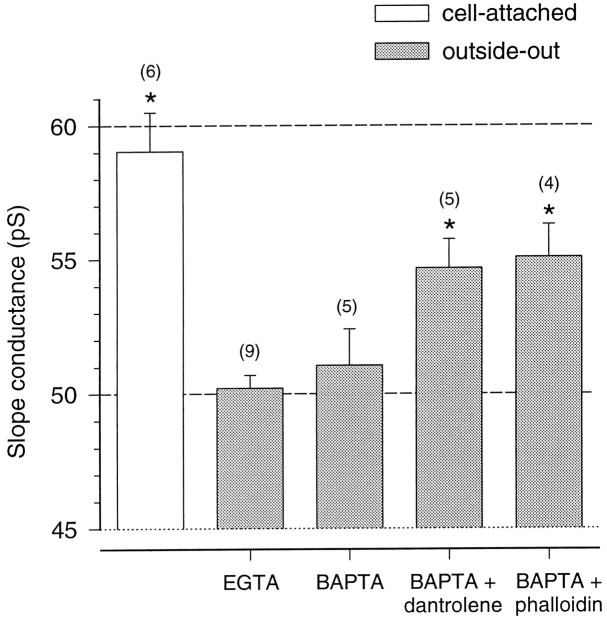
The assumption that synaptic and extrasynaptic glutamate receptors are similar underpins many studies that have sought to relate the behavior of channels in excised patches to the macroscopic properties of the EPSC. We have examined this issue for NMDA receptors in cerebellar granule cells, the small size of which allows the opening of individual synaptic NMDA channels to be resolved directly. We have used whole-cell patch-clamp recordings to determine the conductance and open time of NMDA channels activated during the EPSC and used cell-attached and outside-out recordings to examine NMDA receptors in somatic membrane. Conductance and open time of synaptic channels were indistinguishable from those of extrasynaptic channels in cell-attached patches. However, the channel conductance in outside-out patches was 20% lower than in cell-attached recordings. This change was partially reduced by dantrolene and phalloidin, suggesting that it may involve depolymerization of actin following Ca2+ release from intracellular stores. Our results demonstrate that synaptic and extrasynaptic NMDA receptors have similar microscopic properties. However, NMDA channel conductance is reduced following the formation of an outside-out patch.


Figures

Fig. 1.
Fig. 1.
Prolonged NMDA channel activity during evoked EPSCs. A, An individual EPSC recorded from a cerebellar granule cell (P12) at a holding potential of −90 mV. Currents were evoked by stimulation (16 V, 16 μsec, 0.25 Hz) delivered through a patch pipette placed in the granule cell layer. A fast non-NMDA receptor-mediated component of the EPSC is followed by a noisy NMDA receptor-mediated component. B, Average of 50 EPSCs from the same cell as A (control), superimposed on the average of 50 EPSCs recorded in the presence ofAP5 (20 μm). C, Average of 50 control EPSCs (same as B) showing more clearly the slow time course of the second component of the synaptic current (the initial non-NMDA receptor-mediated component is truncated in this display). In this cell the decay of the slow component, beginning from the clear inflexion in the current decay after the initial non-NMDA receptor-mediated component, could be fit with two exponentials having time constants of 23.1 msec (71.1%) and 222.0 msec (solid line). For display, the currents were digitized at 5 kHz after filtering at 1 kHz (8-pole Bessel, −3 dB).
Fig. 2.
Fig. 2.
Resolution of synaptic NMDA channel openings.A, Representative evoked EPSCs recorded in the presence of 3 μm AP5 (P12; −90 mV). In each EPSC, the initial non-NMDA receptor-mediated component is followed by the opening of several NMDA receptor channels. B, Evoked EPSCs recorded in the presence of 20 μm AP5 (same cell asA). Under these conditions fewer NMDA channel openings are observed, and many EPSCs consist of a fast non-NMDA component alone (bottom record). C, Open/shut point amplitude histogram for synaptic channels recorded at −90 mV in the presence of 3 μm AP5. The histogram is fit by two Gaussian distributions (solid line); closed points, 0.0 ± 0.53 pA (mean ± SD; truncated for display); open points, 4.96 ± 0.60 pA. For a reversal potential of −5.6 mV (seeE), this corresponds to a single-channel chord conductance of 58.8 pS. D, Histogram of cursor-measured amplitudes, fit with a single Gaussian distribution (4.92 ± 0.47 pA) corresponding to a single-channel chord conductance of 58.3 pA.E, Current–voltage relationship for synaptic channel openings from the same cell as A–D, recorded in the presence of 10 μm AP5 (all-point amplitude measurements). The solid line is a linear regression through the data, yielding a slope conductance of 58.8 pS and an extrapolated reversal potential of −5.6 mV.
Fig. 3.
Fig. 3.
Extrasynaptic NMDA channels in outside-out patches. A, Single-channel records from an outside-out patch taken from the soma of a P12 granule cell (Vcmd = −80, −60, and −40 mV). Inward currents in response to bath application of 1 μmglutamate and 3 μm glycine indicate the opening of1 or 2 channels from the closed level (C). B, Histogram of cursor-fit channel amplitudes at −60 mV. The data are fit by two Gaussian distributions (solid line) with the current levels of −2.86 ± 0.13 (88.7%) and −2.27 ± 0.13 pA (mean ± SD). For a reversal potential of −6.4 mV (see C), this corresponds to single-channel chord conductances of 53.3 and 42.3 pS.C, Current–voltage relationship for channel openings from the same cell as A and B (all-point amplitude measurements). The solid line is a linear regression through the data, yielding a slope conductance of 49.7 pS and an extrapolated reversal potential of −6.4 mV.
Fig. 4.
Fig. 4.
Isolation of extrasynaptic NMDA channel openings.A, Diagram showing the approach used to record selectively somatic NMDA channel openings. A granule cell with four dendrites and an axon is shown with cell-attached (c-a) and whole-cell (w-c) electrodes positioned on the soma. The diagram is not to scale; the mean soma diameter of granule cells (P9–P14) is ∼7 μm, and the dendrite length is ∼13 μm (M. Farrant, unpublished data; see also Silver et al., 1992).B, Paired current records from a single granule cell (P12). The top trace is from the cell-attached (c-a) electrode (Vcmd = 0 mV) with outward currents indicating the opening of 1 or2 channels from the closed level (C). The patch electrode contained 1 μm glutamate, 3 μm glycine, 10 μm bicuculline methobromide, 5 μm CNQX, and 200 nm strychnine. Thebottom trace is from the whole-cell (w-c) electrode (Vcmd = −70 mV), with inward currents mirroring those recorded from the cell-attached electrode. The bath solution contained 10 μm bicuculline methobromide, 5 μm CNQX, 10 μm AP5, 200 nmstrychnine, and 300 nm TTX. C, Currents from the same cell as B, shown on a faster time course. The current scale bar applies to both B andC. For display, the currents were digitized at 10 kHz after filtering at 1 kHz (8-pole Bessel, −3 dB).
Fig. 5.
Fig. 5.
Determination of extrasynaptic NMDA channel conductance. A, Recordings of somatic NMDA channels in a P12 granule cell obtained with a cell-attached electrode (Vcmd = 0 mV) at various potentials set by a whole-cell electrode (Vcmd = −100, −80, −60, −40, and 0 mV). The recording conditions were as described in Figure 4. Currents were digitized at 10 kHz after filtering at 1 kHz (8-pole Bessel, −3 dB). B, Histogram of cursor-fit channel amplitudes at −80 mV (different cell), fit by two Gaussian distributions (solid line) with the main current level being −4.98 ± 0.19 pA (mean ± SD). C, Current–voltage relationship for the main conductance level shown inB. The solid line is a linear regression through the data, yielding a slope conductance of 65.0 pS and an extrapolated reversal potential of −3.1 mV. All-point amplitude data (not shown) gave a slope conductance of 63.5 pS and an extrapolated reversal potential of −3.7 mV.
Fig. 6.
Fig. 6.
Slope conductance of extrasynaptic NMDA channels recorded under different conditions. A histogram of pooled data shows slope conductance for extrasynaptic NMDA channels. The open column shows the data from cell-attached patches; thefilled columns show data from outside-out patches with different pipette solutions. Vertical bars indicate SEM, and numbers in parentheses indicate the number of patches recorded. The asterisks indicate a significant difference (p < 0.05) from the value obtained for outside-out patches recorded with a normal EGTA-containing intracellular solution. The dashed lines at conductances of 50 and 60 pS are drawn to facilitate comparison.

References

    1. Akazawa C, Shigemoto R, Bessho Y, Nakanishi S, Mizuno N. Differential expression of five N-methyl-d-aspartate receptor subunit mRNAs in the cerebellum of developing and adult rats. J Comp Neurol. 1994;347:150–160. - PubMed
    1. Ascher P, Nowak L. The role of divalent cations in the N-methyl-d-aspartate responses of mouse central neurones in culture. J Physiol (Lond) 1988;399:247–266. - PMC - PubMed
    1. Ascher P, Bregestovski P, Nowak L. N-Methyl-d-aspartate-activated channels of mouse central neurones in magnesium-free solutions. J Physiol (Lond) 1988;399:207–266. - PMC - PubMed
    1. Barry PH, Lynch JW. Liquid junction potentials and small cell effects in patch-clamp analysis. J Membr Biol. 1991;121:101–117. - PubMed
    1. Bekkers JM, Stevens CF. NMDA receptors at excitatory synapses in the hippocampus: test of a theory of magnesium block. Neurosci Lett. 1993;156:73–77. - PubMed

Publication types

Substances

LinkOut - more resources