. 1997 Jan 1;17(1):251-66.
doi: 10.1523/JNEUROSCI.17-01-00251.1997.

Postnatal development of corticospinal projections from motor cortex to the cervical enlargement in the macaque monkey

Affiliations

Postnatal development of corticospinal projections from motor cortex to the cervical enlargement in the macaque monkey

J Armand et al. J Neurosci. .

Abstract

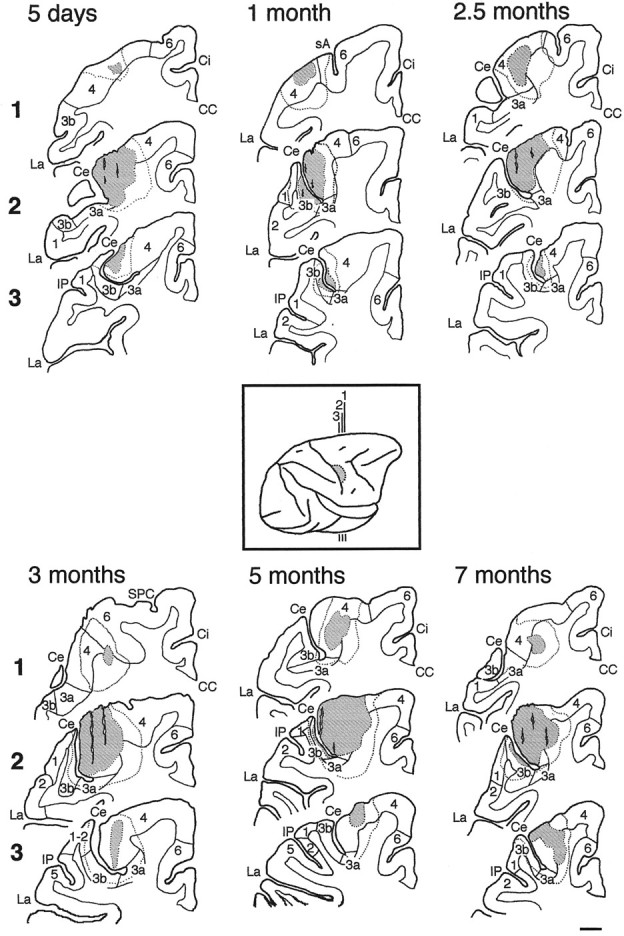
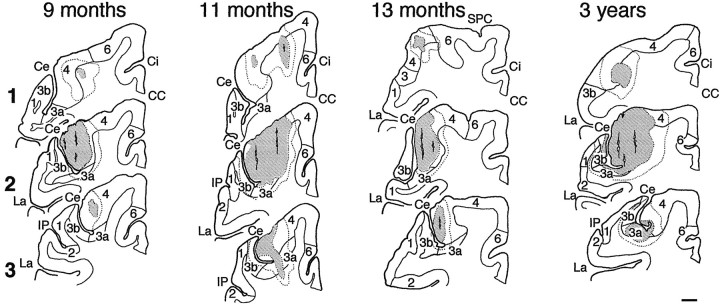
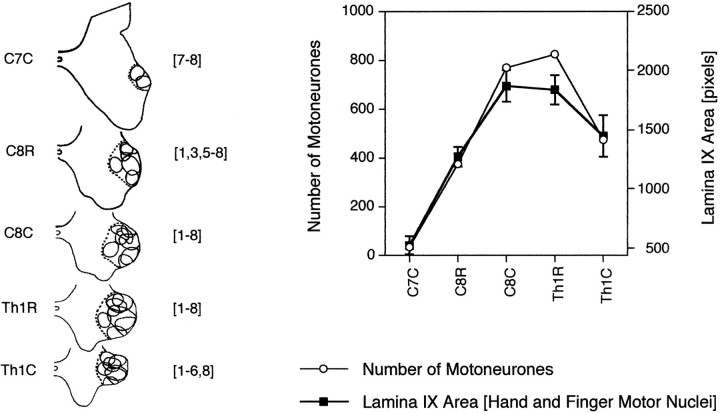
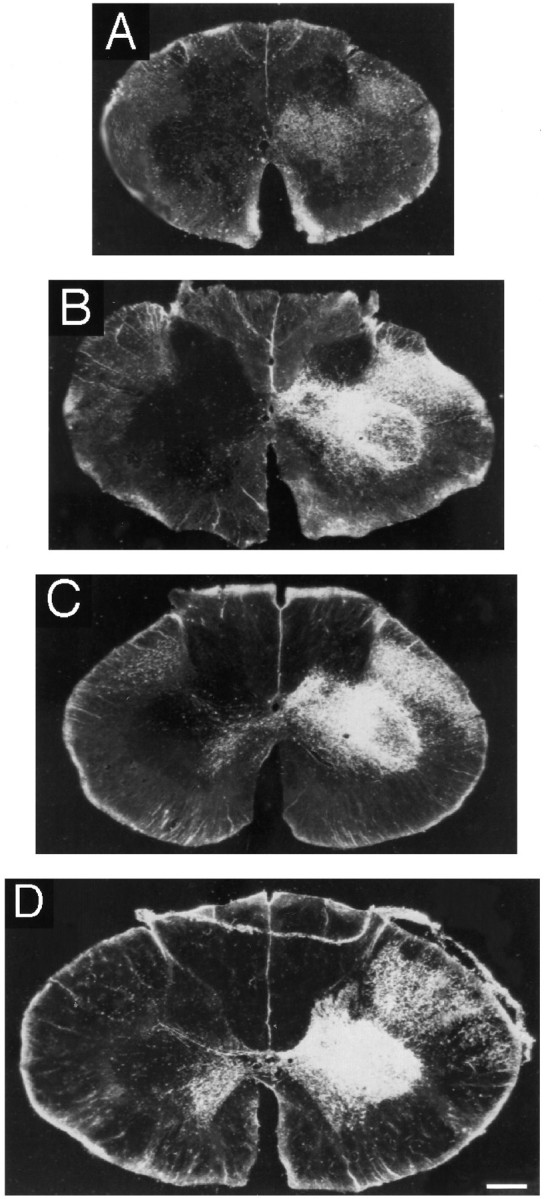
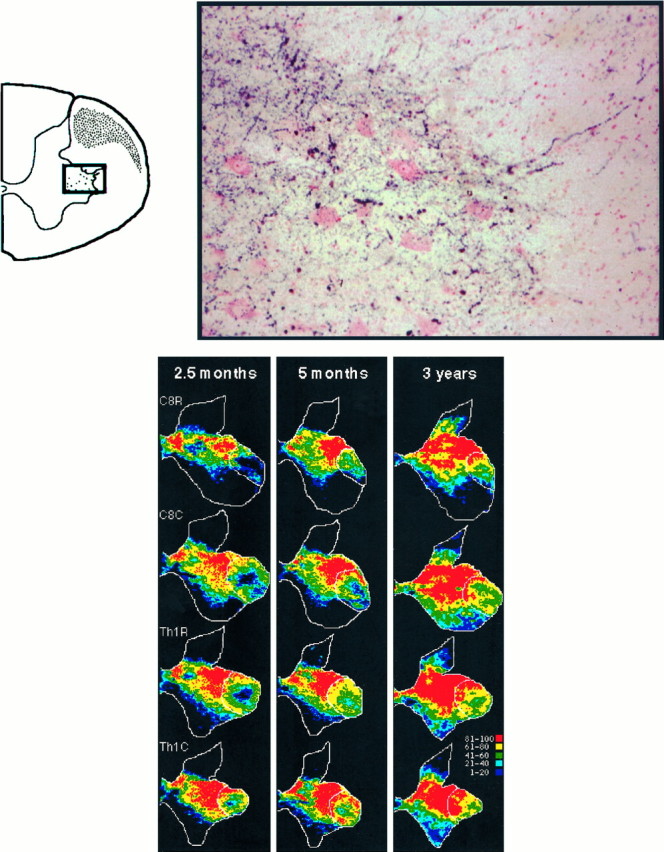
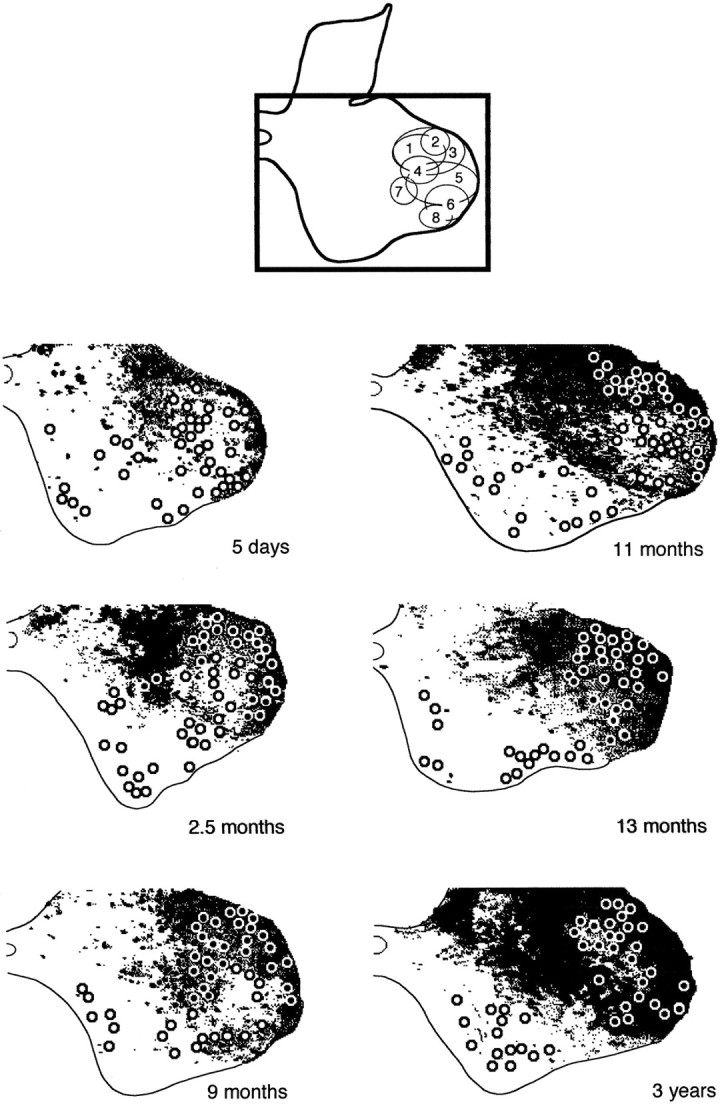
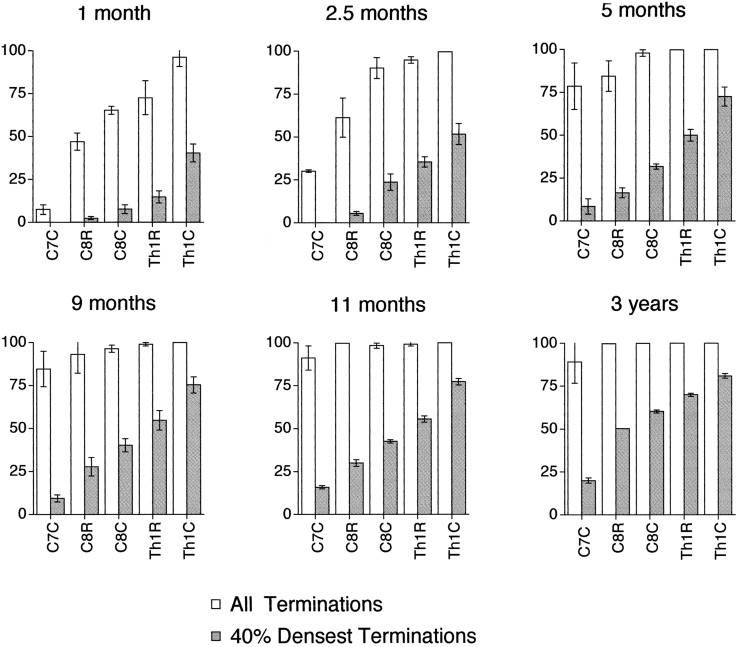
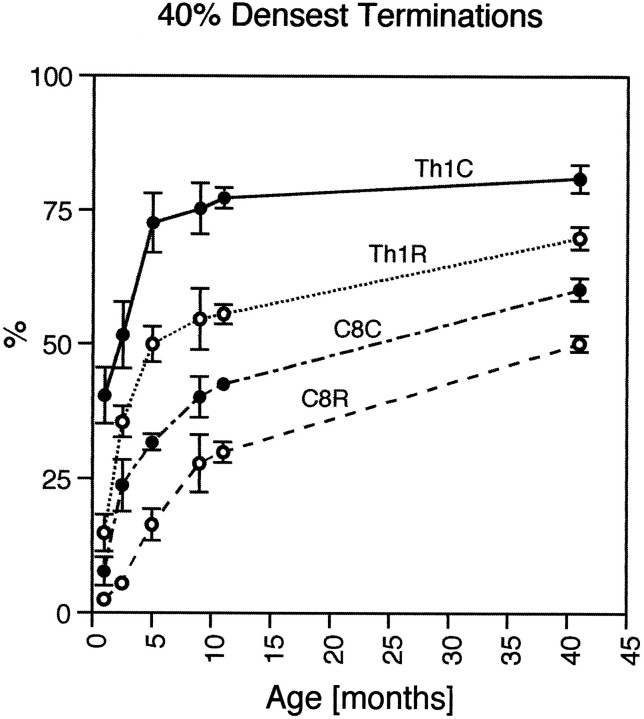
The postnatal development of corticospinal projections was investigated in 11 macaques by means of the anterograde transport of wheat germ agglutin-horseradish peroxidase injected into the primary motor cortex hand area. Although the fibers of the corticospinal tract reached all levels of the spinal cord white matter at birth, their penetration into the gray matter was far from complete. At birth, as in the adult, corticospinal projections were distributed to the same regions of the intermediate zone, although they showed marked increases in density during the first 5 months. The unique feature of the primate corticospinal tract, namely direct cortico-motoneuronal projections to the spinal motor nuclei innervating hand muscles, was not present to a significant extent at birth. The density of these cortico-motoneuronal projections increased rapidly during the first 5 months, followed by a protracted period extending into the second year of life. The densest corticospinal terminations occupied only 40% of the hand motor nuclei in the first thoracic segment at 1 month, 73% at 5 months, and 75.5% at 3 years. A caudo-rostral gradient of termination density within the hand motor nuclei was present throughout development and persisted into the adult. As a consequence, the more caudal the segment within the cervical enlargement, the earlier the adult pattern of projection density was reached. No transitory corticospinal projections were found. The continuous postnatal expansion of cortico-motoneuronal projections to hand motor nuclei in primates is in marked contrast to the retraction of exuberant projections that characterizes the development of other sensory and motor pathways in subprimates.


Figures

Fig. 4.
Fig. 4.
Injection sites of WGA-HRP in the different cases.Inset, Standard diagram of the right hemisphere and the position of three coronal planes (∼2.5 mm separation) in rostrocaudal sequence (13) passing through the injection site (stippled area). In each case (5 d and 1, 2.5, 3, 5, and 7 months), the stippled area shows the injection site, including needle tracks, where the reaction product is as dense in axons and perikarya as in the extracellular space, whereas the area enclosed by the dotted line is the surrounding zone of diffusion and/or transport of WGA-HRP (from TMB/nitroprusside-reacted sections). The boundaries between the gray and the white matter as well as between the cytoarchitectonic areas (4, 6, 3a, 3b, 1, 2, 5) are represented by a thin solid line (from cresyl violet-stained sections). In each section, medial is on theright and dorsal is at the top.CC, Corpus callosum; Ce, central sulcus;Ci, cingulate sulcus; IP, intraparietal sulcus; La, lateral sulcus; sA, spur of the arcuate sulcus; SPC, superior precentral sulcus. Scale bar, 2 mm.
Fig. 5.
Fig. 5.
Injection sites of WGA-HRP in the 9-, 11-, and 13-month-old and 3-year-old animals. The injection in the adult (case 3) is representative of both adult cases. See Figure 4 for details.
Fig. 1.
Fig. 1.
Densitometric analysis of a spinal cord section (Th1 level of the adult case 3). A, The whole section, shown on the left, is a negative image. The positive photomicrograph of the same section, photographed under dark-field illumination, is shown in Figure 6D. The distribution of gray levels within this negative image is shown on theright, i.e., number of pixels per gray level (0–256). The background density level (i.e., that contributed by the slide, mounting medium, and coverslip) was computed by selecting an area outside but close to the actual section (inset).B, The area of gray matter contralateral to the injection site has been selected. The background density level has been subtracted from this selected area. The histogram inB shows the density distribution of regions with and without labeling (note the difference in the ordinate scales betweenA and B). The gray matter regions without labeling corresponded to gray level values 0–85. The “window of terminations,” delineated by dashed lines, was between 85 and 220 gray levels and was subdivided into five equal ranges (arrowheads, 1–20%, 21–40%, 41–60%, 61–80%, and 81–100%).
Fig. 2.
Fig. 2.
Comparison of densitometry for two cases. The “window of terminations” within the spinal gray matter contralateral to the cortical injection is shown for an adult (case 3, same data as Figs. 1B, 6D) in A and the 5-month-old infant monkey (case 5) inB. Differences in labeling in the dorsal horn and in the ventromedial part of the intermediate zone were probably attributable to differences in the extent of the injection sites in the two animals (see text). The density histograms show that the width of the window of terminations (dashed lines) was slightly different in the two cases: 85–220 gray levels in A and 120–230 inB. As a consequence, the five ranges (arrowheads) had slightly different widths.
Fig. 3.
Fig. 3.
Rostrocaudal variations of the number of motoneurons of selected hand and finger muscles (from Jenny and Inukai, 1983) and of the area occupied by these motor nuclei as computed in this study. Left, Diagrams of the hemispinal gray matter in the spinal segments from C7 to Th1 and including both caudal (C) and rostral (R) half-segments of C8 and Th1. The dotted line encloses the overall area occupied by the motor nuclei (solid lines) of eight selected hand and finger muscles, whose numbers are indicated inbrackets. 1, 1st dorsal interosseous;2, lateral lumbrical; 3, adductor pollicis; 4, flexor and abductor pollicis brevis;5, flexor digitorum profundus and superficialis;6, extensor digitorum communis and extensor digiti secundi proprius, abductor and extensor pollicis longus;7, flexor carpi ulnaris; 8, extensor carpi ulnaris; reconstructed from Figures 6, 7, 8 of Jenny and Inukai (1983). Right, Rostrocaudal variation, from C7 to Th1, of the number of motoneurons (open circles) of these eight selected hand and finger muscles (from Fig. 4 of Jenny and Inukai, 1983) and the overall area in pixels (filled squares) occupied by these motor nuclei in the present study. Area measurements are mean ± SD of data from three cases (2.5 months, 5 months, and adult case 3).
Fig. 6.
Fig. 6.
Photomicrographs under dark-field illumination and polarized light of representative spinal cord sections at the Th1 level in four different cases after injection of WGA-HRP into the hand area of the primary motor cortex (right side). The left side of the cord is shown on the right. A, 5 d;B, 2.5 months; C, 5 months;D, adult (case 3). Note the increasing intensity of labeling with age in the dorsal part of lamina IX, the location of the lateral motoneuronal cell groups innervating hand muscles. Scale bar, 500 μm.
Fig. 8.
Fig. 8.
Top. Labeled corticospinal fibers terminating among the motoneurons innervating hand and finger muscles in an adult monkey. High-power color photomicrograph (location indicated by inset) under bright-field illumination of a paratungstate/TMB-reacted section (Th1 level of the adult case 6). The motoneurons have been lightly counterstained with Neutral Red. Note the labeled axons coming from the ventral tip of the crescent-shaped bundle of fibers in the lateral funiculus (hatched area ininset) and reaching directly the dorsolateral group of motoneurons (dots in inset).
Fig. 7.
Fig. 7.
Corticospinal anterograde labeling in the gray matter at the C8–Th1 junction at different ages: 5 d, 2.5, 9, 11, and 13 months, and 3 years (case 3). The black frame at the top (from Fig. 9 in Jenny and Inukai, 1983) indicates the region of gray matter represented belowand also shows the distribution of selected hand muscle motor nuclei (for numbering, see Fig. 3). The corticospinal terminal labeling (inblack) and the location of motoneurons (circles) have been obtained from digitized paratungstate/TMB-reacted sections.
Fig. 10.
Fig. 10.
Proportion of the selected area of lamina IX containing the motor nuclei of the hand and finger muscles that received corticospinal projections (open bars) and the densest 40% of these projections (hatched bars) in the different cases: 1, 2.5, 5, 9, and 11 months and 3 years (case 3). For each half-segment (R, rostral; C, caudal) from caudal C7 (C7C) to caudal Th1 (Th1C), the mean ± SD was computed from data gathered from 6–12 sections.
Fig. 11.
Fig. 11.
Age-related changes in the density of corticospinal projections to C8–Th1. The proportion of the selected area of lamina IX containing the motor nuclei of the hand and finger muscles that received the densest 40% of corticospinal projections reached adult value earlier in caudal Th1 (Th1C) than in rostral C8 (C8R). The time constant of the best fit for these points was 3.2 and 4.3 months for the caudal and rostral parts of Th1, respectively, compared to 8.4 and 12.6 months for the caudal and rostral parts of C8, respectively.

Similar articles

Cited by

References

    1. Alisky JM, Swink TD, Tolbert DL. The postnatal spatial and temporal development of corticospinal projections in the cat. Exp Brain Res. 1992;88:265–276. - PubMed
    1. Armand J, Holstege G, Kuypers HGJM. Differential corticospinal projections in the cat: an autoradiographic tracing study. Brain Res. 1985;343:351–355. - PubMed
    1. Armand J, Edgley SA, Lemon RN, Olivier E. Protracted postnatal development of corticospinal projections from the primary motor cortex to hand motoneurones in the macaque monkey. Exp Brain Res. 1994;101:178–182. - PubMed
    1. Armand J, Olivier E, Edgley S, Lemon RN. The structure and function of the developing corticospinal tract: some key issues. In: Wing AH, Haggard P, Flanagan JR, editors. Hand and brain. The neurophysiology and psychology of hand movements. Academic; San Diego: 1996. pp. 125–145.
    1. Babalian A, Liang F, Rouiller EM. Cortical influences on cervical motoneurons in the rat: recordings of synaptic responses from motoneurons and compound action potential from corticospinal axons. J Neurosci Res. 1993;16:301–310. - PubMed

Publication types

MeSH terms

Substances