

Postnatal development of binocular disparity sensitivity in neurons of the primate visual cortex
- PMID: 8987756
- PMCID: PMC6793705
- DOI: 10.1523/JNEUROSCI.17-01-00296.1997
Postnatal development of binocular disparity sensitivity in neurons of the primate visual cortex
Abstract
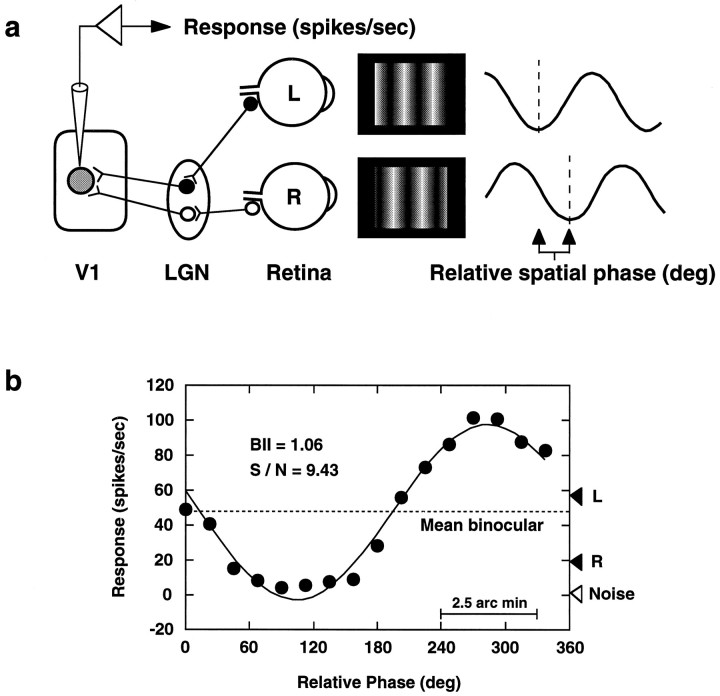
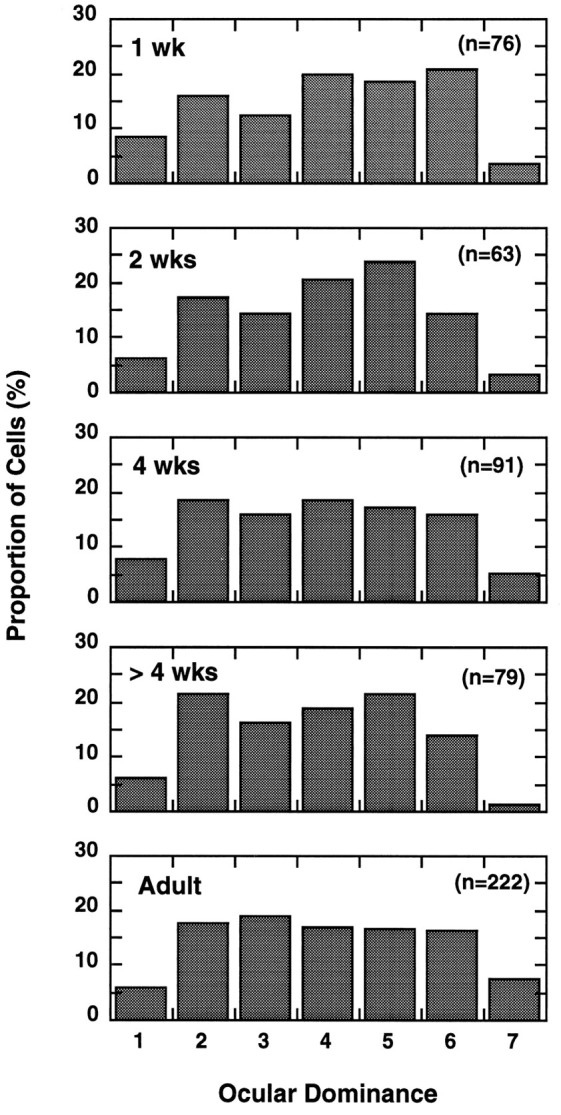
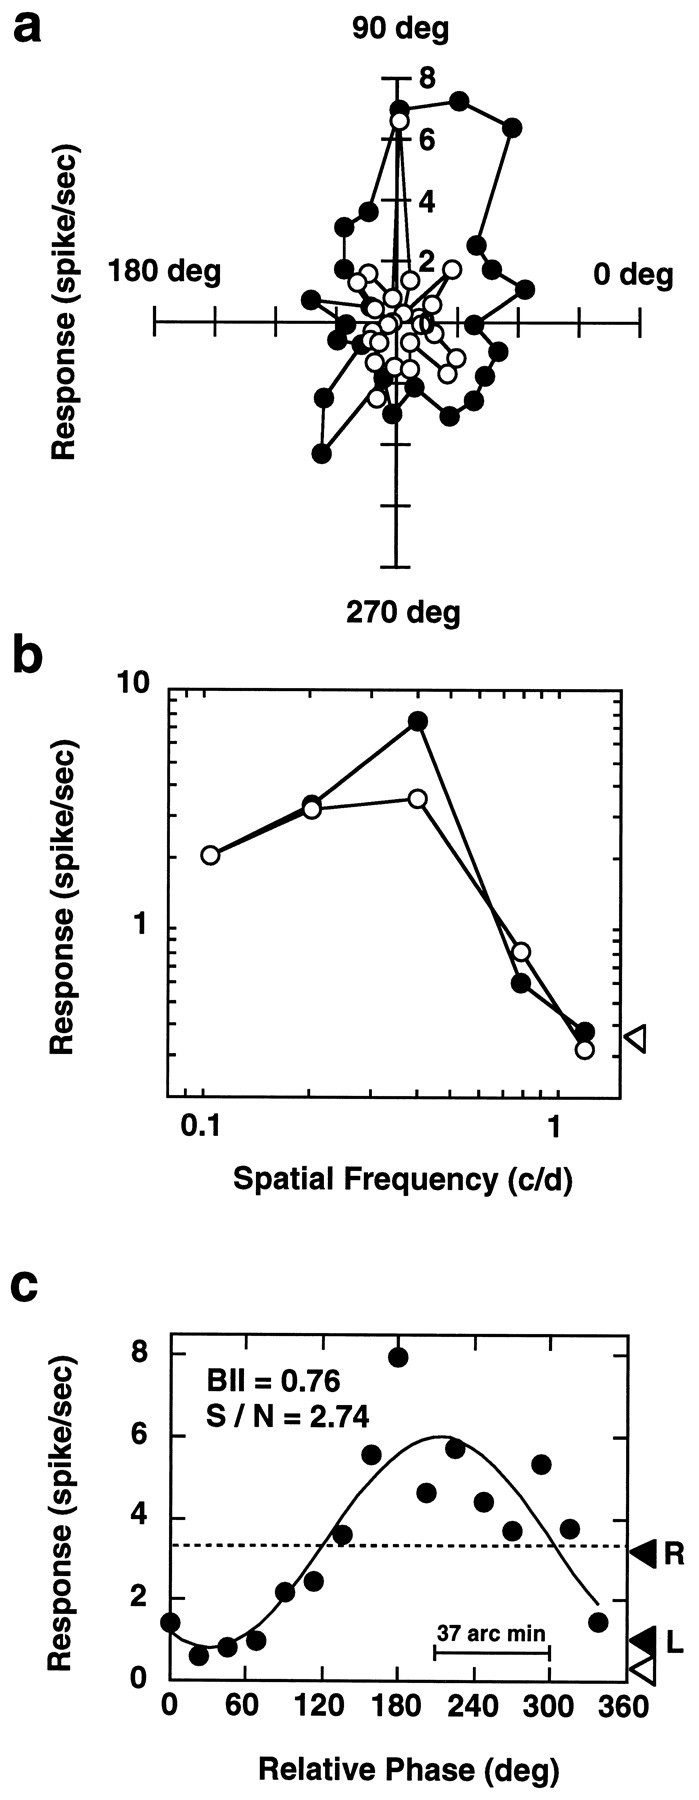
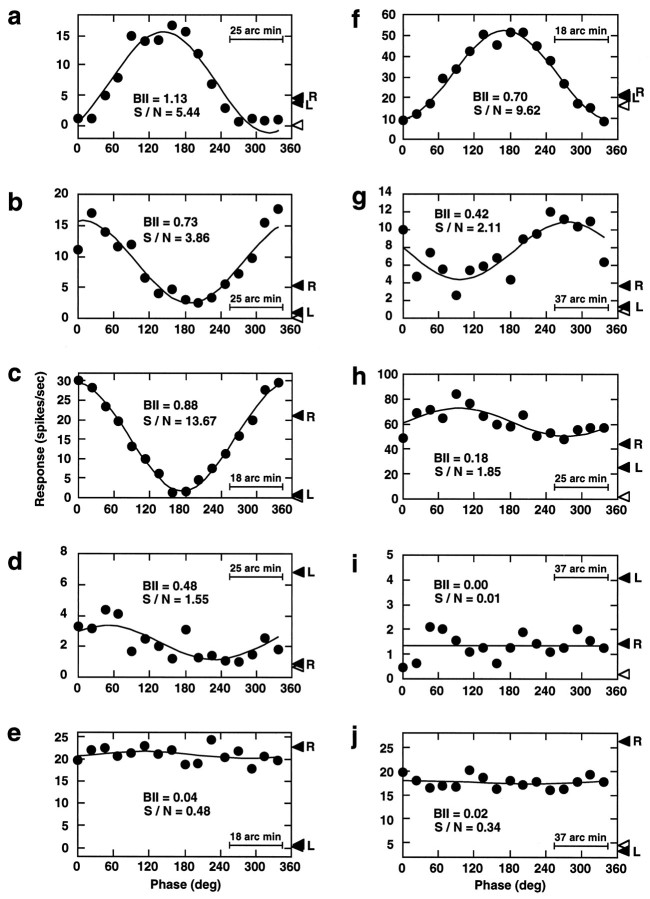
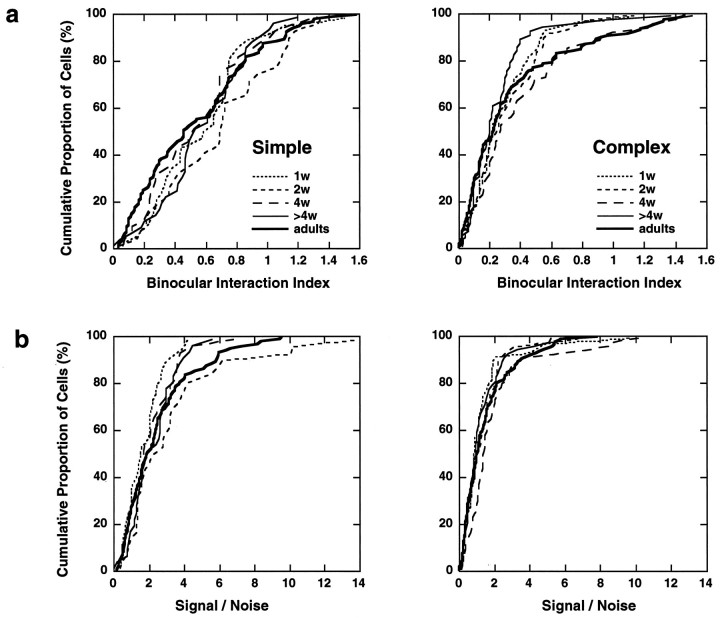
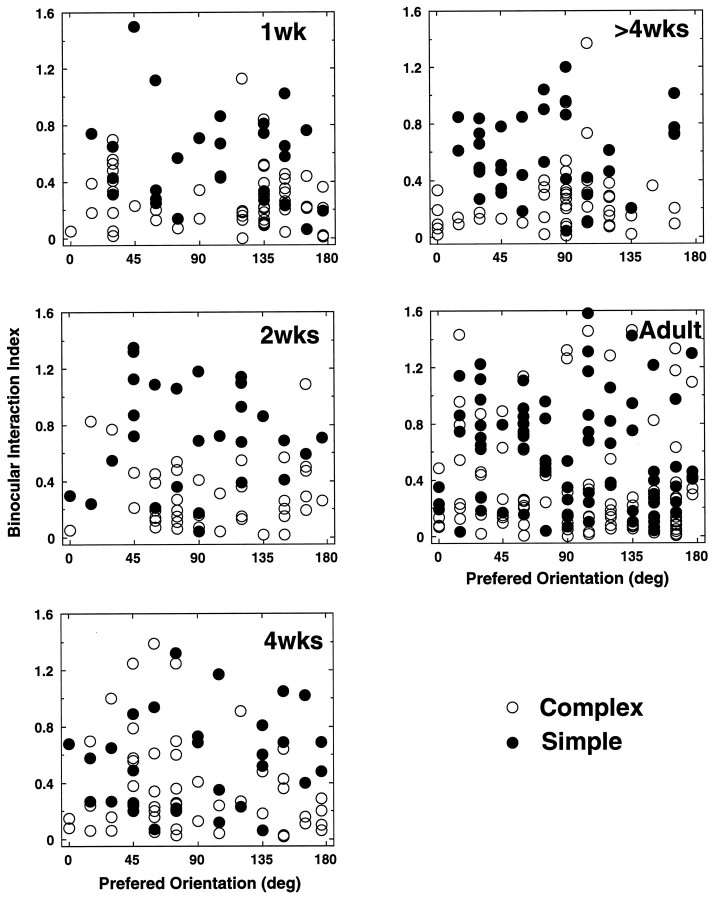
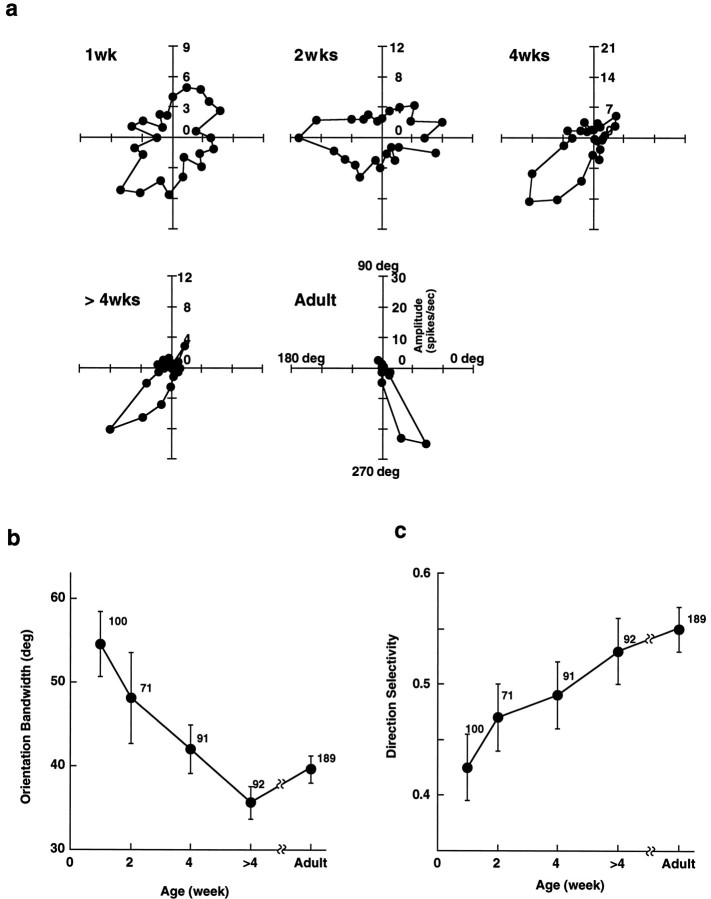
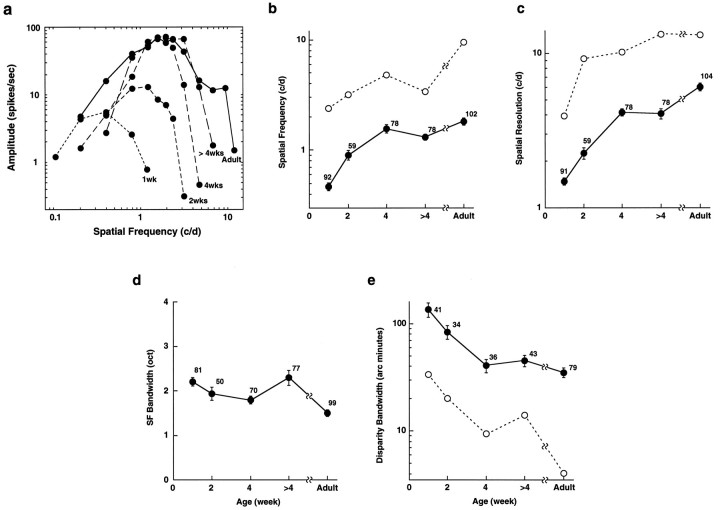
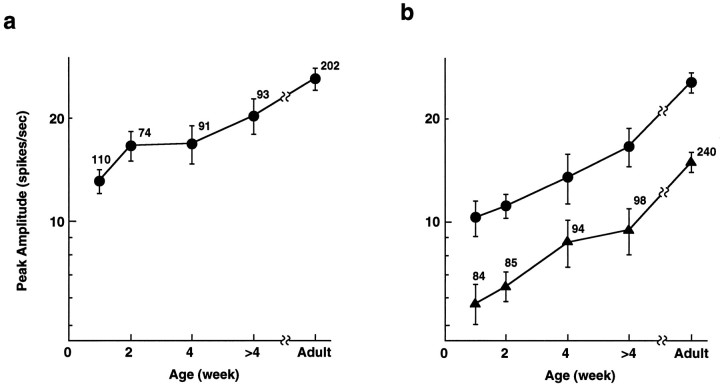
In macaque monkeys, the age at which neurons in the primary visual cortex (V1) become sensitive to interocular image disparities, a prerequisite for stereopsis, is a matter of conjecture. To resolve this fundamental issue in binocular vision development, we measured the responsiveness of individual V1 neurons in anesthetized and paralyzed infant monkeys as a function of the relative, interocular, spatial phase of dichoptic sine-wave gratings. We found that an adult-like proportion of units were sensitive to interocular image disparity as early as the sixth postnatal day, several weeks before the onset age for stereopsis in monkeys. The ocular dominance distributions of cells in infant monkeys were also indistinguishable from those of adults. Thus, at or only a few days after birth, V1 neurons are capable of combining neural signals from the two eyes as in adults and are sensitive to interocular image disparities. However, the monocular spatial-frequency response properties of these disparity-sensitive units were immature, and their overall responsiveness was far lower than that in adults. During the first 4 postnatal weeks, both the spatial frequency response properties and the peak response amplitude rapidly improved, which resulted in a corresponding increase in the absolute sensitivity of individual units to interocular disparity. The results demonstrate that early binocular vision development in monkeys is not constrained by a paucity of disparity-sensitive V1 neurons but, instead, by the relative immaturity of the spatial response properties and the overall unresponsiveness of existing disparity-sensitive neurons.
Figures
Similar articles
-
Binocular spatial phase tuning characteristics of neurons in the macaque striate cortex.J Neurophysiol. 1997 Jul;78(1):351-65. doi: 10.1152/jn.1997.78.1.351. J Neurophysiol. 1997. PMID: 9242285
-
Residual binocular interactions in the striate cortex of monkeys reared with abnormal binocular vision.J Neurophysiol. 1997 Sep;78(3):1353-62. doi: 10.1152/jn.1997.78.3.1353. J Neurophysiol. 1997. PMID: 9310426
-
Effects of the duration of early strabismus on the binocular responses of neurons in the monkey visual cortex (V1).Invest Ophthalmol Vis Sci. 2002 Apr;43(4):1262-9. Invest Ophthalmol Vis Sci. 2002. PMID: 11923274
-
Mechanisms of stereopsis in monkey visual cortex.Cereb Cortex. 1995 May-Jun;5(3):193-204. doi: 10.1093/cercor/5.3.193. Cereb Cortex. 1995. PMID: 7613075 Review.
-
Neuronal Representation of 3-D Space in the Primary Visual Cortex and Control of Eye Movements.Perception. 2015;44(8-9):995-1006. doi: 10.1177/0301006615594930. Epub 2015 Aug 14. Perception. 2015. PMID: 26562914 Review.
Cited by
-
Visual Neuropsychology in Development: Anatomo-Functional Brain Mechanisms of Action/Perception Binding in Health and Disease.Front Hum Neurosci. 2021 May 31;15:689912. doi: 10.3389/fnhum.2021.689912. eCollection 2021. Front Hum Neurosci. 2021. PMID: 34135745 Free PMC article. Review.
-
The subregion correspondence model of binocular simple cells.J Neurosci. 1999 Aug 15;19(16):7212-29. doi: 10.1523/JNEUROSCI.19-16-07212.1999. J Neurosci. 1999. PMID: 10436074 Free PMC article.
-
Rapid plasticity of binocular connections in developing monkey visual cortex (V1).Proc Natl Acad Sci U S A. 2005 Jun 21;102(25):9026-31. doi: 10.1073/pnas.0500280102. Epub 2005 Jun 14. Proc Natl Acad Sci U S A. 2005. PMID: 15956191 Free PMC article.
-
Binocular Disparity Selectivity Weakened after Monocular Deprivation in Mouse V1.J Neurosci. 2017 Jul 5;37(27):6517-6526. doi: 10.1523/JNEUROSCI.1193-16.2017. Epub 2017 Jun 2. J Neurosci. 2017. PMID: 28576937 Free PMC article.
-
The Puzzle of Visual Development: Behavior and Neural Limits.J Neurosci. 2016 Nov 9;36(45):11384-11393. doi: 10.1523/JNEUROSCI.2937-16.2016. J Neurosci. 2016. PMID: 27911740 Free PMC article.
References
-
- Aslin RN. Infant accommodation and convergence. In: Simon K, editor. Early visual development, normal and abnormal. Oxford UP; New York: 1993. pp. 30–38.
-
- Birch EE. Stereopsis in infants and its developmental relationship to visual acuity. In: Simon K, editor. Early visual development, normal and abnormal. Oxford UP; New York: 1993. pp. 224–236.
-
- Birch EE, Gwiazda J, Held R. Stereoacuity development for crossed and uncrossed disparities in human infants. Vision Res. 1982;22:507–513. - PubMed
-
- Boothe RG, Dobson V, Teller DY. Postnatal development of vision in human and nonhuman primates. Annu Rev Neurosci. 1985;8:495–545. - PubMed
Publication types
MeSH terms
Grants and funding
LinkOut - more resources
Full Text Sources