. 1997 Jan 15;17(2):530-42.
doi: 10.1523/JNEUROSCI.17-02-00530.1997.

Nerve growth factor induces apoptosis in human medulloblastoma cell lines that express TrkA receptors

Affiliations

Nerve growth factor induces apoptosis in human medulloblastoma cell lines that express TrkA receptors

Y Muragaki et al. J Neurosci. .

Abstract

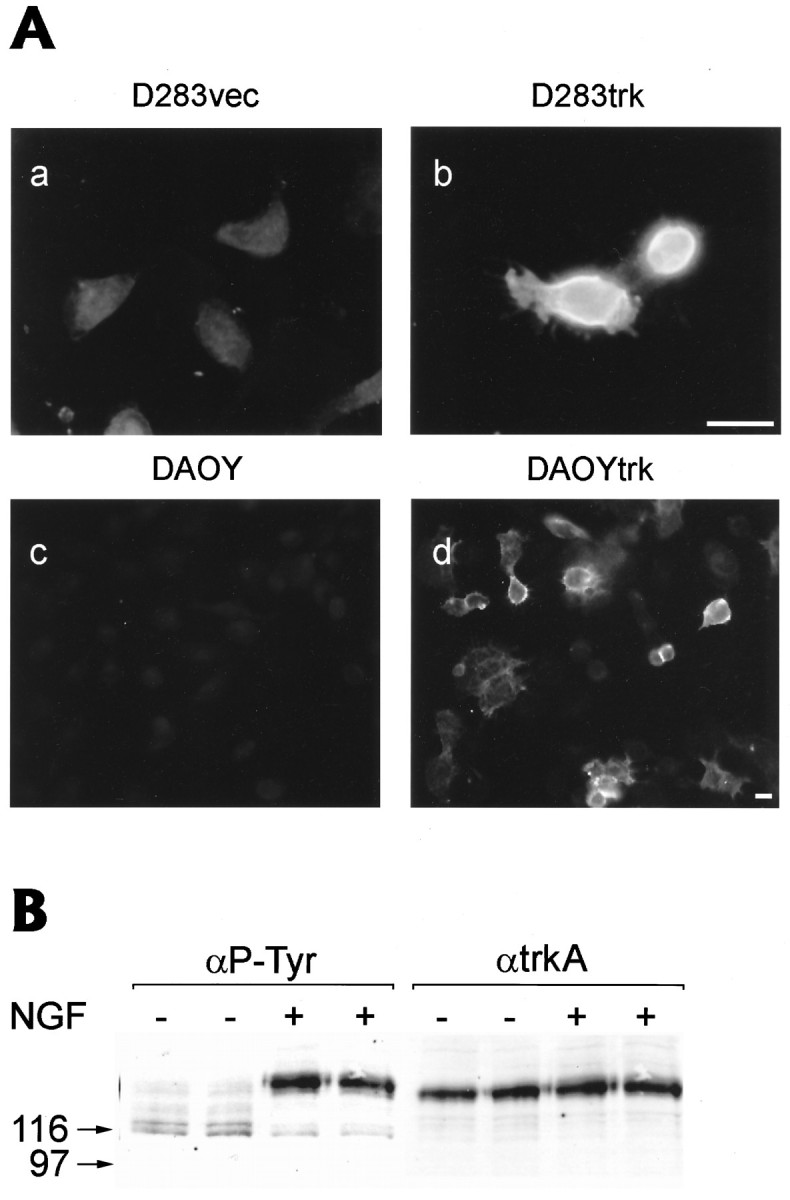
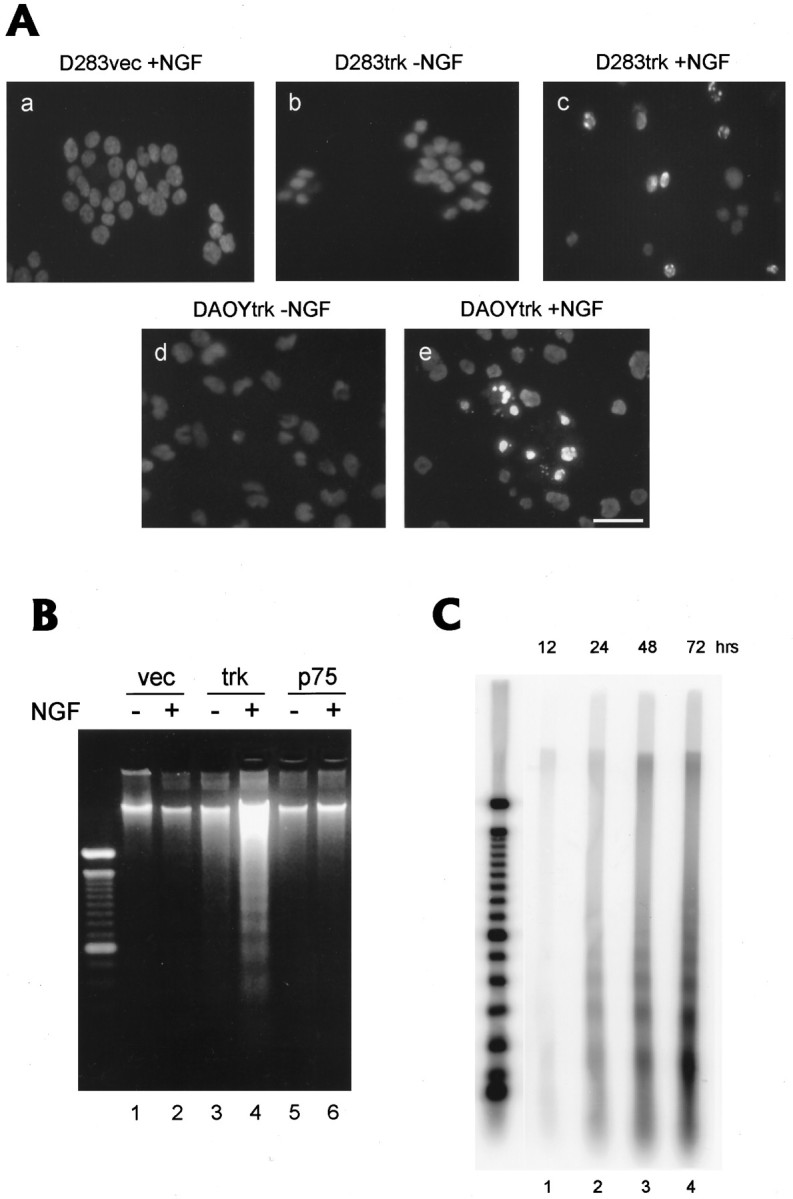
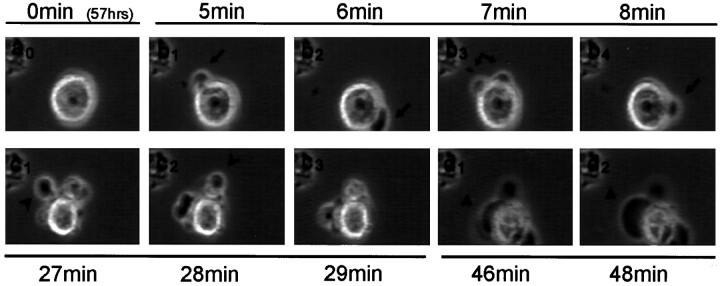
Neurotrophins act through their cognate receptors to promote the differentiation and/or survival of neuronal progenitor cells, immature neurons, and other cells. Here, we examined the effects of nerve growth factor (NGF) and its cognate receptor (Trk or TrkA) on the survival of a common childhood brain tumor, i.e., medulloblastoma, a tumor that resembles CNS neuroepithelial progenitor cells. To do this, we engineered two human medulloblastoma cell lines (i.e., D283MED and DAOY cells) to express human TrkA using a retroviral expression vector. Surprisingly, NGF-treated medulloblastoma cells expressing the TrkA receptor (D283trk and DAOYtrk cells) grown in the presence or absence of serum underwent massive apoptosis, but similar treatment did not induce apoptosis in wild-type uninfected cells, cells expressing an empty vector, or cells expressing the TrkC receptor. Furthermore, D283MED cells engineered to express the human p75 NGF receptor (D283p75) also did not undergo apoptosis. Significantly, NGF-induced apoptosis in D283trk and DAOYtrk cells can be inhibited by anti-NGF antibodies and by K-252a, an inhibitor of TrkA tyrosine phosphorylation and mimicked by high concentrations of NT3. Because NGF treatment primarily eliminated D283trk cells from the S phase of the cell cycle, this form of NGF-mediated apoptosis is cell cycle-dependent. These findings suggest that a NGF/TrkA signal transduction pathway could activate apoptotic cell death programs in CNS neuroepithelial progenitor cells and in childhood brain tumors.


Figures

Fig. 1.
Fig. 1.
A, Expression oftrkA transcripts in D283 cells infected withtrkA-containing retroviral vectors. Northern blots were performed on 25 μg of total RNA from different cell lines following electrophoresis using cDNA probes to full-length humantrkA. Notably, both the D283trk cells infected with pLNCtrk (D283Ntrk, lane 7) and with pLNHDtrk (D283Htrk, lane 8) retroviral vectors expressed high levels of trkA transcripts. In contrast, no trkA transcripts were seen in the parent D283 cells (lane 4), D283 cells infected with empty vector (D283vec, lane 5), or in the D283 cells infected with a retrovirus containing human p75LNGFR (D283p75, lane 6). Note that the rodent pheochromocytoma-derived PC12 cells express an ∼3.2 kb transcript corresponding to rattrkA (asterisk). The two bands in D283trk cells correspond to trkA transcripts situated between the 5′ and 3′ LTRs of the retroviral vector (top bands) and between the internal CMV promoter and 3′ LTR of this vector (bottom bands). The 28S and 18S molecular weight markers are shown to the left oflane 1 in the Northern blot, and the ethidium bromide-stained gel below demonstrates equal loading of the 28S and 18S ribosomal RNAs from the cell lines in each of the lanes shownabove in the Northern blot. B, TrkA receptor protein expression in different cell lines engineered stably to express TrkA. Western blots were performed on cell extracts (100 μg of protein per lane) from each of the cell lines indicatedabove each lane in B after electrophoresis in 7.5% SDS-PAGE gels. TrkA was detected in blots probed with E7, a MAb directed against the extracellular domain of TrkA. The ascites was applied at a dilution of 1:1000. Both the D283trk (lane 3) and the DAOYtrk (lane 4) cell lines express ∼110 and ∼125 kDa (short arrow) TrkA immunobands, both of which migrate more rapidly than the 140 kDa (long arrow) species of fully glycosylated TrkA observed in the PC12trk (lane 5), 3T3trk cells (lane 6). Furthermore, trkC expressed in DAOYtrkC cells almost comigrated with TrkA bands from 3T3trk cells (compare lanes 6 and 7). No immunoreactive TrkA is seen in the wild-type D283 and DAOY cells (lane 1 and lane 2, respectively).
Fig. 2.
Fig. 2.
A, TrkA receptor protein expression on the cell surface of D283trk and DAOYtrk cells. Immunofluorescence images of D283vec (a), D283trk (b) cells, uninfected DAOY (c), and DAOYtrk (d) after incubation with a mouse pan-trk antibody (E13) at 4°C for 90 min followed by fixation with 70% ETOH containing 150 mmNaCl and a second incubation with a Texas red-conjugated rabbit anti-mouse IgM antibody for 1 hr. Scale bars, 20 μm.B, Autophosphorylation of the TrkA receptor after treatment of the D283trk cells with NGF. Gel electrophoresis (10% SDS-PAGE) and Western blotting were performed on a cell lysate (100 μg of total proteins) from cells incubated with 100 ng/ml of NGF for 5 min. The nitrocellulose replica was probed with the anti-phosphotyrosine (4G10) mouse mAb and developed with ECL. After stripping the nitrocellulose replica with 1% SDS, the blot was reprobed with the E7 mAb to detect TrkA in the cell lysate. Note that an ∼125 kDa immunoband corresponding to heavily glycosylated TrkA is the predominant species of TrkA recognized by the anti-phosphotyrosine mAb in the D283trk cells, but only after treatment of these cells with NGF. Duplicate lanes of D283trk cell lysates from NGF-treated and untreated cells were loaded.
Fig. 3.
Fig. 3.
Response of retrovirus- infected D283 and DAOY cells to NGF. The images in this figure are phase-contrast photomicrographs of cells (1.5 × 10⁵ per individual well of a 24 well-plate) that were grown with (+NGF) or without (−NGF) exposure to 100 ng/ml NGF for 3 d. Whereas untreated D283trk and DAOYtrk cells continue to divide, NGF-treated cells showed a decrease in cell number (compare c with d,g with h). D283 cells that were infected with vector alone (D283vec in a and b) or infected with retrovirus to express p75 (D283p75 in eand f) continued to divide and showed no evidence of cell death in response to treatment with NGF. Scale bars (shown inh): 200 μm.
Fig. 4.
Fig. 4.
The induction of cell death in D283trk and DAOYtrk cells is specific to NGF. a, b, The decrease in cell number induced by NGF in D283trk cells was blocked with the anti-NGF antibody (designated here αNGF and used at a dilution of 1:500) as evidenced by comparing the images ina (+NGF) and b(+NGF + αNGF). c,d K-252a (which inhibits tyrosine phosphorylation of TrkA) inhibits NGF- induced cell death in DAOYtrk cells.e, f, NT3 at 1 μg/ml also induces cell death in DAOYtrk cells. g, h, The treatment of DAOY cells stably expressing the TrkC receptor with NT3 did not result in cell death. Note that the expression of TrkC, but not TrkA, resulted in a dramatic alteration in the morphology of DAOY cells. Scale bars (shown in h): 200 μm.
Fig. 5.
Fig. 5.
Dose response to and effect on viability of retrovirus-infected D283trk cells after treatment with NGF. Cells (5 × 10³ cells grown in the presence of serum, and 1 × 10⁴ cells grown in the absence of serum) were incubated with different concentrations of NGF in three independent wells of a 96 well-plate for 4 d. Increasing concentrations of NGF were administered as shown on the x-axis of the graphs in A and B. The viability of the D283trk cells was examined using the MTS assay, and the MTS levels for the cells in the wells without NGF were assigned a value of 100%. In the presence of serum (A), D283trk (solid squares with solid lines) showed a clear decrease of cell viability in a dose-dependent manner, whereas the D283vec (solid circles with dotted lines) and the D283p75 (shaded triangles with dashed lines) cells did not evidence diminished viability even after treatment with 1 μg/ml NGF. Qualitatively similar results were seen when cells were not grown in the absence of serum (B).
Fig. 6.
Fig. 6.
A, Morphological evidence of apoptotic death in D283trk and DAOYtrk cells induced by treatment with NGF for 4 and 2 d, respectively. Hoechst 33342 staining did not demonstrate the formation of condensed chromatin in the D283vec cells treated with NGF (D283vec + NGF ina) or in the D283trk and DAOYtrk cells in the absence of NGF (b and d, respectively). However, condensed chromatin was seen in the D283trk and DAOYtrk cells after treatment with NGF for 4 and 2 d, respectively (c and e, respectively). Scale bars (shown in e): 20 μm.B, Biochemical evidence of apoptosis in D283trk cells induced by treatment with NGF (100 ng/ml) resulting in the appearance of a classic DNA “ladder.” DNA from cells (8 × 10⁶) were extracted after 3 d incubation with NGF, electrophoresed in a 2% agarose gel, and stained with 2 μg/ml ethidium bromide. Only D283trk treated with (+) NGF (lane 4) showed evidence of a DNA “ladder,” whereas D283trk cells not treated with NGF (−) did not, and none of the other cell lines with or without NGF treatment produced a similar profile of DNA fragments. vec, D283vec cells; trk, D283trk cells; p75, D283p75 cells. C, Time course of apoptosis in D283trk cells as monitored by DNA gel electrophoresis. DNA (1 μg) extracted from D283trk cells treated withNGF for up to 72 hr was labeled with TdT and 32P-ddATP, purified, electrophoresed in 2% agarose gels, and transferred to nitrocellulose membranes. Lanes 1-4 show the progressive prominence of a DNA “ladder” from 12 to 72 hr after treatment of the D283trk cells with NGF. Quantitation of the DNA ladder showed an exponentially increasing signal intensity after 24 hr. Molecular weight markers are shown in the far left lane.
Fig. 7.
Fig. 7.
Time-lapse videomicroscopy of apoptotic cell death in the D283trk cells after treatment with NGF. Cells (5 × 10⁵) were plated on 35 mm coverglasses coated with 1 μg/ml poly-d-lysine and observed by time-lapse videomicroscopy to monitor cell death events at the times indicated in each image. Apoptosis was common, and a cell that died an apoptotic death beginning at ∼57 hr after NGF treatment is followed at subsequent time intervals from 0 to 48 min in the images in a0 through d2. Initially, this cell appeared normal (a0), but typical blebs (arrows in b1 throughb4) begin to develop in the NGF-treated D283trk cells. Approximately 30 min before the death of this cell, a number of apoptotic bodies can be observed. Finally, more massive blebs develop (triangles in d1 and d2), and the cell body begins to disintegrate (d2).
Fig. 8.
Fig. 8.
Loss of populations of D283trk cells at different stages of the cell cycle after treatment with NGF. D283trk cells (2.5 × 10⁶) were incubated with or without NGF for various lengths of time (6–96 hr as indicated on thex-axis in B and C) and stained with 50 μg/ml propidium iodide (PI) in hypotonic buffer (0.1% sodium citrate plus 0.1% Triton X-100) at 4°C overnight. The PI fluorescence of individual nuclei (10,000 events) was measured using a FACScan flow cytometer (A). The total number of cells was counted using trypan blue. A, B, After treatment with NGF for 24 hr and beyond, the percentage of cells in S phase (S inA,a) decreased by 43% compared with no NGF treatment (compare a withb in A) and compare −NGFwith +NGF in B, whereas reductions in the percentage of cells in the G0/G1 and G2/M phases of the cell cycle were less prominent (A, B). By 72 hr, however, reductions in all phases of the cell cycle can be observed (seec and d in A andB). The asterisk marks the position of cellular debris that is generated from dead cells. C, Although a loss in the absolute number of D283trk cells is evident in each phase of the cell cycle, the largest losses are seen in S phase. Note the different scale used for the y-axis in D283trk cells with (−NGF, left) and without (+NGF, right) treatment.

References

    1. Baker DL, Molenaar WM, Trojanowski JQ, Evans AE, Ross AH, Rorke LB, Packer R, Lee VM-Y, Pleasure D. Nerve growth factor receptor expression in peripheral and central primitive neuroectodermal tumors, other pediatric brain tumors and during development of the adrenal gland. Am J Pathol. 1991;139:115–122. - PMC - PubMed
    1. Barbacid M. Neurotrophic factors and their receptors. Curr Opin Cell Biol. 1995;7:148–155. - PubMed
    1. Barker PA, Lomen-Hoerth C, Gensch EM, Meakin SO, Glass DJ, Shooter EM. Tissue-specific alternative splicing generates 2 isoforms of the trk receptor. J Biol Chem. 1993;268:15150–15157. - PubMed
    1. Becker LE, Hinton D. Primitive neuroectodermal tumors of the central nervous system. Hum Pathol. 1983;14:538–550. - PubMed
    1. Berg MM, Sternberg DW, Parada LF, Chao MV. K-252a inhibits nerve growth factor-induced trk proto-oncogene tyrosine phosphorylation and kinase activity. J Biol Chem. 1992;267:13–16. - PubMed

Publication types

MeSH terms