. 1997 Jan 15;17(2):697-708.
doi: 10.1523/JNEUROSCI.17-02-00697.1997.

Neuronal adaptations to changes in the social dominance status of crayfish

Affiliations

Neuronal adaptations to changes in the social dominance status of crayfish

S R Yeh et al. J Neurosci. .

Abstract

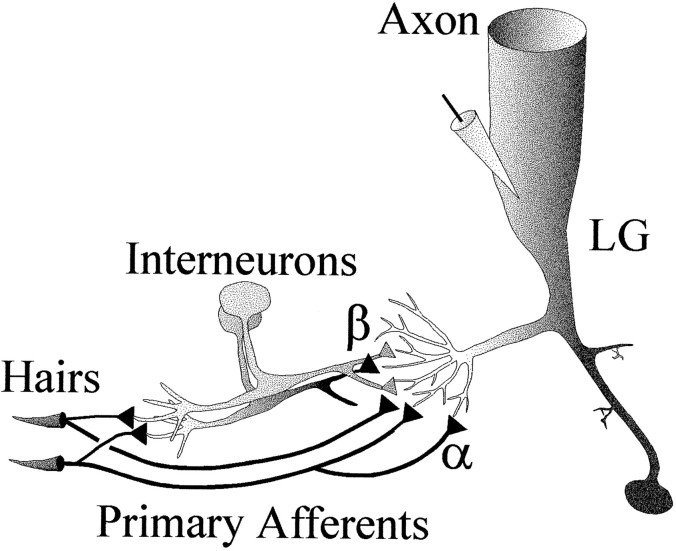
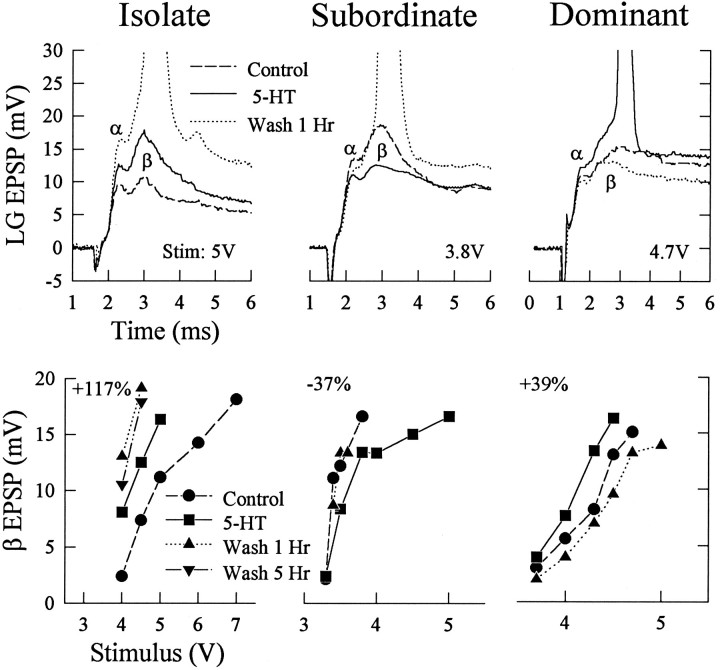
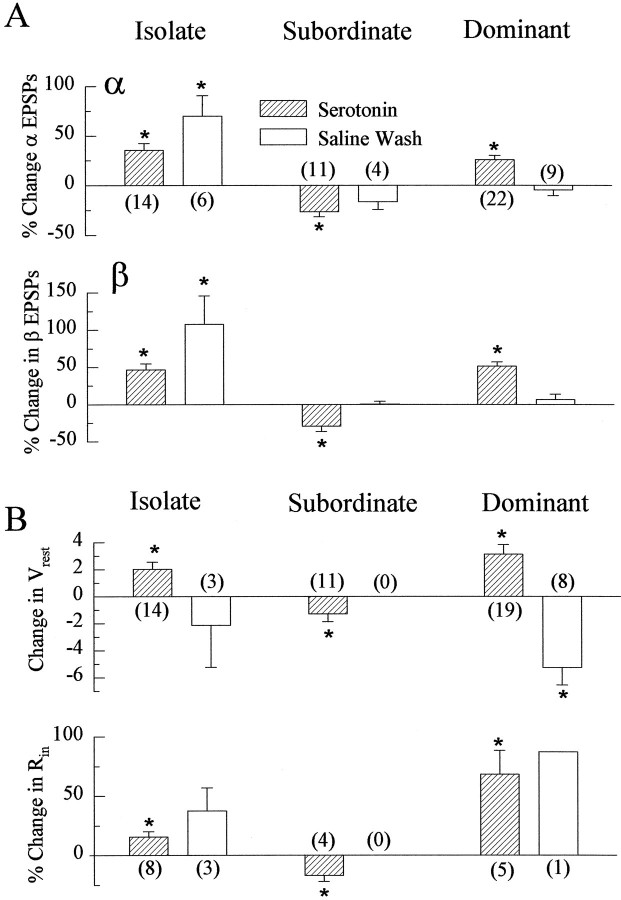
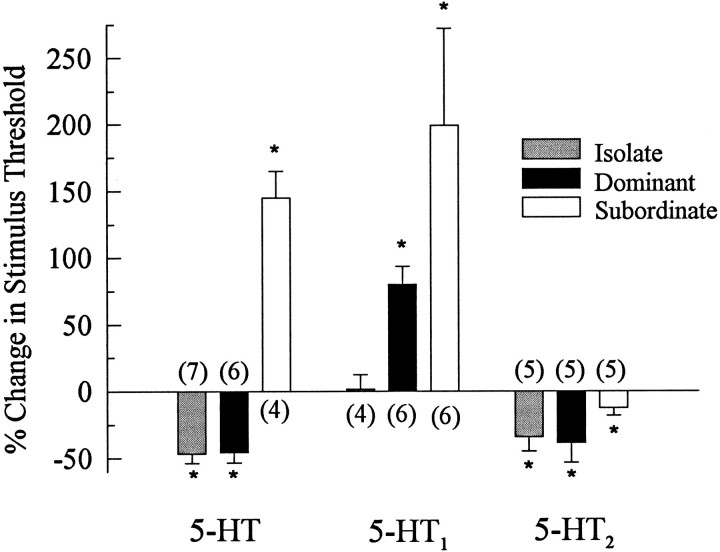
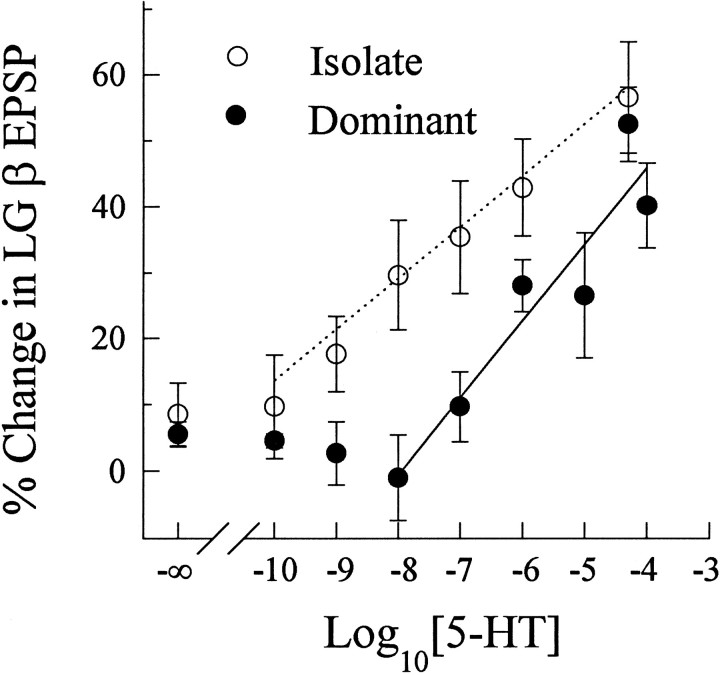
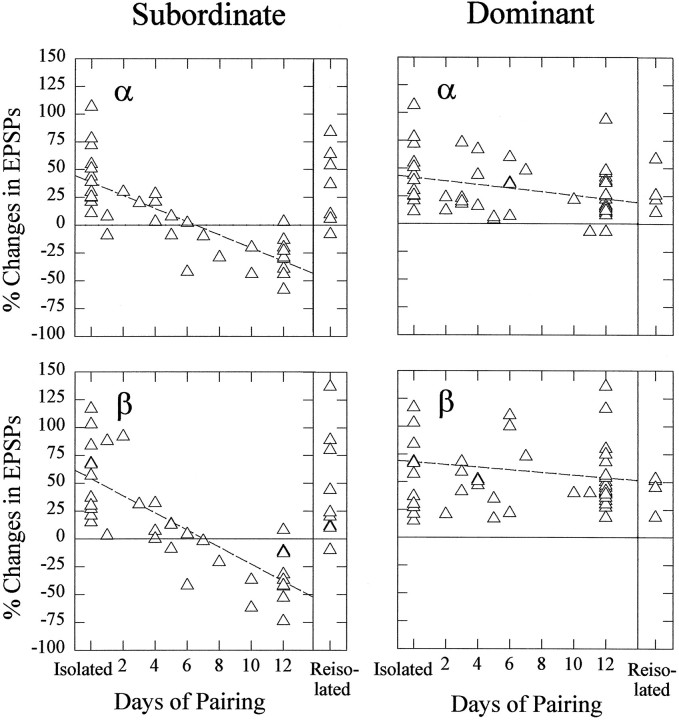
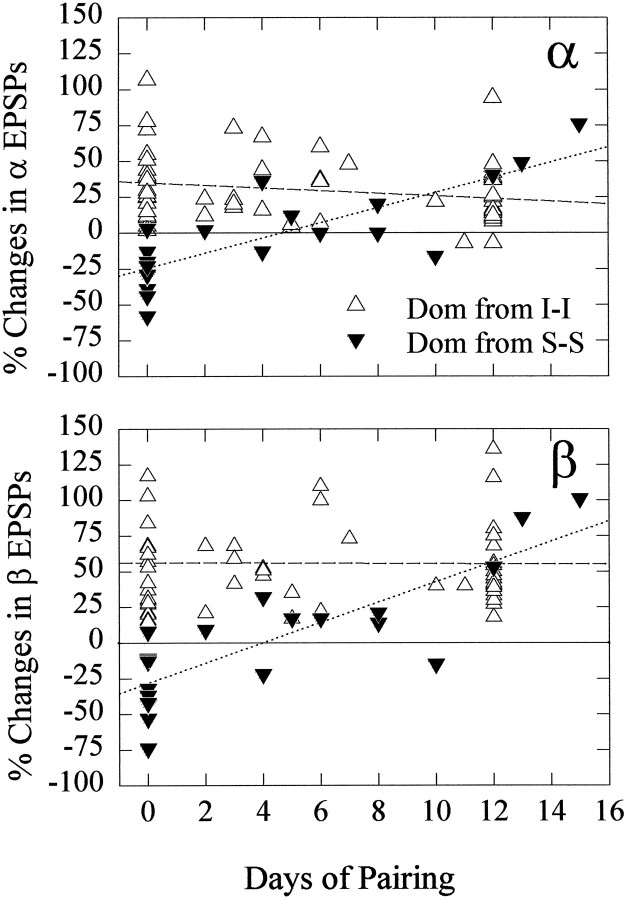
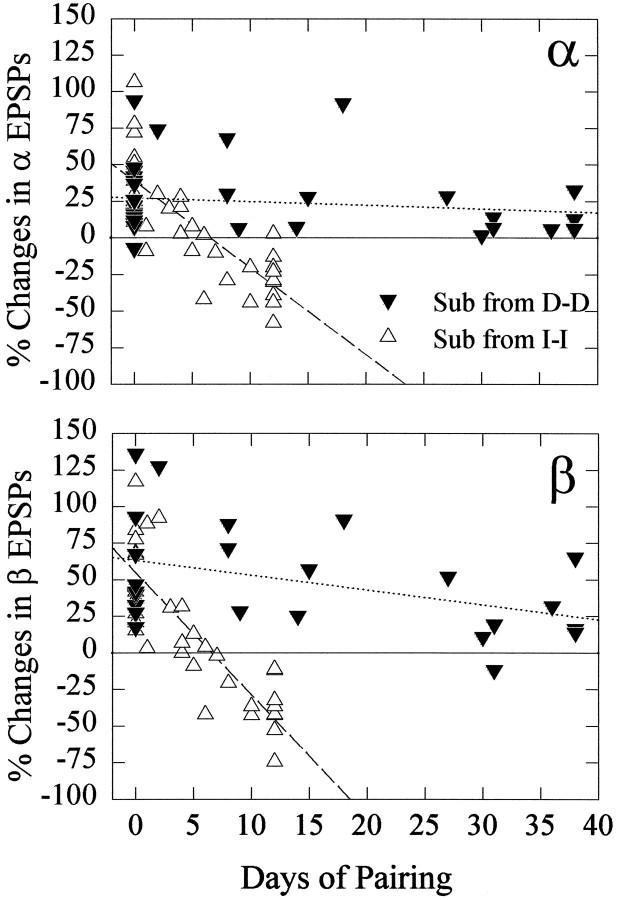
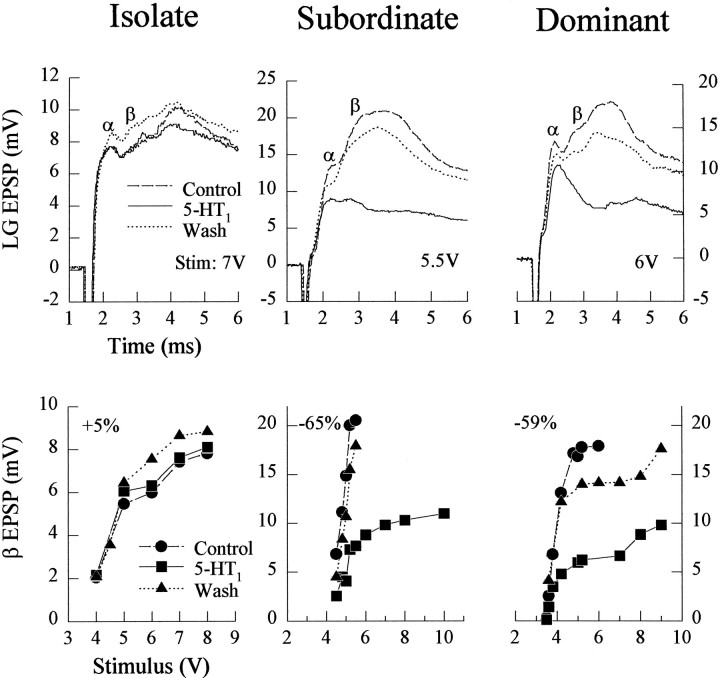
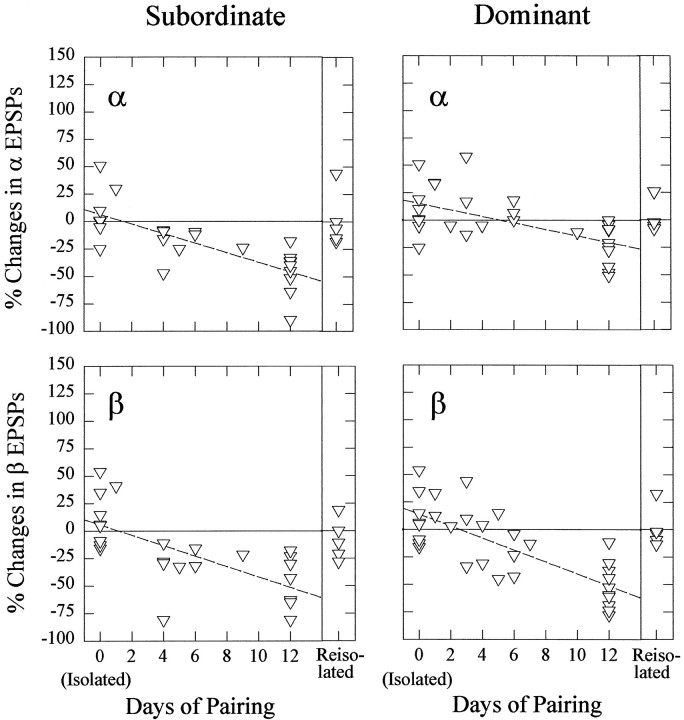
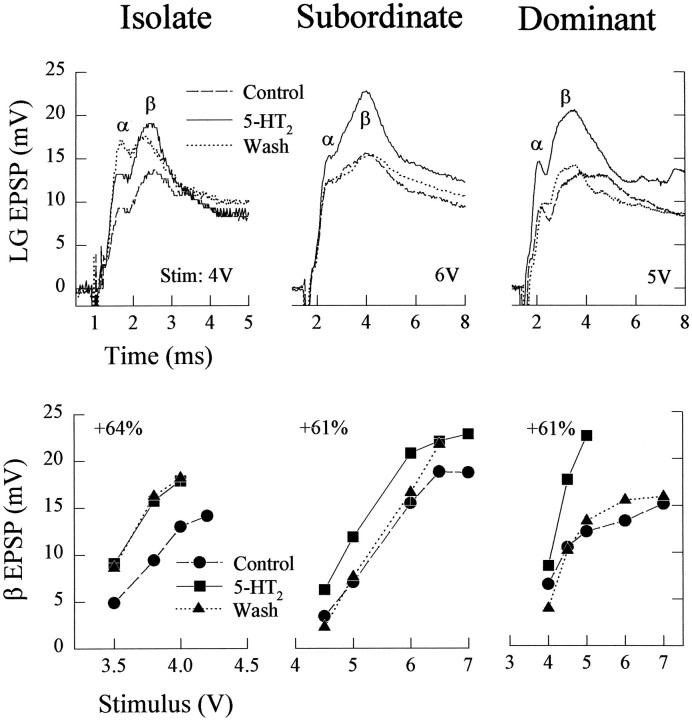
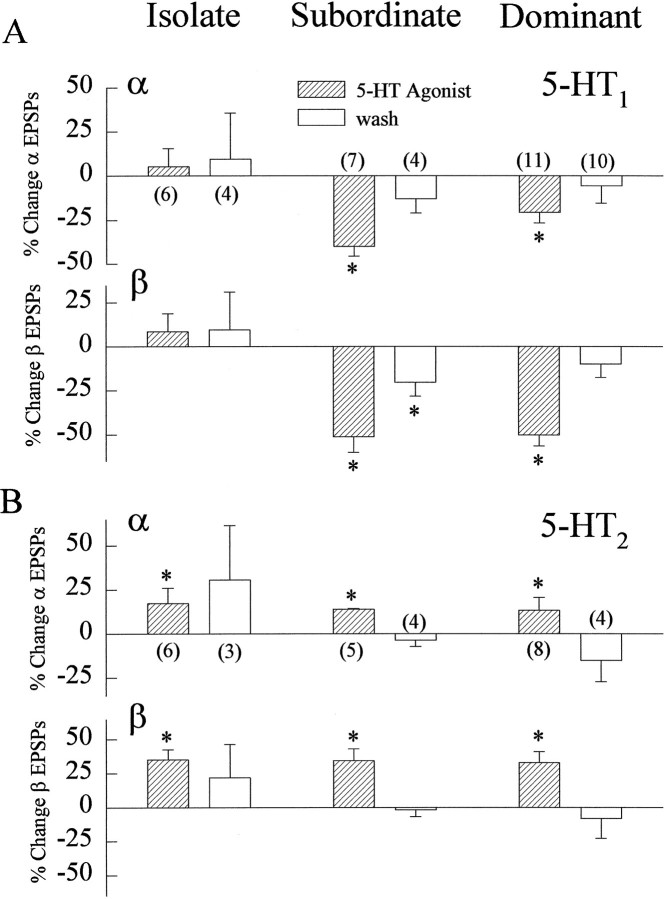
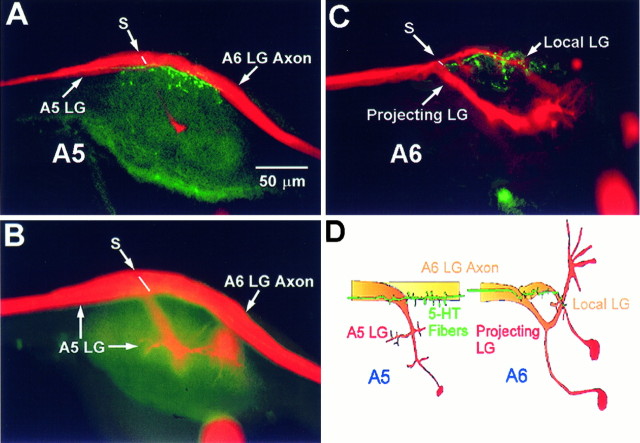
The effect of superfused serotonin (5-HT; 50 microns) on the synaptic responses of the lateral giant (LG) interneuron in crayfish was found to depend on the social status of the animal. In socially isolated animals. 5-HT persistently increased the response of LG to sensory nerve shock. After social isolates were paired in a small cage, they fought and determined their dominant and subordinate status. After 12 d of pairing, 5-HT reversibly inhibited the response of LG in the social subordinate and reversibly increased the response of LG in the social dominant crayfish. The effect of 5-HT changed approximately linearly from response enhancement to inhibition in the new subordinate over the 12 d of pairing. If, after 12 d pairing, the subordinate was reisolated for 8 d, the response enhancement was restored. If the subordinate, instead, was paired with another subordinate and became dominant in this new pair, the inhibitory effect of 5-HT changed to an enhancing effect over the next 12 d of pairing. If, however, two dominant crayfish were paired and one became subordinate, the enhancing effect of 5-HT persisted in the new subordinate even after 38 d pairing. These different effects of serotonin result from the action of two or more molecular receptors for serotonin. A vertebrate 5-HT, agonist had no effect on social isolates but reversibly inhibited the response of LG in both dominant and subordinate crayfish. The inhibitory effects of the agonist developed approximately linearly over the first 12 d of pairing. A vertebrate 5-HT2 agonist persistently increased the response of LG in isolate crayfish and reversibly increased the response of the cell in dominant and subordinate crayfish. Finally, although neurons that might mediate these effects of superfused 5-HT are unknown, one pair of 5-HT-immunoreactive neurons appears to contact the LG axon and initial axon segment in each abdominal ganglion in its projection caudally from the thorax.


Figures

Fig. 1.
Fig. 1.
The tailflip circuit in crayfish, showing convergence of mechanosensory afferents and interneurons on the LG command neuron for tailflip. Hairs and other mechansoreceptors on the abdominal surface project primary afferents into the ventral nerve cord where they excite the LG directly (α) and indirectly through mechanosensory interneurons (β). EPSPs were recorded in the initial axon segment of the LG neuron.
Fig. 2.
Fig. 2.
Responses of isolate, subordinate, and dominant juvenile crayfish to sensory nerve shock before (Control) and during bath application of 50 μm5-HT and after 1 hr saline wash (Wash1 Hr; see Materials and Methods). Top, EPSPs and spikes evoked by the stimulus level indicated and recorded under the three conditions, with the α and β EPSP components labeled. Bottom, β EPSP amplitudes evoked by a range of stimulus intensities delivered to the same animals as in the top. Each value is the average of at least four responses to one stimulus level; the bars indicating ±1 SEM are obscured by the symbols. The Isolate crayfish was tested over the range of stimulus intensities after 1 hr and after 5 hr of saline wash; the other animals were tested only after 1 hr wash. The average percent change in the response for each animal is given in the top left of each panel. The value is the percent change in response produced by 5-HT from the control response, averaged over all subthreshold stimulus levels tested.
Fig. 3.
Fig. 3.
Changes in EPSPs, resting membrane potential, and input resistance of LG produced by superfused 5-HT and after 1 hr saline wash. A, Mean ± SEM percent change of the α (top) and β (bottom) LG EPSPs produced by 5-HT (at either 50 or 100 μm) and by 1 hr saline wash in isolate (left), subordinate (middle), and dominant (right) juvenile crayfish. B, Mean ± SEM change in resting membrane potential (top) and the percent change in input resistance (bottom) produced by 5-HT in isolate (left), subordinate (middle), and dominant (right) crayfish. The number of animals in each experiment is given in parentheses; the same animals were used for α and β measurements in A. Responses that are significantly different than zero are indicated with anasterisk. Those differences are significant atp < 0.05, as indicated by the fact that the difference between the absolute value of the response mean and the absolute value of the 95% confidence limit is greater than zero.
Fig. 4.
Fig. 4.
Effect of 5-HT, 5-HT1 agonist, and 5-HT2 agonist on the stimulus threshold of LG in isolate, dominant, and subordinate juvenile crayfish. The percent change in stimulus threshold was measured as the difference between the stimulus voltage necessary to fire LG in the presence of the agonist and the stimulus voltage required before the drug was applied. Mean ± SEM percent change are shown; responses that are significantly different than zero are indicated with an asterisk. Those differences are significant at p < 0.05, as indicated by the fact that the difference between the absolute value of the response mean and the absolute value of the 95% confidence limit is greater than zero. The number of animals used is given inparentheses.
Fig. 5.
Fig. 5.
Concentration dependence of 5-HT effect on LG EPSPs in social isolate and dominant crayfish. Mean ± SEM percent changes in the β EPSPs in dominant (filled circles) and isolate (open circles) crayfish were calculated from the difference between EPSPs recorded before (control) and after superfusion with either saline (0 m5-HT, −∞ on the abscissa) or a known concentration of 5-HT (from 10−10 to 10−4m).Solid and dashed lines are linear regressions of the β EPSPs from dominant and isolate crayfish, respectively, against the log10[5-HT] concentration from 10−8 to 10−4m (dominant) and 10−10 to 10−4m (isolate).
Fig. 6.
Fig. 6.
Change in the effect of 5-HT on LG EPSP amplitude in isolate, new subordinate, and new dominant crayfish with the duration of subordinate/dominant pairing, and in reisolated crayfish. Left, Percent change in α EPSPs (top) and β EPSPs (bottom) from control levels produced by bath application of 50 μm 5-HT in new subordinates. Change in EPSPs in isolates is shown on theleft of each panel (Isolated); change in EPSPs in animals that have been paired for 12 d or longer and then reisolated for 8 d is shown on theright of each panel (Reisolated).Right, Similar plots of data from new dominant crayfish. Each triangle represents data from one animal.
Fig. 7.
Fig. 7.
Effect of 5-HT on α (top) and β (bottom) LG EPSPs in new dominants produced by pairing subordinate crayfish (Dom from S-S) for periods of time between 2 and 15 d (filled inverted triangles). The change in EPSPs in the 12 d subordinates is replotted at left (0 d of pairing) from Figure 6. The effect of 5-HT on LG EPSPs in dominants derived from pairing isolate crayfish (Dom from I-I) is replotted from Figure 6 for comparison (open triangles). The dottedand dashed lines are linear regressions of thefilled inverted triangles and open triangles, respectively.
Fig. 8.
Fig. 8.
Effect of 5-HT on α (top) and β (bottom) LG EPSPs in new subordinates produced by pairing dominant crayfish (Sub from D-D) for periods of time between 2 and 38 d (filled inverted triangles). The change in EPSPs in the 12 d dominants is replotted at left (0 d of pairing) from Figure 6. The effect of 5-HT on LG EPSPs in subordinates derived from pairing isolate crayfish (Sub from I-I) is replotted from Figure 6 for comparison (open triangles). The dottedand dashed lines are linear regressions of thefilled inverted triangles and open triangles, respectively.
Fig. 9.
Fig. 9.
Effect of vertebrate 5-HT1 agonist mCPP-Cl2 on LG responses to sensory nerve shock in isolate, subordinate, and dominant juvenile crayfish. The experiments and the figure are organized as in Figure 2, with 50 μm5-HT1 agonist substituted for 5-HT.
Fig. 10.
Fig. 10.
Change in the effect of the 5-HT1 agonist mCPP-Cl2 on the amplitudes of α (top) and β (bottom) LG EPSPs in isolate crayfish and in newly paired subordinate (left) and dominant (right) crayfish. Responses of animals that were reisolated for 8 d after 12 d of dominant or subordinate status are shown to the right of each panel. The experiments and the figure are organized as in Figure 6, with 50 μm 5-HT1 agonist substituted for 5-HT.
Fig. 11.
Fig. 11.
Effect of 5-HT2 agonist α-methyl-5-HT on LG responses to sensory nerve shock in isolate, subordinate, and dominant juvenile crayfish. The experiments and the figure are organized as in Figure 2, with 50 μm5-HT2 agonist substituted for 5-HT.
Fig. 12.
Fig. 12.
Effect of 5-HT1 and 5-HT2agonists on LG neuron responses. A, Percent change in α and β LG EPSPs in isolate, subordinate, and dominant crayfish before and during superfusion of 50 μm 5-HT1agonist mCPP-Cl2 and after saline wash for 1 hr.B, Percent change in α and β LG EPSPs in isolate, subordinate, and dominant crayfish before and during superfusion of 50 μm 5-HT2 agonist α-CH3 5-HT and after saline wash for 1 hr. The number of animals used in both sets of experiments is given in parentheses in the top frame of each panel.
Fig. 13.
Fig. 13.
5-HT-like-immunoreactive terminals and the LG neurons. A, The LG neuron in ganglion A5 stained with LuY (false red) and photographed with a confocal attachment (Newport Instruments) laterally in the focal plane of the LG axon, and 5-HT-like-immunoreactive axonal terminals labeled with Texas Red (false green) photographed in the same focal plane as the LG image. The 5-HT-like terminals are restricted to the vicinity of the initial axon segment of the ganglionic LG and to the anterior end of the axon of the next caudal LG (from A6). The septate junction between the two is indicated (S). Similar immunoreactivity is seen in all five anterior abdominal ganglia.B, The same preparation as in A, photographed in the focal plane of LG’s major dendrites in A4. No 5-HT immunoreactivity above background is seen in this plane.C, The local and projecting LG neurons in A6 (red), with the 5-HT-like-immunoreactive terminals (green) on the proximal segment of the both neurons. No label appears near the dendrites of the projecting LG, which receive inputs from mechanosensory interneurons and primary afferents (D). D, Diagram showing the relationship of the LG neurons to the 5-HT neuron in A5 and A6.

References

    1. Albers HE, Rawls S. Coordination of hamster lordosis and flank marking behavior: role of arginine vasopressin within the medial preoptic-anterior hypothalamus. Brain Res Bull. 1989;23:105–109. - PubMed
    1. Beall SP, Langley DJ, Edwards DH. Inhibition of escape tailflip in crayfish during backward walking and the defense posture. J Exp Biol. 1990;152:577–582. - PubMed
    1. Beltz BS, Kravitz EA. Mapping of serotonin-like immunoreactivity in the lobster nervous system. J Neurosci. 1983;3:585–602. - PMC - PubMed
    1. Beltz BS, Kravitz EA. Aminergic and peptidergic neuromodulation in crustacea. J Exp Biol. 1986;124:115–141.
    1. Bernier L, Castellucci VF, Kandel ER, Schwarz JH. Facilitatory transmitter causes a selective and prolonged increase in adenosine 3,5-monophosphate in sensory neurons mediating the gill- and siphon-withdrawal reflex in Aplysia. J Neurosci. 1982;2:1682–1691. - PMC - PubMed

Publication types

MeSH terms

LinkOut - more resources