Comparative Study
. 1997 Jan 15;17(2):804-18.
doi: 10.1523/JNEUROSCI.17-02-00804.1997.

Detection and discrimination of first- and second-order motion in patients with unilateral brain damage

Affiliations
Comparative Study

Detection and discrimination of first- and second-order motion in patients with unilateral brain damage

M W Greenlee et al. J Neurosci. .

Abstract

The present investigation explored the extent to which extrastriate cortex is necessary for various aspects of motion processing and whether the processing of first-order (Fourier) and second-order (non-Fourier) motion involves the same extrastriate cortical regions. Orientation, direction, and speed discrimination thresholds were measured in 21 patients with unilateral damage to the lateral occipital, temporal, or posterior parietal cortex. Their results were compared with those of 14 age-matched control subjects. The stimuli were static random-dot noise patterns, the luminance of which (first-order) or contrast (second-order) was modulated by a drifting sinusoid. Each image was presented at an eccentricity of 5.6 deg in one of the four visual quadrants. The contrasts required to identify orientation and direction were measured in a forced-choice paradigm for three speeds (1.5, 3, and 6 deg/sec). Speed discrimination performance was measured for stimuli presented simultaneously in two of the four quadrants. The results indicate the following: (1) orientation thresholds were increased only slightly in the patients; (2) direction thresholds were modestly elevated, and this effect was more pronounced for second-order stimuli than for first-order stimuli; (3) speed discrimination thresholds were elevated significantly in the patients with lesions in the region bordering superior-temporal and lateral-occipital cortex; and (4) speed discrimination thresholds for first-order stimuli were more elevated than those for second-order stimuli. The results suggest that there is substantial overlap in the cortical areas involved in first- and second-order speed discrimination.


Figures
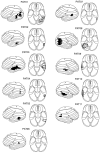
Fig. 1.
Fig. 1.
Schematic representation (lateral and axial views) of the computer tomograms of 11 patients with a lesion in the superior temporal cortex (a) and 10 patients with a lesion in the lateral inferoparietal cortex hemisphere (LIP group, n= 4) or inferotemporal cortex (IT group, n = 6).Dark regions denote the location of the lesion; gray areas depict the medial extent of the lesions. Figure continues.
Fig. 1.
Fig. 1.
Schematic representation (lateral and axial views) of the computer tomograms of 11 patients with a lesion in the superior temporal cortex (a) and 10 patients with a lesion in the lateral inferoparietal cortex hemisphere (LIP group, n= 4) or inferotemporal cortex (IT group, n = 6).Dark regions denote the location of the lesion; gray areas depict the medial extent of the lesions. Figure continues.
Fig. 2.
Fig. 2.
An illustration of the experimental paradigm and the stimuli used to determine orientation and direction identification thresholds and, in a modified form, speed discrimination thresholds (see text).
Fig. 3.
Fig. 3.
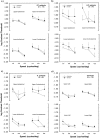
Mean log contrast thresholds for first-order stimuli presented in one of four visual quadrants (upper ipsilesional, upper contralesional, lower ipsilesional, lower contralesional). The results are plotted as a function of reference speed. Open and filled symbols give the mean thresholds for orientation and direction discrimination, respectively. a, Findings for 11 patients with damage in the region of the superior-temporal/occipital border (ST). b, The results for four patients with lateral inferoparietal lesions (LIP). c, The findings for six patients with damage in inferior temporal cortex (IT). d, The results for the 14 control subjects. Error bars show +1 SEM thresholds, averaged over subjects.
Fig. 4.
Fig. 4.
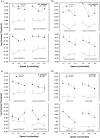
Mean log contrast thresholds for second-order stimuli; otherwise as in Figure 3.
Fig. 5.
Fig. 5.
Mean log contrast thresholds for first-order (a) and second-order (b) stimuli, replotted from Figures 3 and 4 to show the individual variation among the patients and controls. Log thresholds for orientation identification are plotted against the log of the direction discrimination threshold (averaged over speeds and visual quadrants for each participant). The error bars (shown together with the value for PAT06) present the average SEM values (averaged over patients) for both types of judgment.
Fig. 6.
Fig. 6.
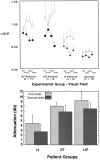
a, Mean speed discrimination performance (ΔV/V) for first-order (open symbols) and second-order (filled symbols) motion as a function of the visual field of presentation (ipsilesional, contralesional, upper, and lower). Error bars show 1 SEM (averaged over subjects and stimulus directions). The results are shown separately for the ST, LIP, and IT groups. The values for the controls are shown to the right. b, The same data expressed in terms of the magnitude of the performance deficit in patients relative to controls. The mean speed discrimination performance for each patient group is shown, separately for first- and second-order, as an attenuation in dB relative to control performance.
Fig. 7.
Fig. 7.
Scatterplot showing the normalized speed discrimination thresholds (z scores) measured for first-order stimuli (abscissa) and the corresponding thresholds determined for second-order stimuli (ordinate). Each patient’s score is depicted by an open symbolcontaining the number assigned to the patient (see Table 1). The solid line shows a slope of 1.0. The regression (b= 0.81 ± 0.1) of second order on first-order zscores was <1.0.
Fig. 8.
Fig. 8.
Computed tomographic map of thez-score-weighted location of the cortical lesions averaged over all 21 patients for first-order and second-order stimuli. Theleft panel shows a lateral view of the 10 computer tomographic slices, and the two right panels show the topographic distribution of the averaged z scores.Light areas signify the lesion locations that were associated with the most pronounced impairments in speed discrimination.

Similar articles

Cited by

References

    1. Adelson EH, Bergen JR. Spatiotemporal energy models for the perception of motion. J Opt Soc Am A. 1985;2:284–299. - PubMed
    1. Albright TD. Direction and orientation selectivity of neurons in visual area MT of the macaque. J Neurophysiol. 1984;52:1106–1130. - PubMed
    1. Baker CL, Hess RF, Zihl J. Residual motion perception in a “motion-blind” patient, assessed with limited lifetime random dot stimuli. J Neurosci. 1991;11:454–461. - PMC - PubMed
    1. Chubb C, Sperling G. Drift-balanced random stimuli: a general basis for studying non-Fourier motion perception. J Opt Soc Am A. 1988;5:1986–2006. - PubMed
    1. Derrington AM, Badcock DR. Separate detectors for simple and complex patterns? Vision Res. 1985;25:1869–1878. - PubMed

Publication types

MeSH terms

LinkOut - more resources