. 1996 Dec 15;16(24):8123-31.
doi: 10.1523/JNEUROSCI.16-24-08123.1996.

Endogenous activation of mu and delta-1 opioid receptors is required for long-term potentiation induction in the lateral perforant path: dependence on GABAergic inhibition

Affiliations

Endogenous activation of mu and delta-1 opioid receptors is required for long-term potentiation induction in the lateral perforant path: dependence on GABAergic inhibition

C R Bramham et al. J Neurosci. .

Abstract

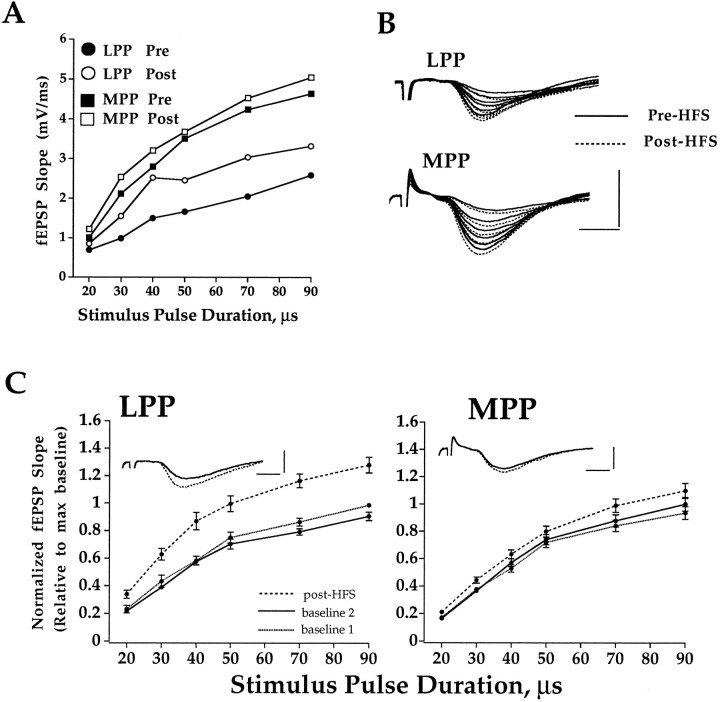
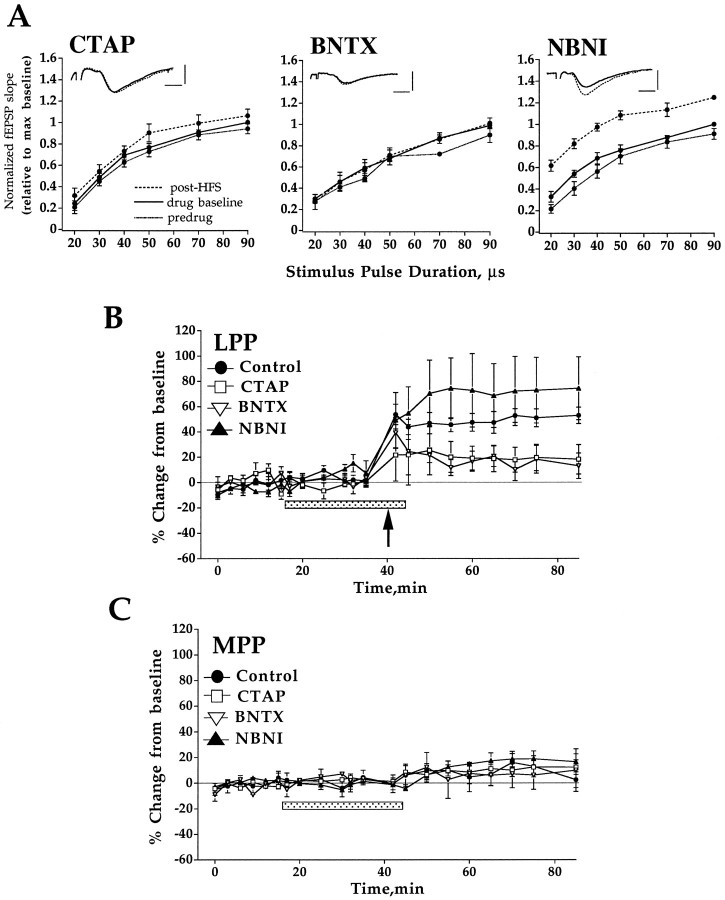
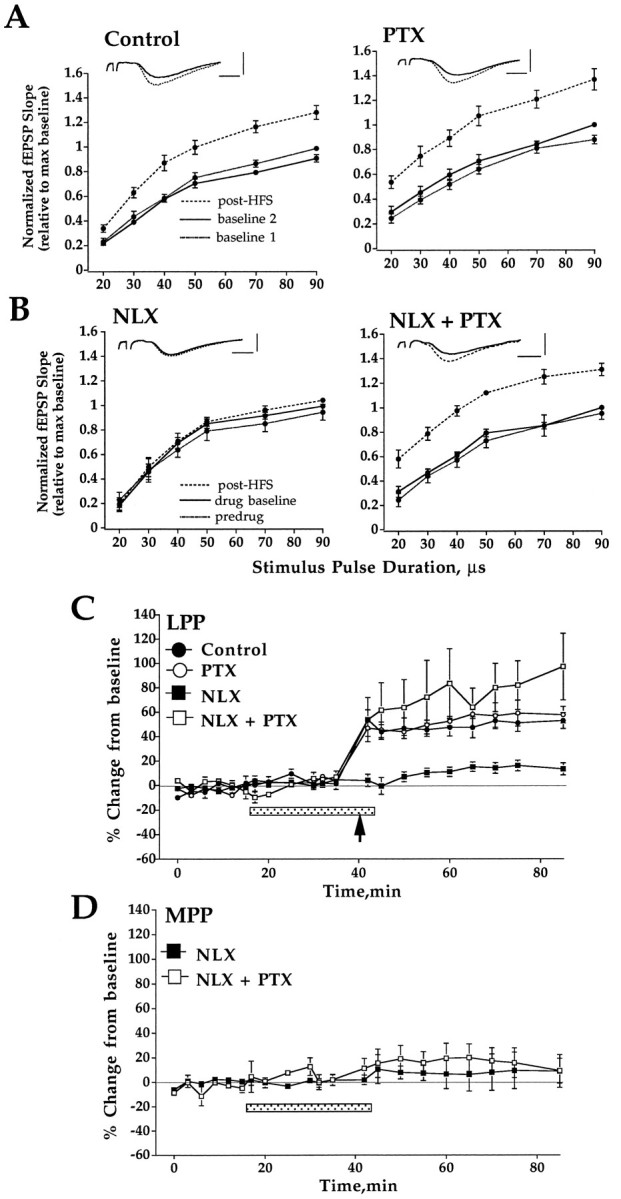
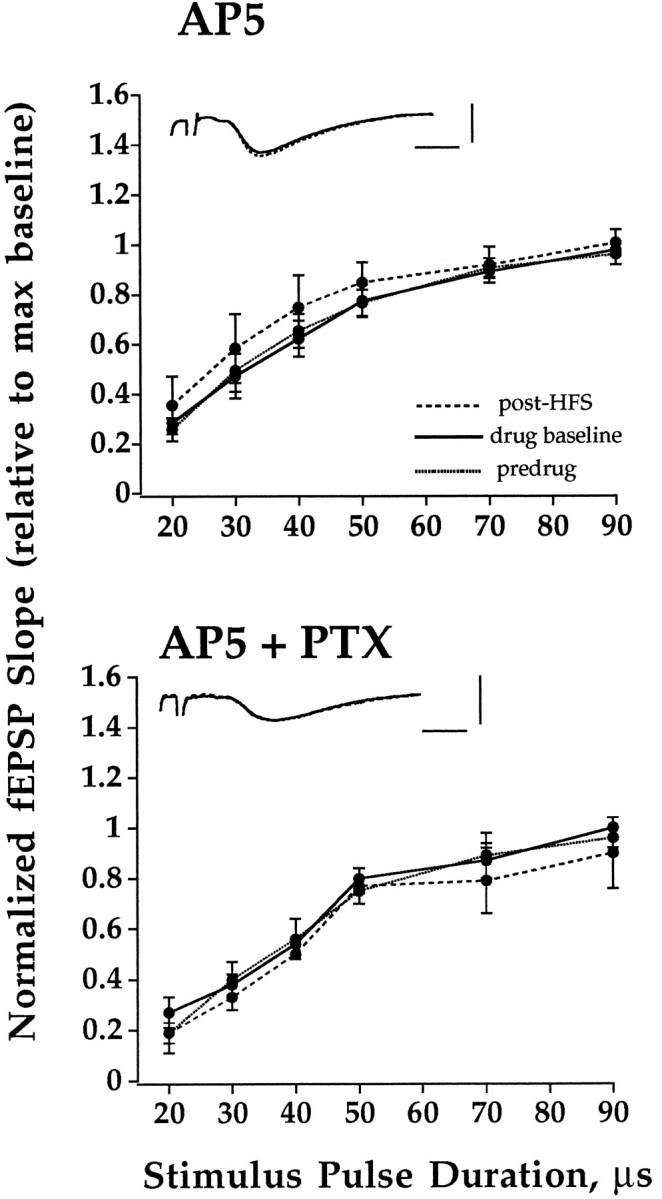
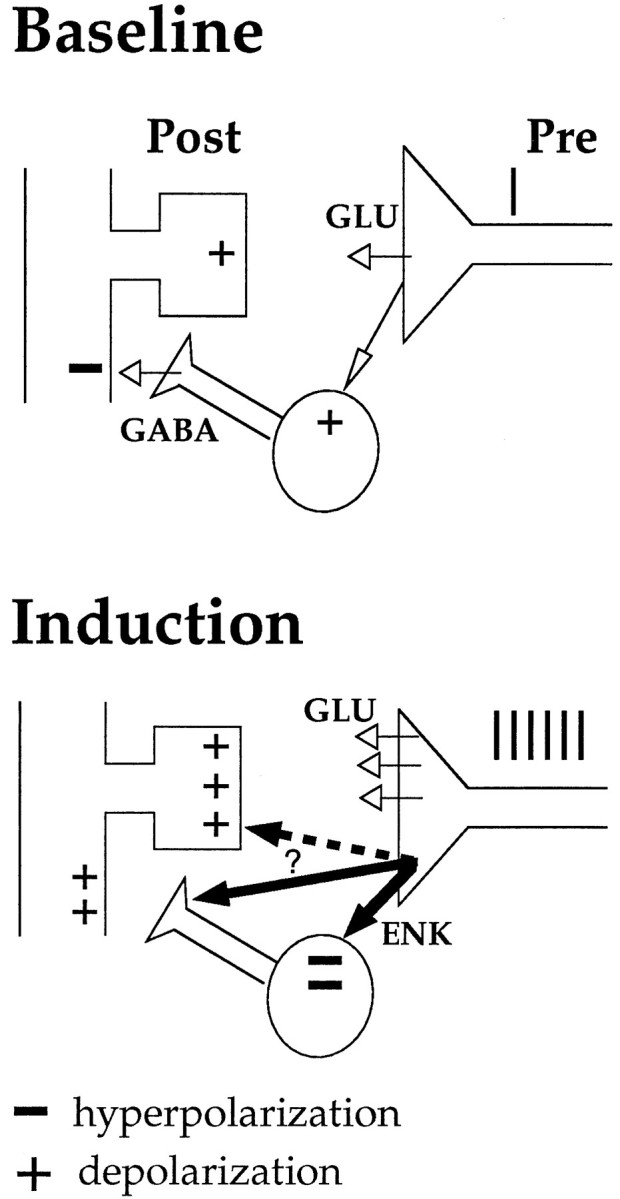
Opioid peptides costored with glutamate have emerged as powerful regulators of long-term potentiation (LTP) induction in several hippocampal pathways. The objectives of the present study were twofold: (1) to identify which opioid receptor types (mu, delta, or kappa) regulate LTP induction at lateral perforant path-granule cell synapses and (2) to test the hypothesis that endogenous opioids regulate LTP induction via modulation of GABAergic inhibition. LTP of lateral perforant path-evoked field EPSPs was induced selectively by high-frequency stimulation applied to the outer third of the molecular layer of the dentate gyrus of rat hippocampal slices. No changes in medial perforant path responses occurred. LTP was blocked when high-frequency stimulation was applied in the presence of the mu receptor antagonist CTAP, the selective delta-1 receptor antagonist BNTX, or the delta-1 and delta-2 receptor antagonist naltrindole. By contrast, the kappa-1 opioid receptor antagonist NBNI had no effect on LTP induction. The role of GABAergic inhibition was investigated by comparing the effect of naloxone on LTP induction in slices maintained in standard buffer and picrotoxin-containing buffer. Naloxone blocked LTP in standard buffer, whereas normal LTP was induced in picrotoxin-treated, disinhibited slices. Finally, NMDA receptor blockade completely inhibited LTP in both standard and disinhibited slices. The results show that mu and delta-1 opioid receptors regulate LTP induction and that this mechanism critically depends on GABAergic inhibition. A key issue then becomes how endogenous opioids fine-tune the activity of intact inhibitory networks in the dentate gyrus, effectively gating synaptic plasticity in specific dendritic strata.


Figures

Fig. 1.
Fig. 1.
Selective induction of LTP in the LPP.A, Representative input–output curves on the basis of LPP and MPP responses obtained before and 40 min after HFS of the LPP. The fEPSP slope is plotted as a function of stimulus pulse duration. Response averages (2 sweeps/average) were collected at six stimulus pulse durations ranging from 20 μsec above fEPSP threshold to 90 μsec above threshold (near the maximum fEPSP slope).B, Field potential traces used to derive input–output curves in A. C, Control group input–output curves. Input–output curves were obtained during perfusion with standard ACSF (baseline 1, dotted line), 20 min after further perfusion in ACSF (baseline 2, solid line), and 40 min after HFS (post-HFS, dashed line) applied to the LPP. fEPSP slope values from each slice are normalized relative to the maximum value on the baseline 2 input–output curve collected immediately before HFS. Plots are mean ± SEM (n = 8). Inset shows representative traces taken before (solid line) and after (dashed line) HFS. Horizontal bar, 2 msec; vertical bar, 3 mV.
Fig. 2.
Fig. 2.
Activation of μ and δ, but not κ-1, opioid receptors is required to induce LTP in the LPP. HFS was applied in the presence of selective antagonists for the μ-opioid receptor (CTAP, 100 nm; n = 6), the δ-1 opioid receptor (BNTX, 100 nm;n = 5), or the κ-1 opioid receptor (NBNI, 60 nm; n = 5).A, Input–output curves obtained during perfusion with standard ACSF (predrug, dotted line), 20 min after addition of drug (drug baseline, solid line), and 40 min after HFS (post-HFS, dashed line). HFS was applied immediately after obtaining the drug baseline input–output curve. Plots are group mean ± SEM of fEPSP slope values normalized relative to the maximum value of the input–output curve collected immediately before HFS. Inset shows representative traces taken before (solid line) and 40 min post-HFS (dashed line). Horizontal bar, 2 msec; vertical bar, 3 mV. The time course of changes in LPP and MPP-evoked fEPSPs is shown in B and C, respectively. Plots are group mean ± SEM changes in fEPSP slope expressed in percentage of baseline. The period of drug perfusion is indicated by the stippled bar, and delivery of HFS to the LPP is indicated by an arrow. CTAP and BNTX both blocked LTP induction. LTP induced in the NBNI group was not significantly different from control. HFS of the LPP had no significant effect on MPP responses (C).
Fig. 3.
Fig. 3.
Opioid peptides regulate LTP induction by a mechanism that depends on GABAergic inhibition. A, HFS was applied in the presence of standard ACSF (control;n = 8) or ACSF containing picrotoxin (PTX, 50 μm; n = 4). Input–output curves were obtained during perfusion with standard or PTX containing ACSF (baseline 1, dotted line), 20 min after further perfusion in this medium (baseline 2, solid line), and 40 min after HFS (post-HFS, dashed line) applied to the LPP. B, HFS was applied in the presence of naloxone (NLX, 5 μm) in slices continuously perfused with standard ACSF (n= 8) or PTX containing ACSF (n = 5). Plots are input–output curves obtained during perfusion with standard or PTX containing ACSF (predrug, dotted line), 20 min after addition of naloxone (drug baseline, solid line), and 40 min after HFS (post-HFS, dashed line). PTX perfusion commenced 80 min before the addition of naloxone.Inset shows representative traces taken before (solid line) and 40 min post-HFS (dashed line). All input–output curves are group mean ± SEM of fEPSP slope values normalized relative to the maximum value of the input–output curve collected immediately before HFS. Horizontal bar, 2 msec; vertical bar, 3 mV. C, Time course of changes in LPP-evoked fEPSPs. Plots are group mean ± SEM changes in fEPSP slope expressed in percentage of baseline. The period of drug perfusion is indicated by the stippled bar, and delivery of HFS to the LPP is indicated by an arrow. Perfusion with PTX abolished the ability of naloxone to block LTP. D, Time course of changes in MPP-evoked fEPSPs after HFS of the LPP in the presence of naloxone in slices perfused in standard ACSF or PTX containing ACSF. Note that LTP was induced selectively in LPP fibers in PTX-containing medium.
Fig. 4.
Fig. 4.
NMDA receptor activation is required to induce LTP of LPP-evoked fEPSPs in both standard and PTX-containing medium. HFS was applied in the presence of AP5 (20 μm) in slices perfused with standard ACSF (n = 9) or PTX containing ACSF (n = 2). Input–output curves were obtained during perfusion with standard or PTX containing ACSF (baseline, dotted line), 20 min after addition of AP5 (drug baseline, solid line), and 40 min after HFS (post-HFS,dashed line). Plots are group mean ± SEM of fEPSP slope values normalized relative to the maximum value of the input–output curve collected immediately before HFS. PTX perfusion commenced 80 min before the addition of AP5. Inset shows representative traces taken before (solid line) and 40 min post-HFS (dashed line). Horizontal bar, 2 msec; vertical bar, 3 mV.
Fig. 5.
Fig. 5.
Schematic depiction of the disinhibition hypothesis of opioid receptor-dependent LTP. During HFS, enkephalins and glutamate are co-released from terminals of the LPP. Enkephalins activate μ- and δ- opioid receptors on GABAergic interneurons, resulting in a transient suppression of GABA release during HFS. The loss of inhibition boosts depolarizing events on granule cells, enabling voltage-dependent events such as NMDA receptor activation. Plus signs (+) represent depolarization; minus signs (−) represent hyperpolarization. The site of enkephalin action (thick arrows) during LTP induction has not been established. Activation of δ receptors located on GABA terminals would afford restricted, local control of inhibition on granule cell dendrites. Activation of opioid receptors located at LPP-granule synapses (dashed arrow) is unlikely to be involved in induction but could still be important in establishing late-phase LTP.

References

    1. Aroniadou VA, Maillis A, Stefanis CC. Dihydropyridine-sensitive calcium channels are involved in the induction of N-methyl-d-aspartate receptor-independent long-term potentiation in visual cortex of adult rats. Neurosci Lett. 1993;151:77–80. - PubMed
    1. Bear MF, Abraham WC. Long-term depression in hippocampus. Annu Rev Neurosci. 1996;19:437–462. - PubMed
    1. Bliss TVP, Collingridge GL. A synaptic model for memory: long-term potentiation in the hippocampus. Nature. 1993;361:31–39. - PubMed
    1. Bramham CR. Opioid receptor-dependent long-term potentiation: peptidergic regulation of synaptic plasticity in the hippocampus. Neurochem Int. 1992;20:441–455. - PubMed
    1. Bramham CR, Sarvey J. Delta and mu opioid receptor activation is required to induce LTP in the lateral perforant path of normal, but not disinhibited, rat hippocampal slices. Soc Neurosci Abstr. 1994;20:623.11.

Publication types