. 1996 Dec 15;16(24):8149-59.
doi: 10.1523/JNEUROSCI.16-24-08149.1996.

Spontaneous discharge and peripherally evoked orofacial responses of trigemino-thalamic tract neurons during wakefulness and sleep

Affiliations

Spontaneous discharge and peripherally evoked orofacial responses of trigemino-thalamic tract neurons during wakefulness and sleep

B E Cairns et al. J Neurosci. .

Abstract

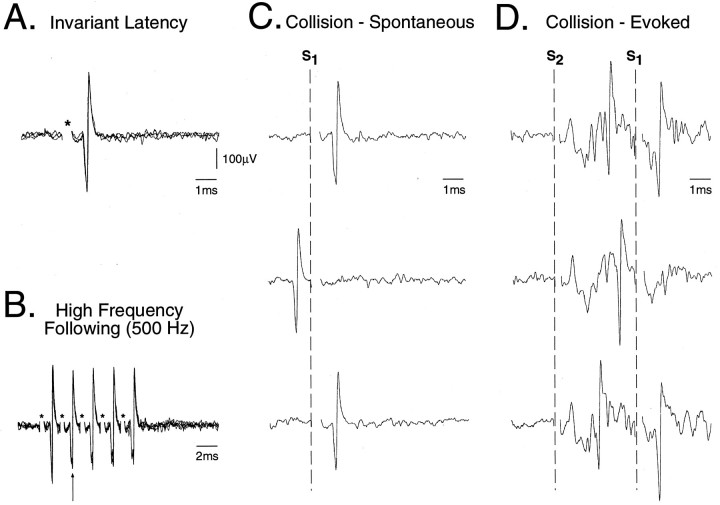
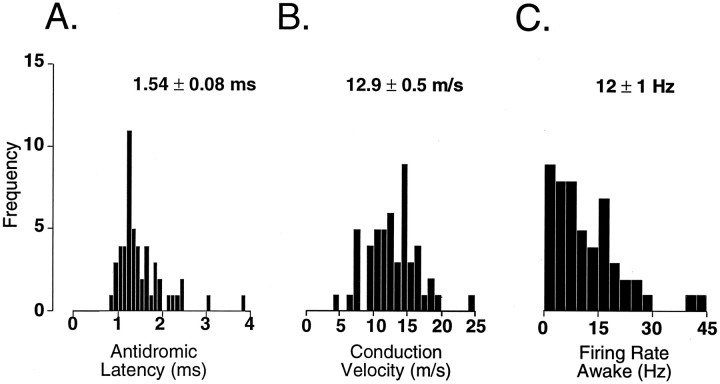
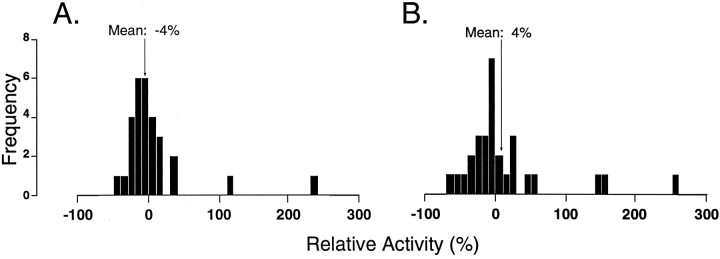
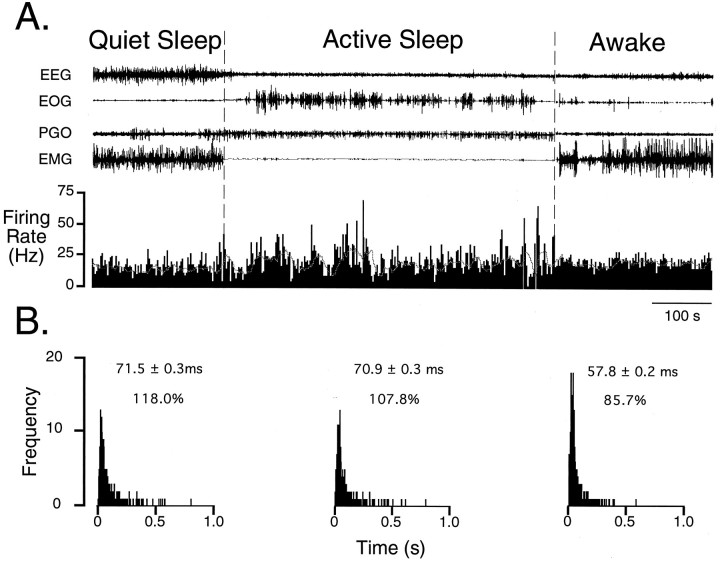
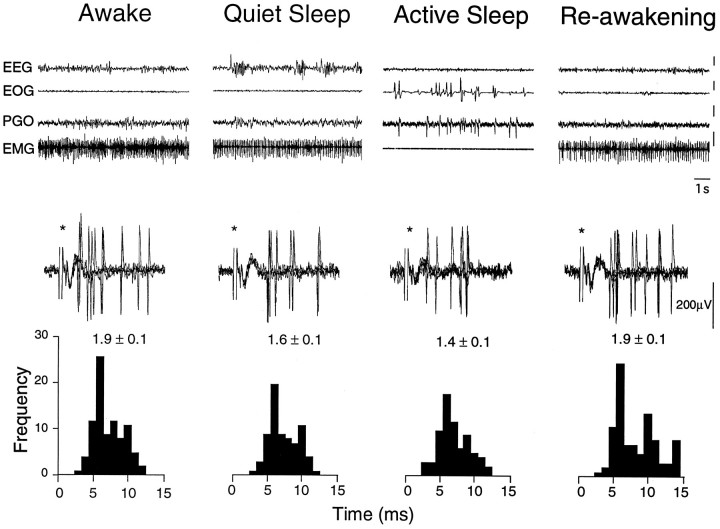
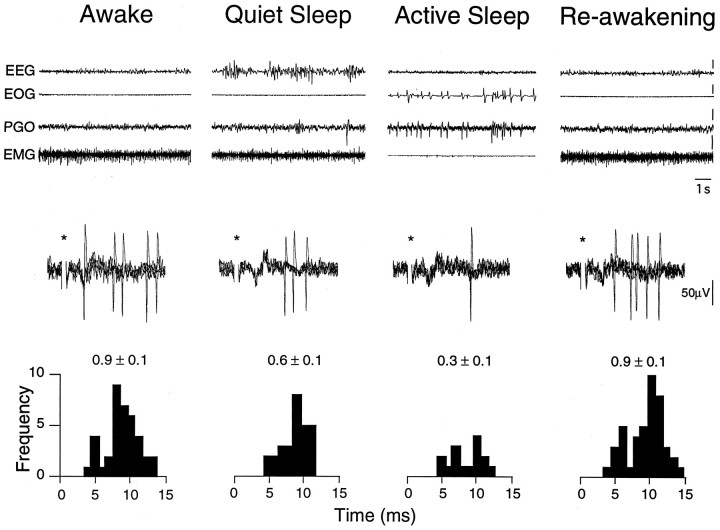
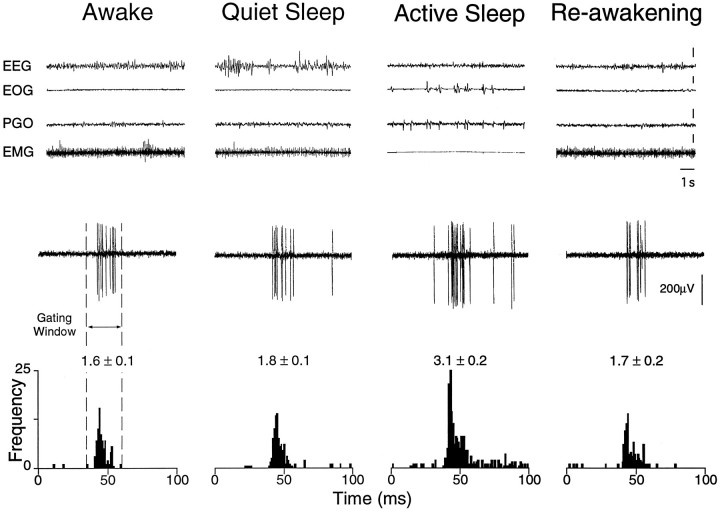
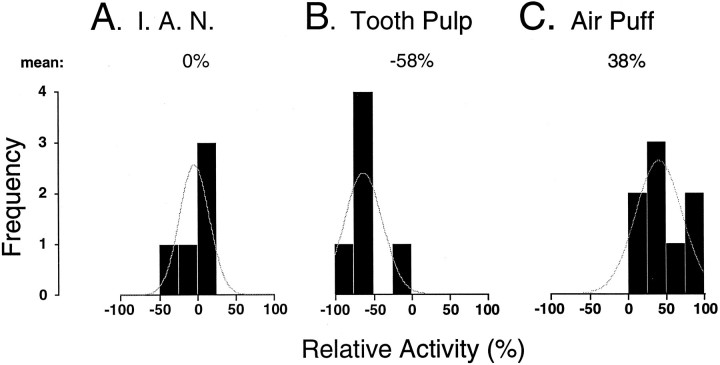
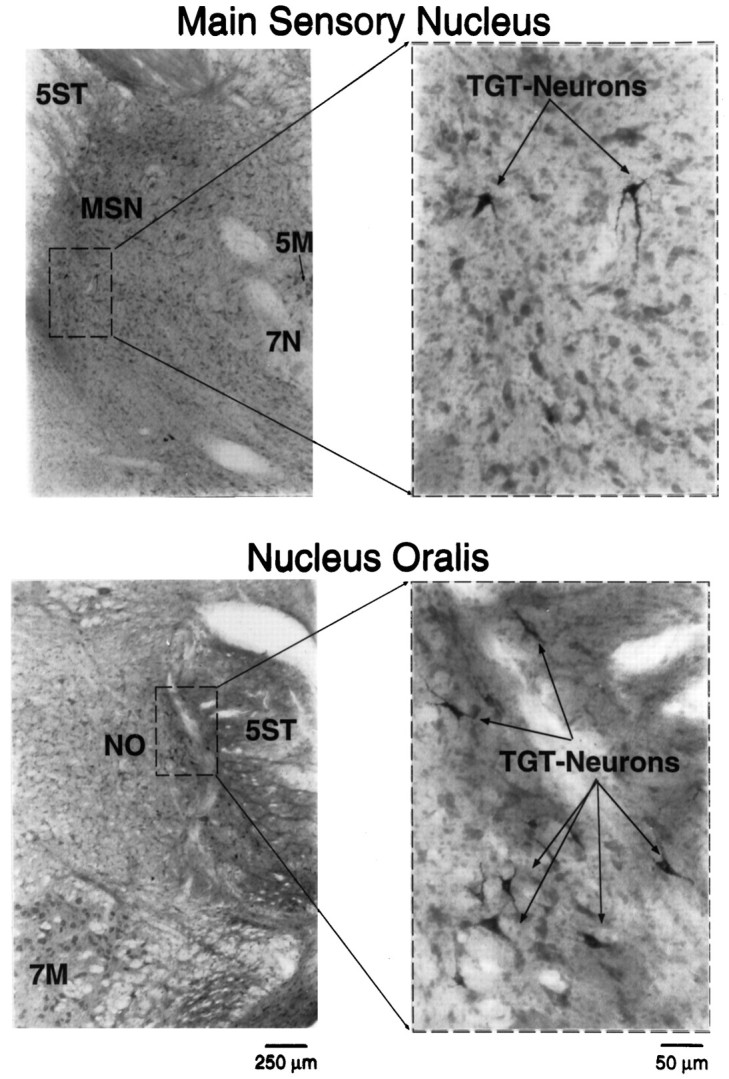
In the present study, ongoing and evoked activity of antidromically identified trigemino-thalamic tract (TGT) neurons was examined over the sleep-wake cycle in cats. There was no difference in the mean spike discharge rate of TGT neurons when quiet sleep (QS) and active sleep (AS) were compared with wakefulness (W). However, tooth pulp-evoked responses of TGT neurons were decreased during AS when compared to W. Conversely, the responses of TGT neurons to air puff activation of facial hair mechanoreceptors reciprocally increased during AS when compared to W. The present data demonstrate that ascending sensory information emanating from distinct orofacial areas is differentially modified during the behavioral state of AS. Specifically, the results obtained suggest that during AS, sensory information arising from hair mechanoreceptors is enhanced, whereas information arising from tooth pulp afferents is suppressed. These data may provide functional evidence for an AS-related gate control mechanism of sensory outflow to higher brain centers.


Figures

Fig. 1.
Fig. 1.
Criteria used to antidromically identify TGT neurons. Five superimposed oscilloscope traces are presented of an antidromic action potential recorded in the rostral trigeminal sensory nuclear complex (TSNC) after stimulation of the thalamus using (A) single pulse (95 μA, 0.1 msec, 1 Hz) and (B) a high-frequency (500 Hz, 5 pulses) train of stimuli. The asterisks in A andB denote the stimulus onset. Consecutive antidromic responses displayed constant latency-to-onset indicating that the action potential resulted from antidromic activation of the axon of the recorded unit. Note that during the high-frequency train inB, a progressive increase in the soma–dendritic conduction time is apparent (arrow), indicating that successive antidromic spikes were generated within the relative refractory period for this cell. Both spontaneous (C) and evoked (D) types of collision are presented. InC, single oscilloscope sweeps illustrate a collision between the antidromic spike and a spontaneous action potential. The sweeps are aligned by the onset of thalamic stimuli (S1) as indicated by the dashed vertical line. In D, single oscilloscope sweeps illustrate a collision between an orthodromically activated action potential evoked by stimulation of the IAN (S2: 0.2 msec, 150 μA) and the antidromic spike. The extracellular field potential evoked by IAN stimulation in D indicates that this neuron was located within the boundaries of the TSNC (Cairns et al., 1995).
Fig. 2.
Fig. 2.
Histograms illustrating the distribution of antidromic latency-to-onset (A), conduction velocity (B), and mean ongoing spike discharge (C) of 51 TGT neurons recorded during the behavioral state of wakefulness. A population mean ± SE is located above each histogram. Calculated means for antidromic latency-to-onset and conduction velocity do not differ from those reported in anesthetized cats (Sessle and Greenwood, 1976; Ro and Capra, 1994); however, unlike TGT neurons recorded in anesthetized cats (Hu et al., 1981; Ro and Capra, 1994), >90% of TGT neurons recorded during wakefulness exhibited ongoing spike activity.
Fig. 3.
Fig. 3.
Histograms depicting the distribution of relative change in spontaneous activity of TGT neurons during (QS;A) and (AS; B) as compared with wakefulness (n = 29 TGT neurons). Relative activity was calculated for each TGT neuron based on the measured firing rate (FR) during sleep and wakefulness, according to the formula 100 × (FRWFRQS or AS)/FRW. Negative values on the abscissa indicate suppression; positive values represent facilitation. For each histogram, there is a normal distribution around zero, indicating that there was no change in ongoing spike discharge of this population of TGT neurons during either QS or AS when compared to W.
Fig. 4.
Fig. 4.
Ongoing spike discharge of a TGT neuron over a sleep/wake cycle. In A, the top four traces represent electroencephalogram (EEG), electro-oculogram (EOG), pontine–occipital–geniculate (PGO) wave, and electromyogram (EMG) activities characteristic of the behavioral states indicated above them. The bottom trace represents a rate meter output of ongoing spike discharge (binwidth 1 msec). The mean firing rate of this cell was 13.9 Hz during quiet sleep (QS), 14.1 Hz during active sleep (AS), and 17.3 Hz during wakefulness (W). Note the occurrence of paroxysmal burst discharges that begins at the onset and continues throughout the state of AS (demarcated by the dashed vertical lines). A sliding average depicted by the dotted hairline (binwidth 15 sec) is superimposed on the rate meter trace to emphasize further the irregular pattern of spike discharge during AS. In B, interspike interval histograms (ISIHs) determined during each state are shown. Compared with W, ISIHs constructed during QS and AS are skewed to the right. This skewing of the ISIH is a result of longer pauses in the firing pattern. Above each ISIH is the mean interval and the coefficient of variation, expressed as a percent. The increased coefficient of variation in quiet and active sleep as compared with wakefulness corroborates the observed paroxysmal burst discharge pattern of spike discharge observed inA.
Fig. 5.
Fig. 5.
Inferior alveolar nerve (IAN)-evoked activity of a TGT neuron during sleep and waking states. The first four traces represent 10 sec epochs of EEG,EOG, PGO, and EMG activity characteristic of wakefulness (W), quiet sleep (QS), and active sleep (AS) and re-awakening (RW). The vertical calibration bars to theright of each trace (EEG, EOG, PGO, EMG) correspond to 50 μV. Bottom, Five overlaid oscilloscope traces illustrate the spike discharge evoked by low-intensity bipolar electrical stimuli (asterisks) applied to the IAN (0.2 msec, 100 μA, 1 Hz). Poststimulus histograms (PSTH) were constructed from 50 consecutive responses. Thenumber above each histogram indicates the mean evoked activity (in spikes per stimulus ± SE). Note that in this neuron, IAN-evoked activity decreased by 16% during QS and 26% during AS compared with W. In addition, the amplitude of the IAN-evoked extracellular field was also decreased (see Cairns et al., 1995).
Fig. 6.
Fig. 6.
Active sleep-related suppression of tooth pulp-evoked TGT neuronal activity. Oscilloscope traces represent behavioral state and neuronal activity as described in Figure 5. PSTHs were constructed from 50 consecutive responses to low-intensity bipolar electrical stimuli applied to the canine tooth pulps (0.2 msec, 12 μA, 1 Hz). The number above each PSTH indicates the mean evoked activity (in spikes per stimulus ± SE). Note that tooth pulp-evoked activity in this neuron was reversibly suppressed by 33% during QS and 67% during AS when compared with W.
Fig. 7.
Fig. 7.
Active sleep-related enhancement of air puff-evoked TGT neuronal activity. Oscilloscope traces represent behavioral state and neuronal activity, respectively, as described in Figure 5. PSTHs were constructed from 50 consecutive responses to a puff of air directed at the ipsilateral face (air puff: 10 msec, 0.5 psi, 0.5 Hz). The number above each histogram indicates the mean evoked activity (in spikes per air puff ± SE). Note that the air puff-evoked activity in this cell remained unchanged during QS; however, during AS, activity was increased by 88% as compared with W.
Fig. 8.
Fig. 8.
Histograms depicting the distribution of relative change in the evoked spike discharge of TGT neurons to different peripheral inputs during active sleep when compared with wakefulness. Negative values on the abscissa indicate suppression; positive values represent facilitation. Note that tooth pulp-evoked responses of TGT neurons were suppressed, whereas the responses to air puff stimuli were enhanced, during active sleep. The curve indicates the distribution of these data around their mean.
Fig. 9.
Fig. 9.
Photomicrographs of TGT neurons located within the rostral TSNC. Stereotaxic coordinates for injection of cholera toxin B subunit conjugated with colloidal gold (1 μl) corresponded to those used for the chronically implanted thalamic stimulating electrode. The photomicrographs to the left illustrate the cytoarchitectural features of the main sensory nucleus (MSN) and nucleus oralis (NO). Thedashed boxes indicate the area of each photomicrograph that was magnified to the right. These higher-power photomicrographs show examples of labeled TGT neurons in each subnucleus. 5M, Trigeminal motor nucleus;7N, facial nerve; 7M, facial motor nucleus; 5ST, spinal trigeminal tract.

References

    1. Amano N, Hu JW, Sessle BJ. Responses of neurons in feline trigeminal subnucleus caudalis (medullary dorsal horn) to cutaneous, intraoral, and muscle afferent stimuli. J Neurophysiol. 1986;55:227–243. - PubMed
    1. Azerad J, Woda A, Albe-Fessard D. Physiological properties of neurons in different parts of the cat sensory complex. Brain Res. 1982;246:7–21. - PubMed
    1. Boissonade FM, Matthews B. Responses of trigeminal brain stem neurons and the digastric muscle to tooth-pulp stimulation in awake cats. J Neurophysiol. 1993;69:174–186. - PubMed
    1. Burton H, Craig AD. Distribution of trigeminothalamic projection cells in cat and monkey. Brain Res. 1979;161:515–521. - PubMed
    1. Bushnell MD, Duncan GH, Dubner R, He LF. Activity of trigeminothalamic neurons in medullary dorsal horn of awake monkeys trained in a thermal discrimination task. J Neurophysiol. 1984;52:170–187. - PubMed

Publication types