. 1996 Dec 15;16(24):8193-207.
doi: 10.1523/JNEUROSCI.16-24-08193.1996.

The influence of auditory and visual distractors on human orienting gaze shifts

Affiliations

The influence of auditory and visual distractors on human orienting gaze shifts

B D Corneil et al. J Neurosci. .

Abstract

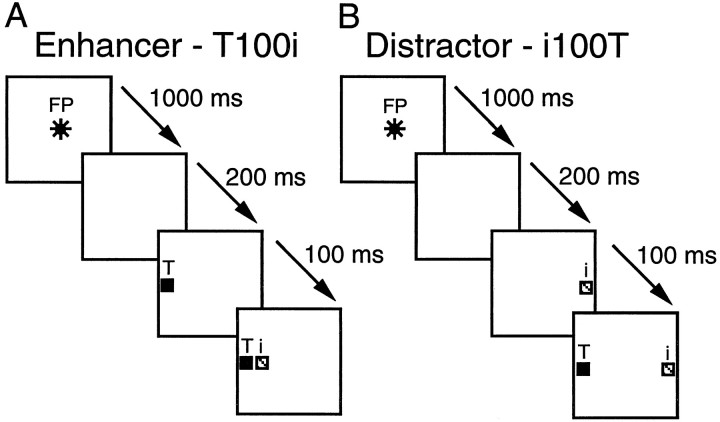
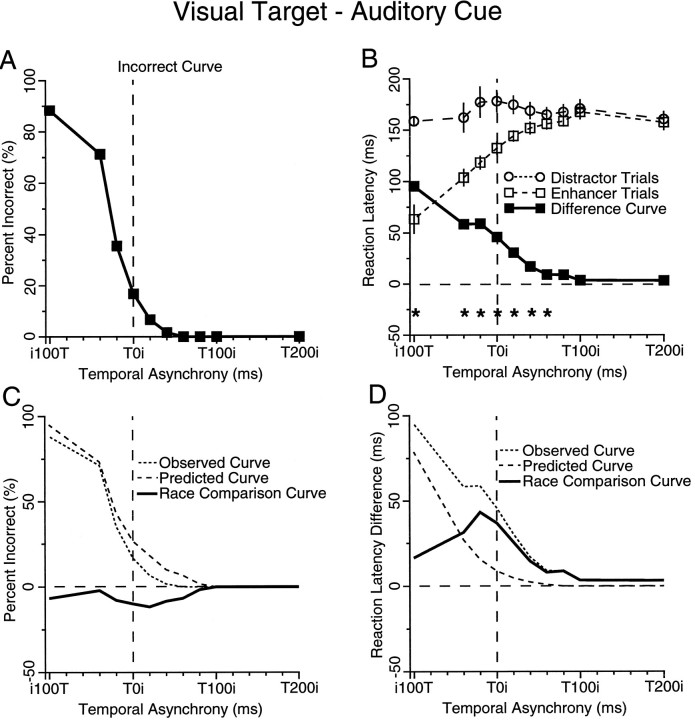
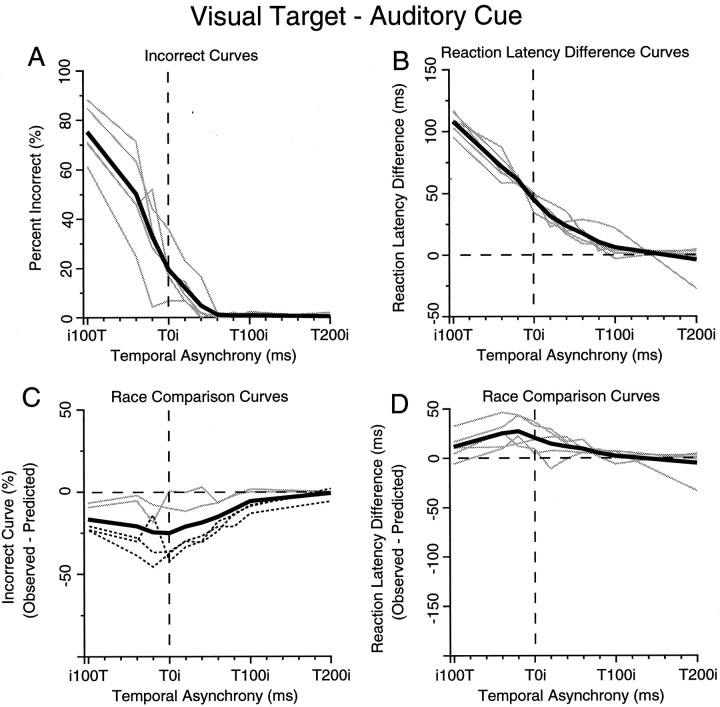
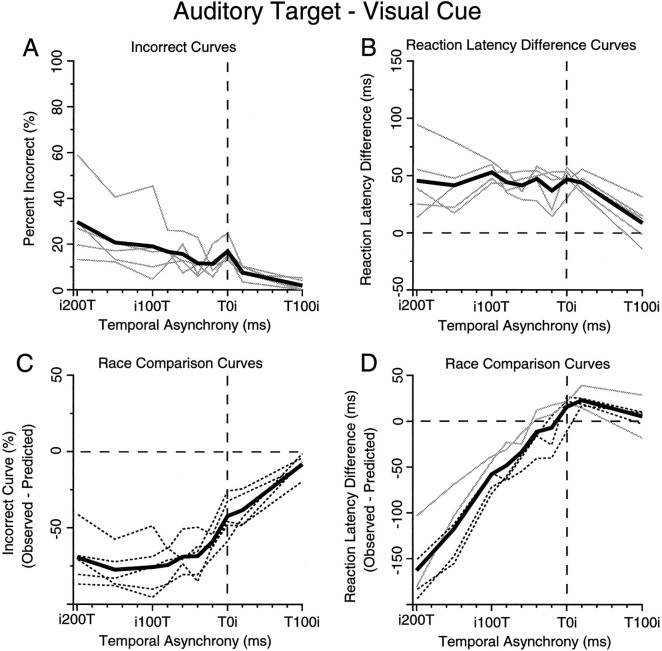
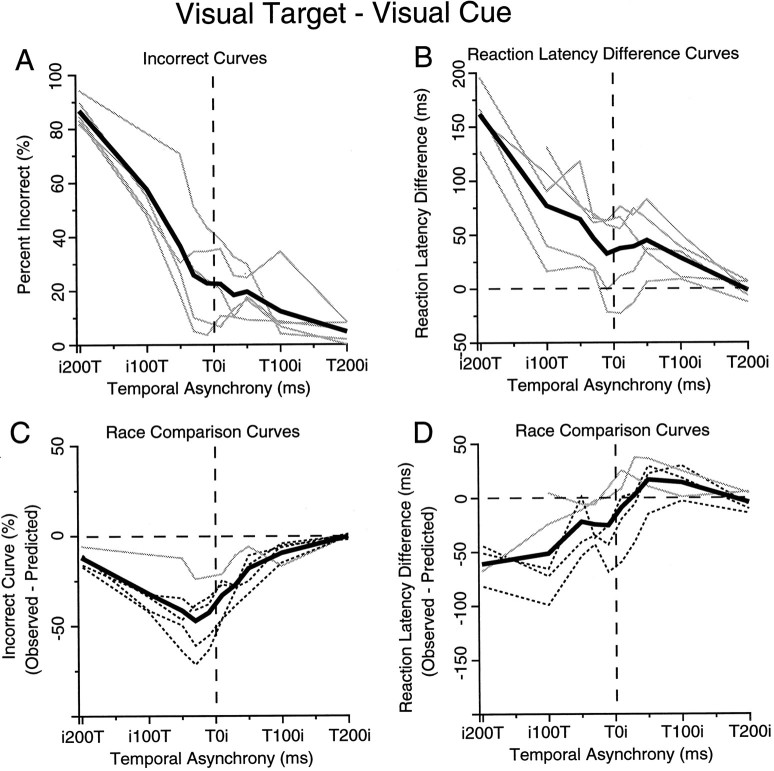
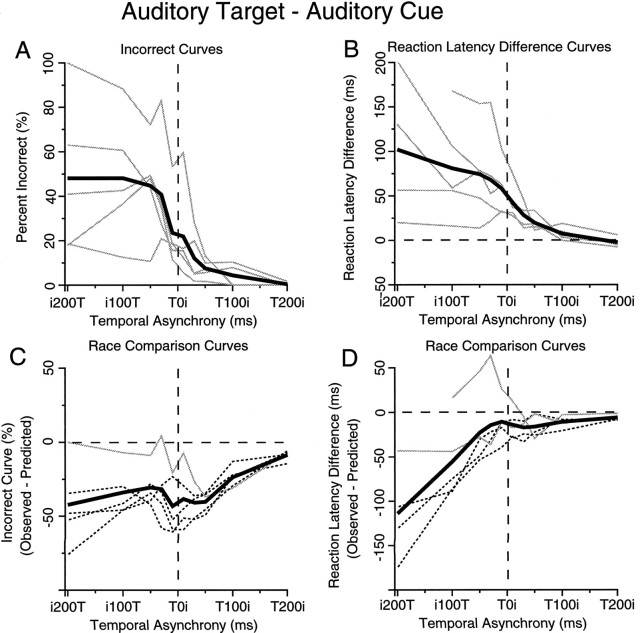
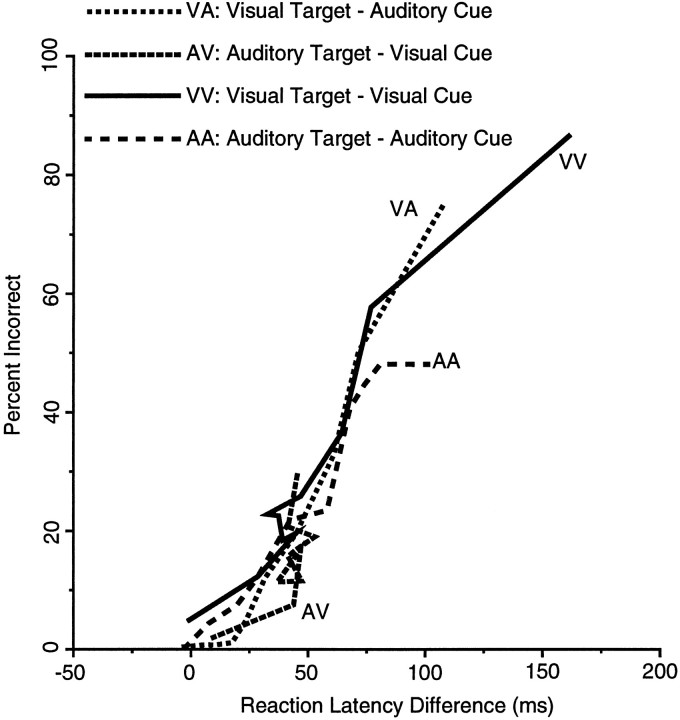
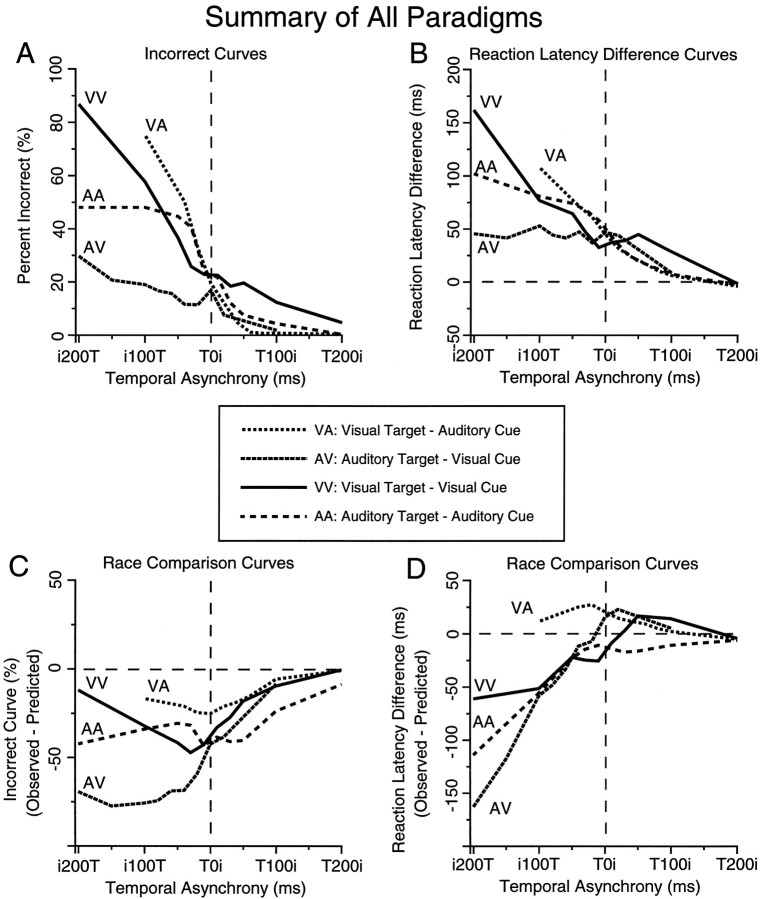
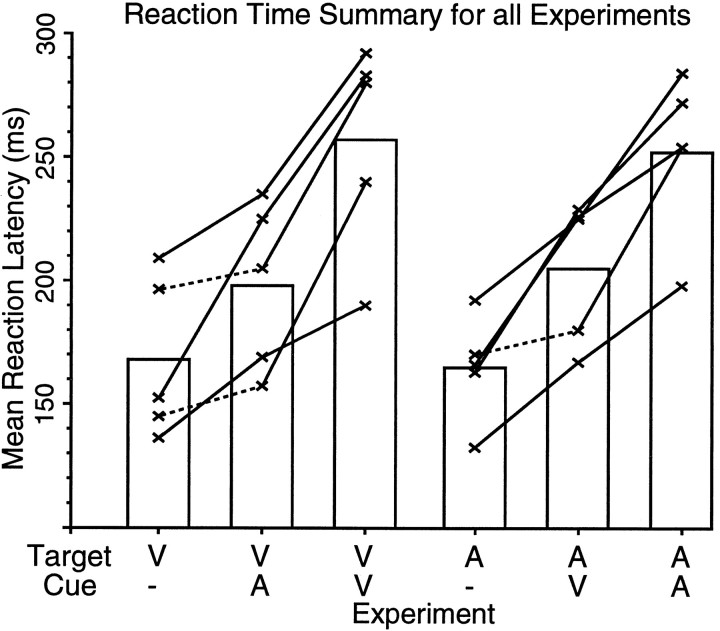
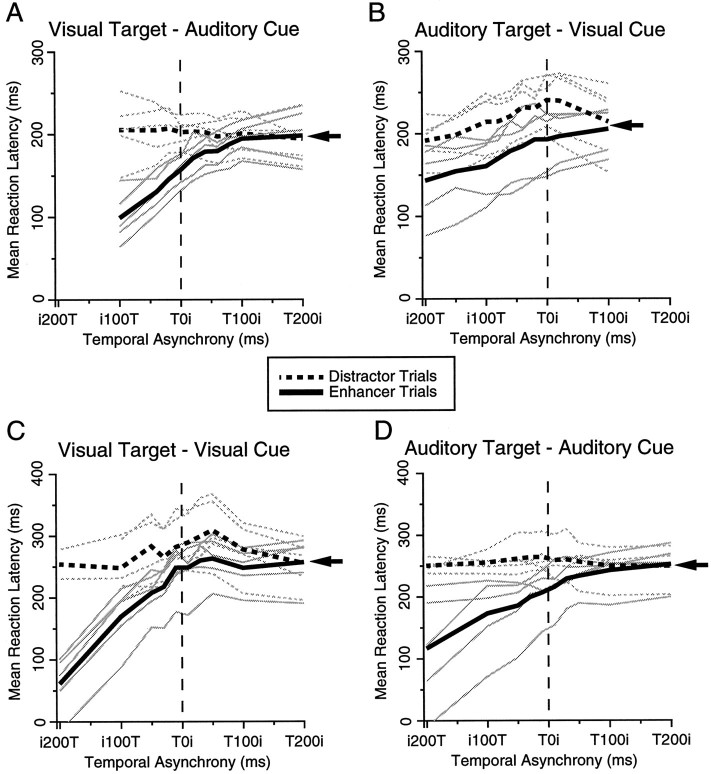
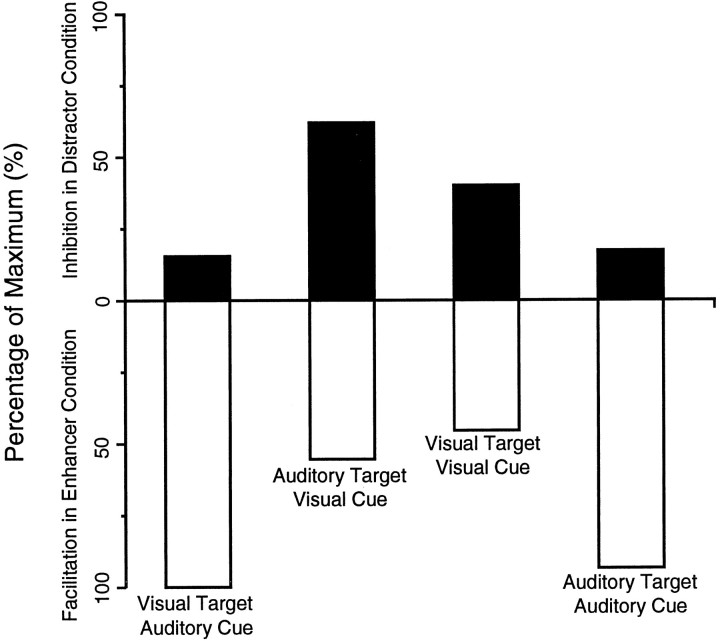
We studied the influences of competing visual and auditory stimuli on horizontal gaze shifts in humans. Gaze shifts were made to visual or auditory targets in the presence of either an irrelevant visual or auditory cue. Within an experiment, the target and irrelevant cue were either aligned (enhancer condition) or misaligned (distractor condition) in space. The times of presentation of the target and irrelevant cue were varied so that the target could have been presented before the irrelevant cue, or the irrelevant cue before the target. We compared subject performance in the enhancer and distractor conditions, measuring reaction latencies and the frequency of incorrect gaze shifts. Performance differed the most when the irrelevant cue was presented before the target and differed the least when the target was presented before the irrelevant cue. Our results reveal that, in addition to the spatial and temporal register of the stimuli, the experimental context in which the stimuli are presented also influences multisensory integration: an irrelevant auditory cue influenced gaze shifts to visual targets differently than an irrelevant visual cue influenced gaze shifts to auditory targets. Furthermore, we observed patterns of influence unique to either visual or auditory irrelevant cues that occurred regardless of the modality of the target. We believe that subjects adopted a state of motor readiness that reflected the unique demands of target selection in each experiment and that this state modulated the influences of the irrelevant cue on the target.


Figures

Fig. 1.
Fig. 1.
A, B, Schematic representation of the experimental protocol. The overlying panels show the temporal progression of stimuli presentation. In all trials, the central fixation point (FP) was presented for 1000 msec and subsequently extinguished 200 msec before peripheral stimulus presentation. In enhancer trials (A), the target (T) and irrelevant cue (i) were presented at the same point in space, whereas in distractor trials (B), the target (T) and irrelevant cue (i) were presented on opposite sides of the fixation point. For T100i intervals (A), the target was presented 100 msec before the irrelevant cue, whereas for i100T intervals (B), the irrelevant cue was presented 100 msec before the target.
Fig. 2.
Fig. 2.
A, B, Cumulative reaction latency distributions for gaze shifts to a target (A) and an irrelevant cue (B). The distribution for the irrelevant cue shown in B is shifted 40 msec earlier than the target distribution for thei40T asynchrony (C) and 40 msec after the target distribution for the T40i asynchrony (D). C, D, The shifted cumulative reaction latency distribution for the irrelevant cue (dotted line) is then added to the cumulative reaction latency distribution for the target (dashed line) to derive the summed distribution (solid line). The predicted percentage of incorrect gaze shifts was calculated as the percentage of gaze shifts in the summed distribution that were driven to the irrelevant cue (C). The predicted reaction latency difference was calculated from the predicted mean reaction latencies for the enhancer and distractor condition, which were obtained from the summed distribution and target distribution, respectively (D).
Fig. 3.
Fig. 3.
Gaze traces from an individual subject in the distractor condition from the visual target/irrelevant auditory cue experiment for four asynchronies: i100T(A), i20T (B),T20i (C), and T100i(D). Upward deflections represent rightward gaze shifts, and downward deflectionsrepresent leftward gaze shifts. In the trials shown, the visual target (T) was located to the right, and its onset is represented by the solid vertical line and upper horizontal bar. The irrelevant auditory cue (i) was located to the left, and its onset is denoted by thevertical dashed line and lower horizontal bar. Solid traces denote correct gaze shifts directed to the visual target, and dashed traces denote incorrect gaze shifts initially directed to the irrelevant auditory cue. Incorrect gaze shifts were generated frequently when the irrelevant auditory cue led the visual target (i100T) and were absent when the visual target was presented well before the irrelevant auditory cue (T100i).
Fig. 4.
Fig. 4.
Single-subject frequency histograms (binwidth 10 msec) for reaction latencies in both enhancer and distractor conditions for four selected temporal asynchronies: i100T(A), i20T (B),T20i (C), and T100i(D) in the visual target/irrelevant auditory cue experiment. Open histograms represent reaction latencies for correct gaze shifts, and open arrows denote the mean reaction latencies for correct gaze shift histograms. Filled inverted histograms represent reaction latencies for incorrect gaze shifts, and filled arrows denote the mean reaction latencies for the incorrect gaze shift histograms. For the construction of these histograms, the total number of movements was taken as the sum of correct and incorrect gaze shifts, and the percentages of correct or incorrect gaze shifts for each bin were derived from this sum.Vertical dashed and solid linescorrespond, respectively, to the onset of the irrelevant cue and the target.
Fig. 5.
Fig. 5.
Summary data (both directions combined) from the analysis of a single subject at all 10 temporal asynchronies tested for the visual target/irrelevant auditory cue experiment. The dashed vertical line in each graph represents when the target and irrelevant cues were presented simultaneously (i.e., at asynchronyT0i). The horizontal dashed line inBD represents the zero level for the appropriate difference curves. A, Plot of the incidence of incorrect gaze shifts to the irrelevant auditory cue in the distractor condition. B, Mean reaction latencies for correct gaze shifts in the distractor condition (open circles, dotted line) and enhancer condition (open squares, dashed line).Bars denote SEM, and asterisks signify asynchronies at which differences in the reaction latencies between the enhancer and distractor conditions were statistically significant (Student’s t test, p < 0.05). Thesolid line with filled squares is the mean reaction latency difference curve, measured as mean distractor reaction latency minus mean enhancer reaction latency.C, Incorrect curves from the observed data (dotted line) and the data predicted by a race model (dashed line). The solid line is the race comparison curve, calculated as the observed incorrect curve minus the predicted incorrect curve. D, Reaction latency differences curves from the observed data (dotted line) and the data predicted by a race model (dashed line). The solid line is the race comparison curve, calculated as the observed reaction latency difference curve minus the predicted reaction latency difference curve. Positive values for the race comparison curves in C and D represent violations of a race model.
Fig. 6.
Fig. 6.
Summary data from the visual target/irrelevant auditory cue experiments. The incorrect curves (A), reaction latency difference curves (B), and race comparison curves for incorrect gaze shifts (C) and reaction latency differences (D) are shown for all five subjects (thin solid or dotted lines) and the sample average (thick solid lines). The thin dotted lines in C and D denote race comparison curves in which the observed subject performance was significantly different from that predicted by the upper limit of a race model (Mann–Whitney Rank Sum test, p < 0.05). Thin solid lines in C andD denote nonsignificant measurements. Dashed vertical lines represent the point at which the two cues were presented simultaneously. Dashed horizontal lines inBD show the zero level for the various difference measurement.
Fig. 7.
Fig. 7.
Summary data for the auditory target/irrelevant visual cue experiment. Same format as in Figure 6.
Fig. 8.
Fig. 8.
Summary data for the visual target/irrelevant visual cue experiment. Same format as in Figure 6. For some subjects, there were not enough correct gaze shifts at certain asynchronies in the distractor condition to compute a representative mean reaction latency. Reaction latency differences were not calculated for these subjects at these asynchronies.
Fig. 9.
Fig. 9.
Summary data for the auditory target/irrelevant auditory cue experiment. Same format as in Figure 6.
Fig. 10.
Fig. 10.
For each temporal asynchrony within each experiment, the average number of incorrect gaze shifts is plotted against the average difference between reaction latencies in the distractor and enhancer conditions. Each line represents the data from one experiment. A linear regression analysis through all 40 data points produced a correlation coefficient of 0.94, a slope of 0.59, and ay-axis intercept of −3.9.
Fig. 11.
Fig. 11.
Summary data plotting incorrect curves (A), reaction latency difference curves (B), and race comparison curves for incorrect gaze shifts (C) and reaction latency differences (D) for the sample averages obtained from each of the four experiments. Asynchronies ranged from when the irrelevant cue was presented 200 msec before the target (i200T) to when the target was presented 200 msec before the cue (T200i). Vertical dashed lines denote synchronous onset of the stimuli, and the horizontal dashed lines in BD denote the zero level for the various difference curves.
Fig. 12.
Fig. 12.
Mean reaction latencies at extreme target-leading-cue asynchronies for all subjects (crosses) and the sample average (bar). The reaction latencies obtained in the enhancer condition at this asynchrony are used because there were no differences between reaction latencies obtained in enhancer and distractor conditions. Results from control conditions (denoted by the dash in theCue row) in which subjects looked at a single target are also shown. Solid or dotted lines link values obtained from each subject in experiments with a visual target (three left columns) and experiments with an auditory target (three right columns). Solid linesdenote differences that were statistically significant (Student’st test, p < 0.05); dotted lines denote differences that were not statistically significant.
Fig. 13.
Fig. 13.
Reaction latencies for correct gaze shifts obtained at all asynchronies in the enhancer condition (solid traces) and distractor condition (dashed traces) for the visual target/irrelevant auditory cue experiment (A), auditory target/irrelevant visual cue experiment (B), visual target/irrelevant visual cue experiment (C), and auditory target/irrelevant auditory cue experiment (D). Data are shown for all five subjects (light traces) and sample average (dark,thick traces). Arrowheads denote the mean reaction latency obtained in the distractor and enhancer conditions at the extreme target-leading-cue asynchrony. Vertical dashed line denotes synchronous onset of the target and irrelevant cue.
Fig. 14.
Fig. 14.
Influence of the irrelevant cue on reaction latencies for correct gaze shifts in the enhancer and distractor conditions. The influence is taken as the area between thei100T and T100i asynchronies lying above the mean reaction latency at the extreme target-leading-cue asynchrony in the distractor condition (filled bars) or below the mean reaction latency at the extreme target-leading-cue asynchrony in the enhancer condition (inverted, open bars) for each of the four experiments (see Fig. 13 for the mean reaction latency at the extreme target-leading-cue asynchronies). All areas were normalized to the largest measurement. The filled bars measure increases in reaction latencies in the distractor condition; the open and inverted barsmeasure decreases in reaction latencies in the enhancer condition.

Similar articles

Cited by

References

    1. Cavegn D. Bilateral interactions in saccade programming: a saccade-latency study. Exp Brain Res. 1996;109:312–332. - PubMed
    1. Corneil BD, Munoz DP. Effects of auditory stimuli on human gaze shifts to visual targets. Soc Neurosci Abstr. 1994;20:1402.
    1. Corneil BD, Munoz DP. Multisensory integration in the control of human gaze shifts. Neural Control Movement. 1996;1:27.
    1. Engelken EJ, Stevens KW. Saccadic eye movements in response to visual, auditory and bisensory stimuli. Avia Space Environ Med. 1989;60:762–768. - PubMed
    1. Ferrera VP, Lisberger SG. Attention and target selection for smooth pursuit eye movements. J Neurosci. 1995;15:7472–7484. - PMC - PubMed

Publication types

LinkOut - more resources