

Effects of population and affluence on CO2 emissions
- PMID: 8990181
- PMCID: PMC19273
- DOI: 10.1073/pnas.94.1.175
Effects of population and affluence on CO2 emissions
Abstract
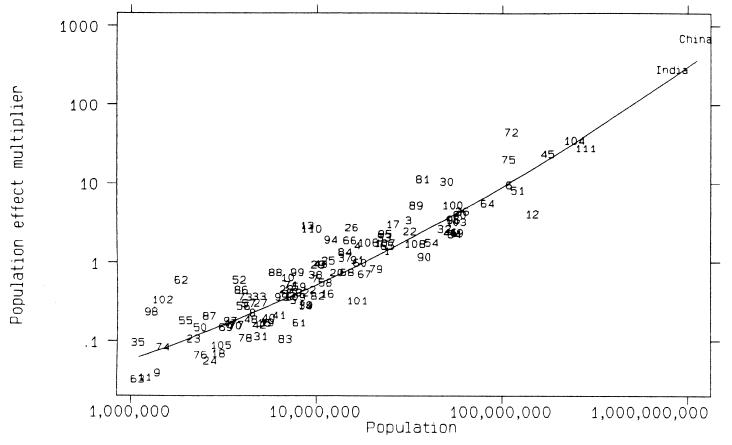
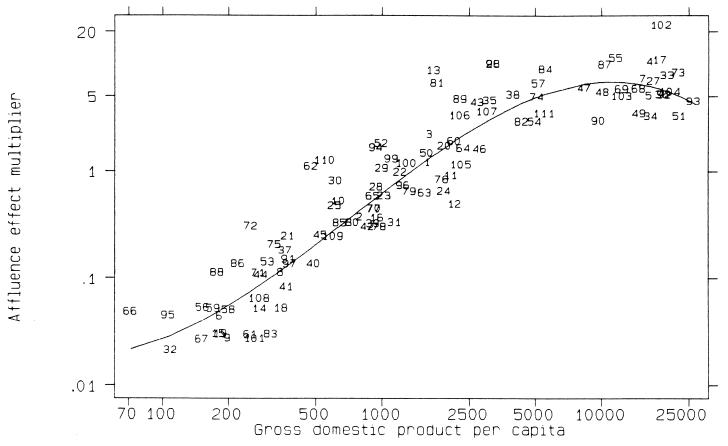
We developed a stochastic version of the Impact = Population x Affluence x Technology (IPAT) model to estimate the effects of population, affluence, and technology on national CO2 emissions. Our results suggest that, for population, there are diseconomies of scale for the largest nations that are not consistent with the assumption of direct proportionality (log-linear effects) common to most previous research. In contrast, the effects of affluence on CO2 emissions appear to reach a maximum at about $10,000 in per- capita gross domestic product and to decline at higher levels of affluence. These results confirm the general value of the IPAT model as a starting point for understanding the anthropogenic driving forces of global change and suggest that population and economic growth anticipated over the next decade will exacerbate greenhouse gas emissions.
Figures
References
-
- Houghton J T, Jenkins G J, Ephraums J J. Climate Change: The IPCC Assessment. Cambridge, U.K.: Cambridge Univ. Press; 1990.
-
- Intergovernmental Panel on Climate Change. Climate Change: The IPCC Response Strategies. Washington, DC: Island; 1991.
-
- Stern P C, Young O R, Druckman D. Global Environmental Change: Understanding the Human Dimensions. Washington, DC: Natl. Acad. Press; 1992.
-
- Dowlatabadi H, Morgan M G. Science. 1993;259:1813. , 1932. - PubMed
-
- Stern P C. Science. 1993;260:1897–1899. - PubMed
Publication types
MeSH terms
Substances
LinkOut - more resources
Full Text Sources
Other Literature Sources
