. 1997 Jan 7;94(1):227-32.
doi: 10.1073/pnas.94.1.227.

Interleukin (IL) 1beta, IL-1 receptor antagonist, IL-10, and IL-13 gene expression in the central nervous system and anterior pituitary during systemic inflammation: pathophysiological implications

Affiliations

Interleukin (IL) 1beta, IL-1 receptor antagonist, IL-10, and IL-13 gene expression in the central nervous system and anterior pituitary during systemic inflammation: pathophysiological implications

M L Wong et al. Proc Natl Acad Sci U S A. .

Abstract

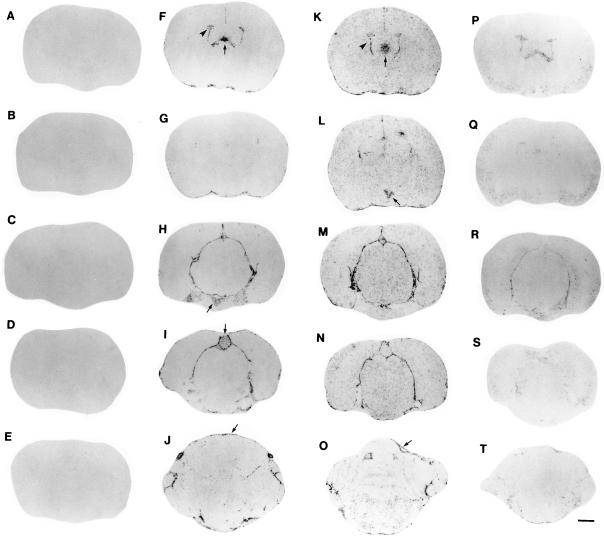
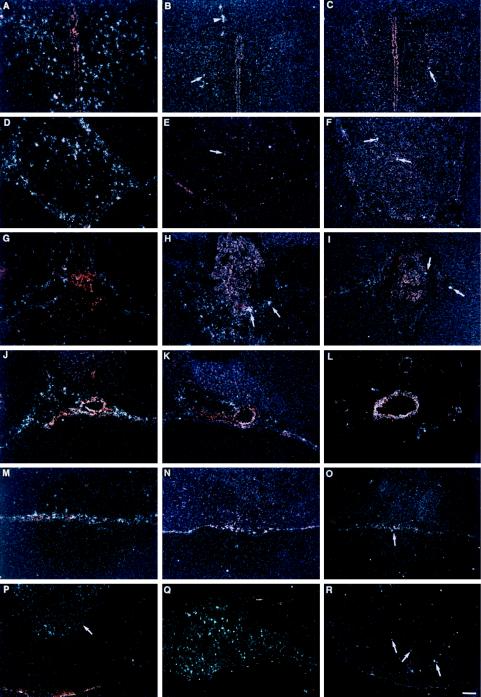
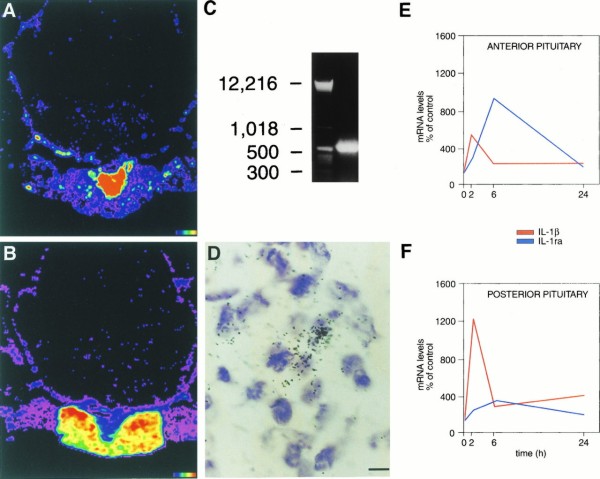
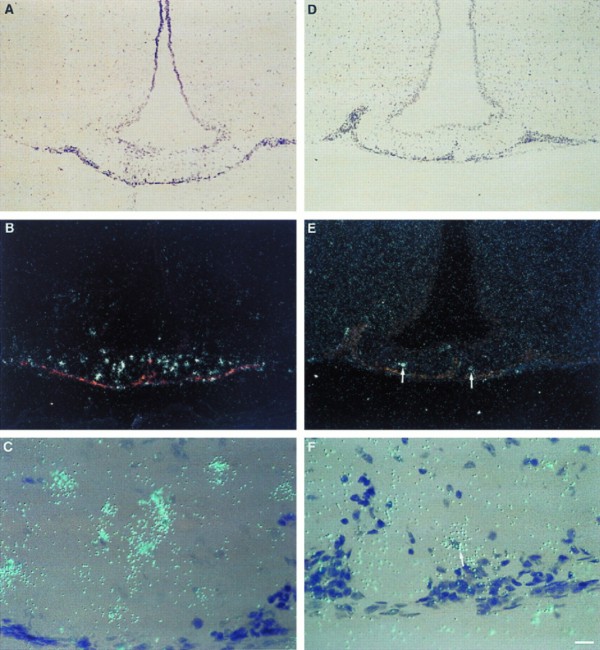
The pathophysiology of systemic inflammation and sepsis involves peripheral organs, causing gastrointestinal, renal, and cardiovascular alterations, as well as the central nervous system (CNS), affecting sleep, temperature regulation, behavior, and neuroendocrine function. The molecular basis of the CNS effects of systemic inflammation are not fully elucidated. Here we show that the CNS responds to systemic inflammation with pronounced IL-1beta gene expression and limited IL-1 receptor antagonist (IL-1ra), IL-10, and IL-13 gene expression. This pattern occurs throughout the CNS, including areas such as the subfornical organ, pineal gland, neurohypophysis, and hypothalamus. In contrast, in the anterior pituitary, we found limited IL-1beta gene expression but marked induction of the mRNA encoding for the secreted isoform of IL-1ra, secreted IL-1ra. We conclude that the central manifestations of peripheral inflammation are mediated by endogenous brain IL-1beta synthesized during systemic inflammation in the context of limited central cytokine counter regulation of IL-1. As IL-1beta is a potent stimulus for inducible nitric oxide synthase expression and activity, these findings explain our previous observation that systemic inflammation promotes inducible nitric oxide synthase gene expression in the brain and the spillover of NO metabolites into cerebrospinal fluid. The CNS transcription of the HIV-1 replication factor IL-1beta in the context of limited transcription of the IL-1 replication inhibitors IL-1ra, IL-10, and IL-13 might help explain the negative impact of systemic inflammation on the clinical course of AIDS. In addition, we propose that IL-1ra may be secreted by the anterior pituitary as a systemic anti-inflammatory hormone that is released in response to IL-1beta originated from multiple sources.


Figures

Figure 1
Figure 1
Localization of IL-1β mRNA in the rat brain by ISHH after treatment with LPS. In Figs. 1, 2, 3, 4, 5 images are representative of findings in six animals/group. A series of film autoradiographs is arranged from rostral to caudal (top to bottom), showing the regional pattern of IL-1β gene expression. Brain slices are shown in the first column (AE) represent the hybridization of IL-1β antisense riboprobe in the brain of control rats, showing no detectable IL-1β mRNA. Two hours after a single LPS injection i.p. (5.0 mg/animal), the induction of IL-1β mRNA the brain is shown in the second column (FJ). There was induction of IL-1β mRNA in the choroid plexus (arrowhead in F) and subfornical organ (arrow in F), posterior pituitary (arrow in H), pineal (arrow in I), and meninges (arrow in J). Six hours after a single LPS injection, the induction of IL-1β throughout the brain is shown in the third column (KO). There was a remarkable induction of IL-1β mRNA in the paraventricular nucleus of the hypothalamus (arrow in L); the induction in the choroid plexus (arrowhead in K), meninges (arrow in O), and in the subfornical organ (arrow in K) persists. Twenty-four hours after a single LPS injection the levels of IL-1β mRNA throughout the rat brain were considerably decreased (fourth column, PT). (Bar = 1.3 cm.)
Figure 2
Figure 2
Differential IL-1β, IL-1ra, and IL-10 gene expression in rat brain and pituitary following LPS treatment. A series of darkfield images show brain regions hybridized with a 35S-labeled rat antisense riboprobes for IL-1β (first column: A, D, G, J, M, and P), for IL-1ra (second column: B, E, H, K, N, and Q), and for IL-10 (third column: C, F, I, L, O, and R) after LPS treatment. Strong induction of IL-1β mRNA is evident in several brain regions, whereas the induction of IL-1ra mRNA and IL-10 mRNA is considerably less visible. Images represent the peak of mRNA induction after treatment with LPS for each of the areas shown in this figure. The following brain regions are shown: paraventricular nucleus of the hypothalamus (AC), pineal gland (DF), choroid plexus (GI), vessels located in the ventral aspect of the brain (JL), meninges (MO), and pituitary gland (PR). Arrow in P points to the posterior pituitary; all other arrows help discriminate cells that have increased mRNA levels of either IL-1ra or IL-10. Arrowhead in B points to vascular structure. White dots represent silver grains overlying mRNA. (Bar = 160 μm in PR, and 80 μm in AO.)
Figure 3
Figure 3
Induction of IL-1β mRNA and IL-1ra mRNA in the pituitary after LPS treatment. Computer-generated pseudocolor images are shown in A for IL-1β and in B for IL-1ra; images show peak induction of IL-1β mRNA 2 h after LPS administration (A) and of IL-1ra mRNA 6 h after LPS administration (B). Note that IL-1β mRNA induction occurs predominantly in the posterior pituitary (A) and that IL-1ra mRNA induction occurs predominantly in the anterior pituitary (B). (C) Photograph of an agarose gel containing RT-PCR product of RNA obtained from pituitaries of rats treated with LPS 6 h after i.p. injection. The gel showed a single band of the expected size (≈537 bp) for sIL-1ra; cloning and sequencing of the PCR product confirmed the specific sequence of sIL-1ra (16, 22). (D) High magnification image of IL-1ra mRNA hybridization in the anterior pituitary; black dots represent silver grains overlying IL-1ra mRNA. (E and F) Graphics show the time course for the induction of IL-1β mRNA (red line) and IL-1ra mRNA (blue line) in the anterior pituitary (E) and in the posterior pituitary (F) at 0, 2, 6, and 24 h after LPS administration, using quantitative densitometry from autoradiographic images. Using ANOVA with post hoc correction we found that both in the anterior and in the posterior pituitary increases in mRNA levels over time-matched control values were significant for IL-1β at the 0.0001 level at 2 h and at the 0.05 level at 6 and 24 h, and for IL-1ra at the 0.05 level at 2 h and at the 0.0001 level at 6 h; at 24 h IL-1ra mRNA levels were the same in LPS and saline-treated groups. (Color scale for A and B: black indicates background and red indicates areas of highest hybridization levels. Bar = 5 μm in D.)
Figure 4
Figure 4
Induction of IL-1β mRNA and IL-1ra mRNA in the median eminence (ME) after treatment with i.p. LPS. IL-1β mRNA is shown in the first column (AC), and IL-1ra mRNA is shown in the second column (DF). There is a remarkable induction of IL-1β mRNA in the ME after LPS administration, while the induction of IL-1ra mRNA is present, but substantially less intense. The time points shown, 2 h for IL-1β (AC) and 6 h for IL-1ra (DF), represent the peak of mRNA induction in the ME for IL-1β and IL-1ra, respectively. Low magnification darkfield pictures of the ME are depicted in B and E, the corresponding brightfield pictures are depicted in A and D. C and F show high magnification pictures of the ME. White dots (B and E) or blue dots (C and F) represent silver grains overlying mRNA; arrow in F points to a cell overexpressing IL-1ra mRNA. (Bar = 70 μm in A, B, D, E, and 9 μm in C and F.)
Figure 5
Figure 5
Induction of IL-1β mRNA in the arcuate nucleus of the hypothalamus 6 h after i.p. LPS treatment. Low magnification darkfield image (A) and high magnification image (B) are shown. White dots (A) or blue dots (B) represent silver grains overlying IL-1β mRNA. (Bar = 85 μm in A and 11 μm in B.)

References

    1. Rothwell N J, Hopkins S J. Trends Neurosci. 1995;18:130–136. - PubMed
    1. Zheng H, Fletcher D, Kozak W, Jiang M, Hofmann K J, Conn C A, Soszynski D, Grabiec C, Trumbauer M E, Shaw A, Kostura M J, Stevens K, Rosen H, North R J, Chen H Y, Tocci M J, Klugger M J, van der Ploeg L H T. Immunity. 1995;3:9–19. - PubMed
    1. Alcamí A, Smith G L. Proc Natl Acad Sci USA. 1996;93:11029–11034. - PMC - PubMed
    1. Miller L C, Lynch E A, Isa S, Logan J W, Dinarello C A, Steere A C. Lancet. 1993;341:146–148. - PubMed
    1. Brunetti L, Volpe A R, Ragazzoni E, Preziosi P, Vacca M. Life Sci. 1996;58:PL373–PL377. - PubMed

Publication types