

Models of DNA structure achieve almost perfect discrimination between normal prostate, benign prostatic hyperplasia (BPH), and adenocarcinoma and have a high potential for predicting BPH and prostate cancer
- PMID: 8990196
- PMCID: PMC19308
- DOI: 10.1073/pnas.94.1.259
Models of DNA structure achieve almost perfect discrimination between normal prostate, benign prostatic hyperplasia (BPH), and adenocarcinoma and have a high potential for predicting BPH and prostate cancer
Abstract
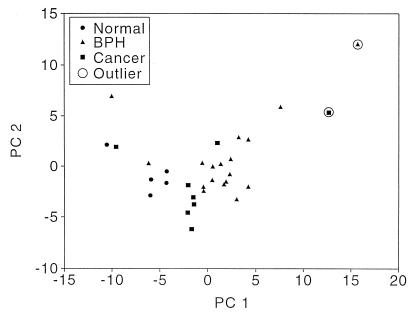
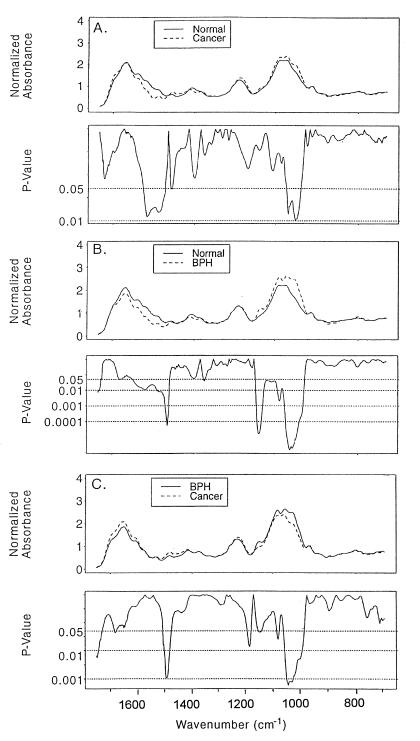
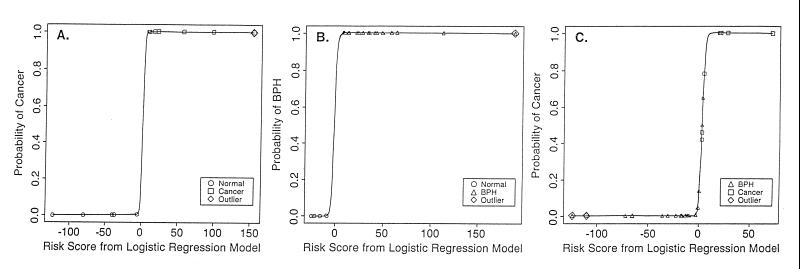
In our previous studies of DNA, wavenumber-absorbance relationships of infrared spectra analyzed by principal components analysis (PCA) were expressed as points in space. Each point represented a highly discriminating measure of structural modifications that altered vibrational and rotational motion, thus changing the spatial orientation of the points. PCA/Fourier transform-infrared technology has now provided a virtually perfect separation of clusters of points representing DNA from normal prostate tissue, BPH, and adenocarcinoma. The findings suggest that the progression of normal prostate tissue to BPH and to prostate cancer involves structural alterations in DNA that are distinctly different. The hydroxyl radical is likely a major contributor to these structural alterations, which is consistent with previous studies of breast cancer. Models based on logistic regression of infrared spectral data were used to calculate the probability of a tissue being BPH or adenocarcinoma. The models had a sensitivity and specificity of 100% for classifying normal vs. cancer and normal vs. BPH, and close to 100% for BPH vs. cancer. Thus, the PCA/Fourier transform-infrared technology was shown to be a powerful means for discriminating between normal prostate tissue, BPH and prostate cancer and has considerable promise for risk prediction and clinical application.
Figures
References
-
- Kirby R S, Christmas T J, Brawer M. Prostate Cancer. London: Mosby; 1996.
-
- Isaacs W B, Bova G S, Morton R A, Bussemakers M J G, Brooks J D, Ewing C M. Cancer Surv. 1995;23:19–32. - PubMed
-
- Winter M L, Liehr J G. Toxicol Appl Pharmacol. 1996;136:211–219. - PubMed
-
- Halliwell B, Aruoma O I. FEBS Lett. 1991;281:9–19. - PubMed
-
- Feig D I, Reid T M, Loeb L A. Cancer Res. 1994;54:1890s–1894s. - PubMed
Publication types
MeSH terms
Substances
LinkOut - more resources
Full Text Sources
Other Literature Sources
Medical
