. 1997 Jan 7;94(1):316-21.
doi: 10.1073/pnas.94.1.316.

Surface dynamics in living acinar cells imaged by atomic force microscopy: identification of plasma membrane structures involved in exocytosis

Affiliations

Surface dynamics in living acinar cells imaged by atomic force microscopy: identification of plasma membrane structures involved in exocytosis

S W Schneider et al. Proc Natl Acad Sci U S A. .

Abstract

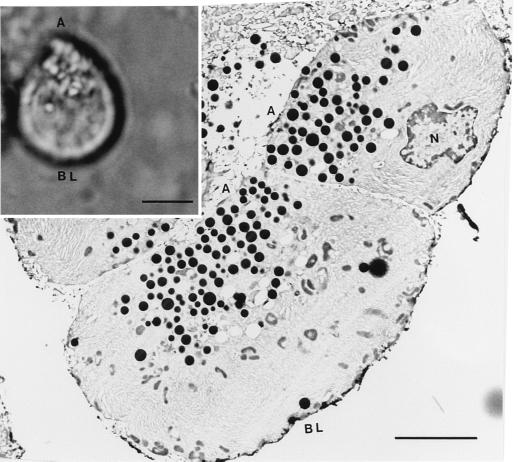
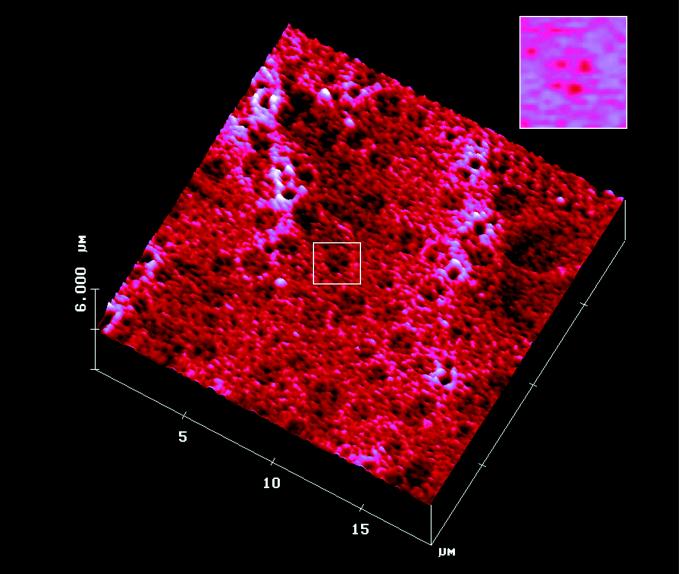
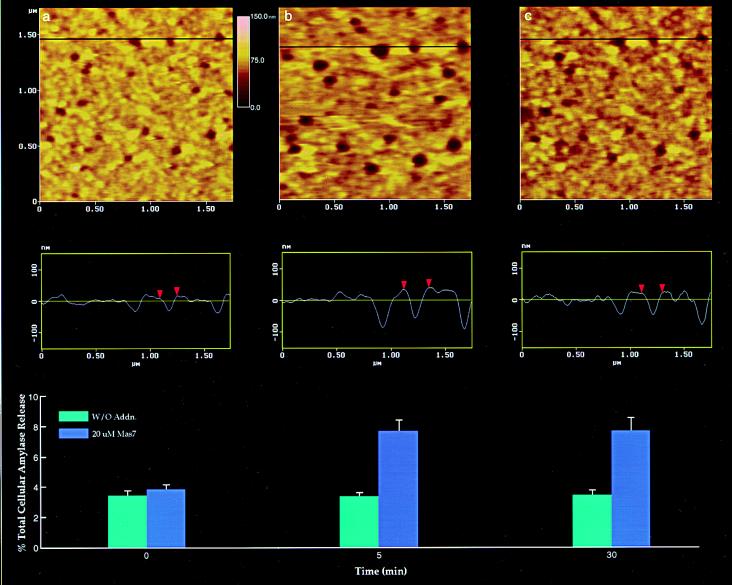
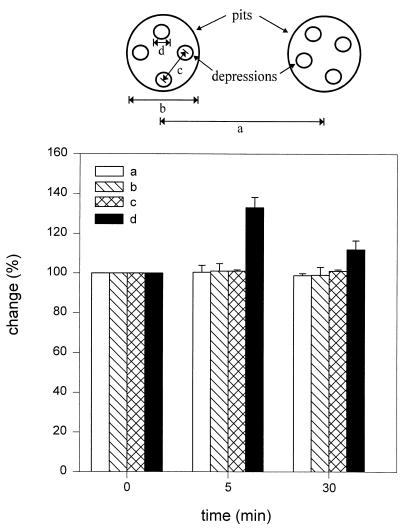
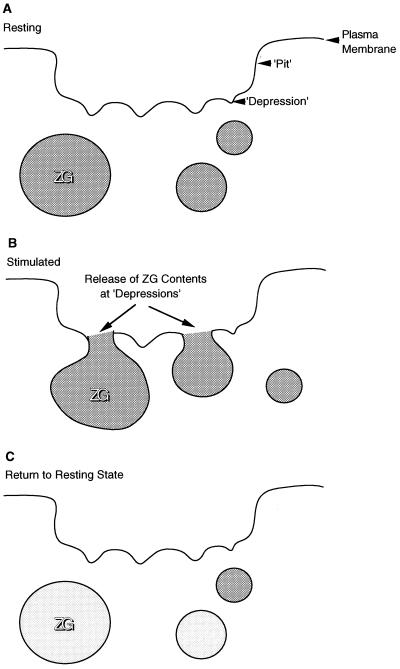
The dynamics at the plasma membrane resulting from secretory vesicle docking and fusion and compensatory endocytosis has been difficult to observe in living cells primarily due to limited resolution at the light microscopic level. Using the atomic force microscope, we have been able to image and record changes in plasma membrane structure at ultrahigh resolution after stimulation of secretion from isolated pancreatic acinar cells. "Pits" measuring 500-2000 nm and containing 3-20 depressions measuring 100-180 nm in diameter were observed only at the apical region of acinar cells. The time course of an increase and decrease in "depression" size correlated with an increase and decrease of amylase secretion from live acinar cells. Depression dynamics and amylase release were found to be regulated in part by actin. No structural changes were identified at the basolateral region of these cells. Our results suggest depressions to be the fusion pores identified earlier in mast cells by freeze-fracture electron microscopy and by electrophysiological measurements. The atomic force microscope has enabled us to observe plasma membrane dynamics of the exocytic process in living cells in real time.


Figures

Figure 1
Figure 1
Rat pancreatic acinar cells seen at the light (Inset) and electron microscope level. The polarity of isolated acinar cells with clearly identifiable apical (A) and basolateral (BL) regions is seen in the differential interference contrast image. The nucleus (N) is present toward the basolateral region, and the zymogen granules (ZGs), ranging in size from 0.1 to 1 μm, are concentrated at the apical end of the cells. (Bar = 5 μm.)
Figure 2
Figure 2
Topology of the apical cell surface of isolated pancreatic acini observed by atomic force microscopy. Scattered pits at the apical plasma membrane surface with papillae-like projections are seen. One pit (Inset) with four depressions is shown. A number of large pore-like structures are also identified.
Figure 3
Figure 3
Dynamics of depressions following stimulation of secretion. (a) Several depressions within a pit are shown. The scan line across three depressions in the top panel is represented graphically in the middle panel and defines the diameter and relative depth of the depressions; the middle depression is represented by red arrowheads. The bottom panel represents % total cellular amylase release in the presence and absence of the secretagogue Mas7. (b) Notice an increase in the depression diameter and relative depth, correlating with an increase in total cellular amylase release at 5 min after stimulation of secretion. (c) At 30 min after stimulation of secretion, there is a decrease in diameter and depth of the depressions and no further increase in amylase release over the 5-min time point. No significant changes in amylase secretion or depression diameter were observed in control acini, in either the presence or the absence of the nonstimulatory mastoparan analogue Mas17, throughout the times examined. High-resolution images of pits and their depressions were obtained before and after stimulation with Mas7, for up to 30 min.
Figure 4
Figure 4
Changes were observed only in the depressions following stimulation of secretion. An analysis of the dimensions ad (n = 28), schematically represented at the top and graphically presented below, demonstrates a significant increase (P < 0.001 by paired Student t test) in the depression diameter at 5 min and a return toward prestimulatory levels after 30 min. No changes (100%) in a–c are seen throughout the times examined. Pit and depression diameters were estimated using section analysis software from Digital Instruments. Each single pit or depression was measured twice, once in the scan direction and once at 90° to the first.
Figure 5
Figure 5
Schematic diagram depicting depressions as secretory vesicle docking and fusion sites at the apical plasma membrane of the pancreatic acinar cell. The depressions within pits are shown as permanent structures on the plasma membrane (a). Following stimulation of secretion, there is an increase in the depth and diameter of depressions, which then fuse with the ZG membrane, resulting in the release of vesicle contents (b). Following secretion, there is a gradual return to the resting state (c).

Comment in

References

    1. Jamieson J D. In: Current Topics in Membranes and Transport. Bronner F, Kleinzeller A, editors. New York: Academic; 1972. pp. 273–338.
    1. Chandler D E, Heuser J E. J Cell Biol. 1980;86:666–674. - PMC - PubMed
    1. Breckenridge L J, Almers W. Nature (London) 1987;328:814–817. - PubMed
    1. Breckenridge L J, Almers W. Proc Natl Acad Sci USA. 1987;84:1945–1949. - PMC - PubMed
    1. Almers W, Tse F W. Neuron. 1990;4:813–818. - PubMed

Publication types

LinkOut - more resources