. 1997 Feb 1;17(3):932-40.
doi: 10.1523/JNEUROSCI.17-03-00932.1997.

Neuronal regulation of glutamate transporter subtype expression in astrocytes

Affiliations

Neuronal regulation of glutamate transporter subtype expression in astrocytes

R A Swanson et al. J Neurosci. .

Abstract

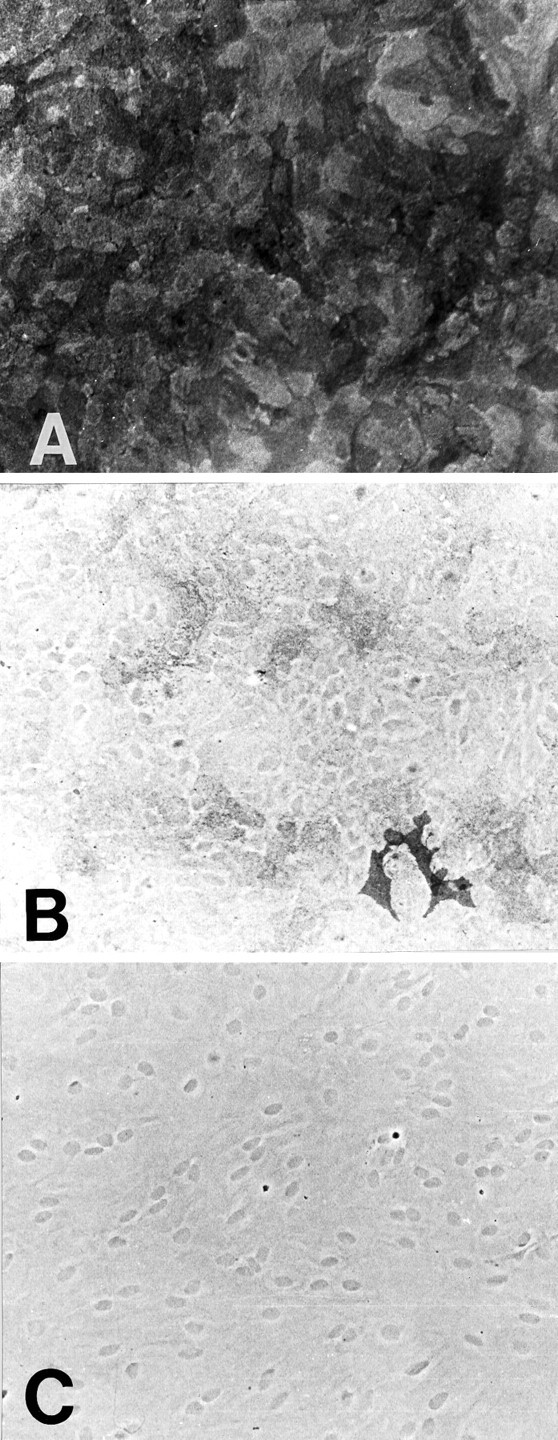
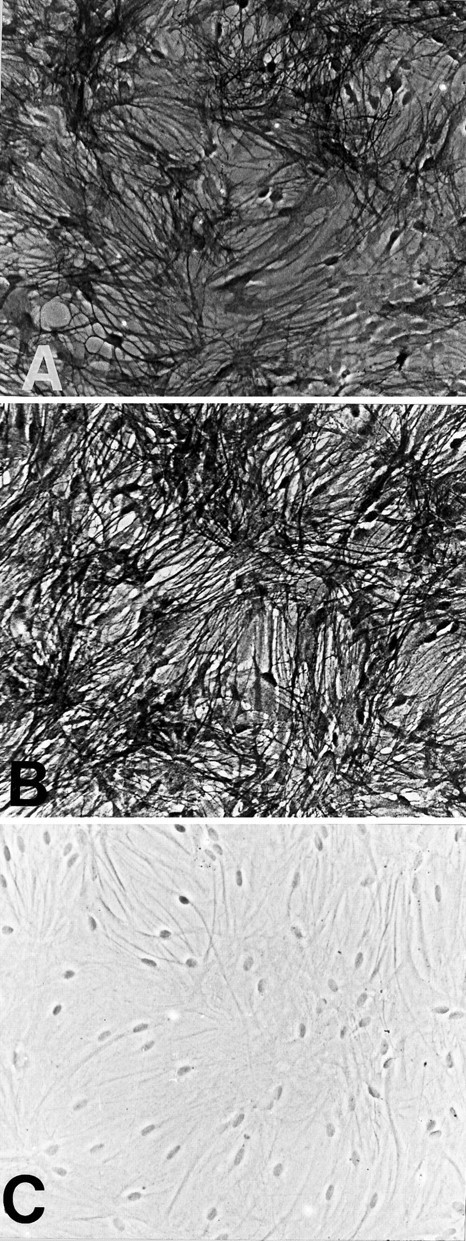
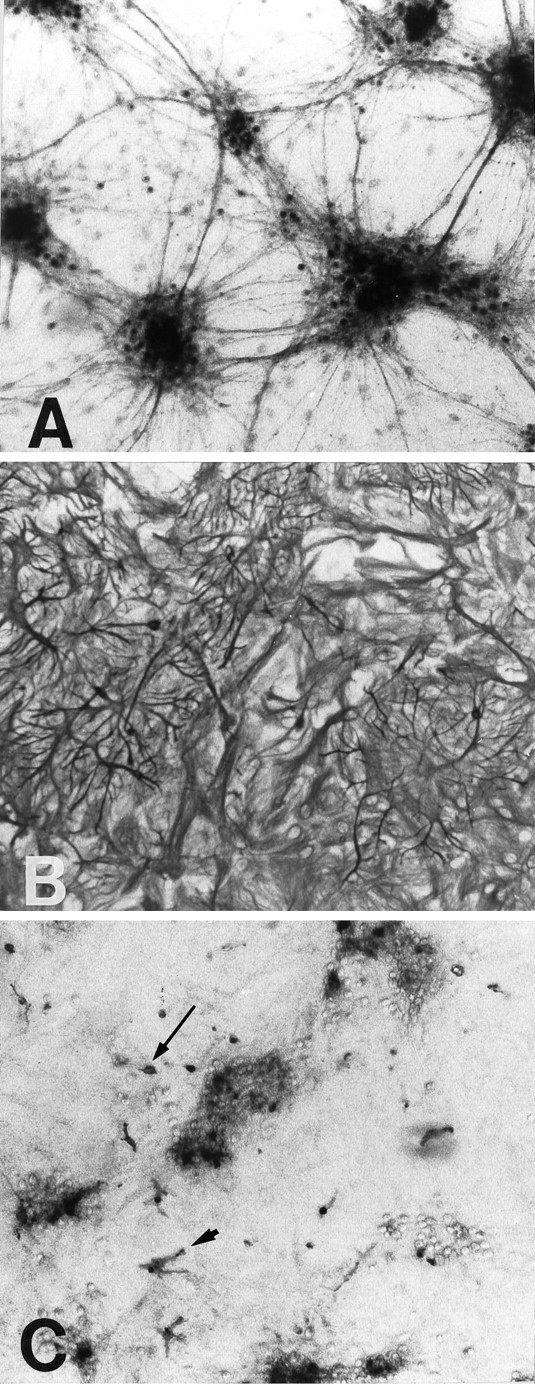
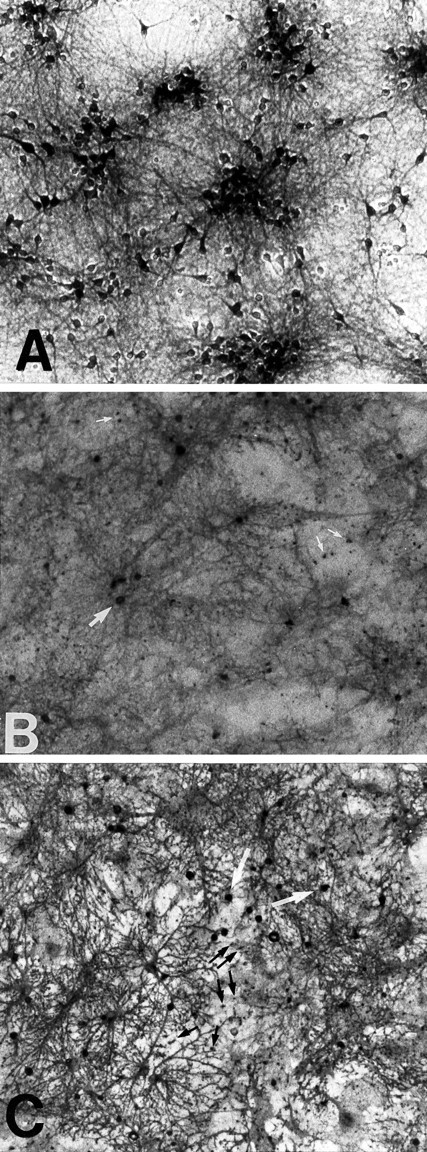
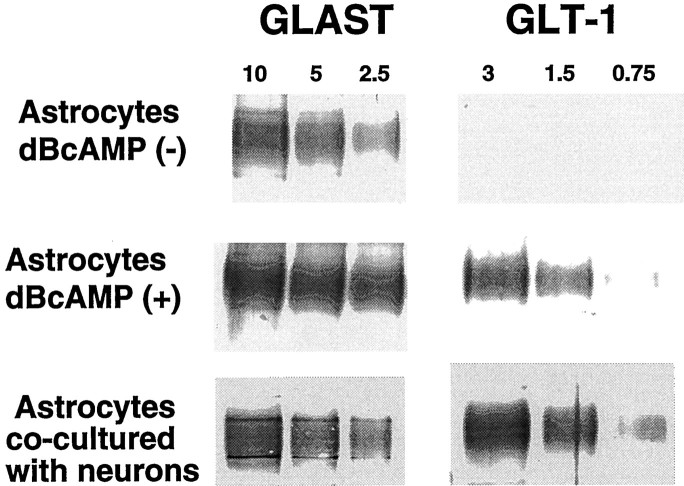
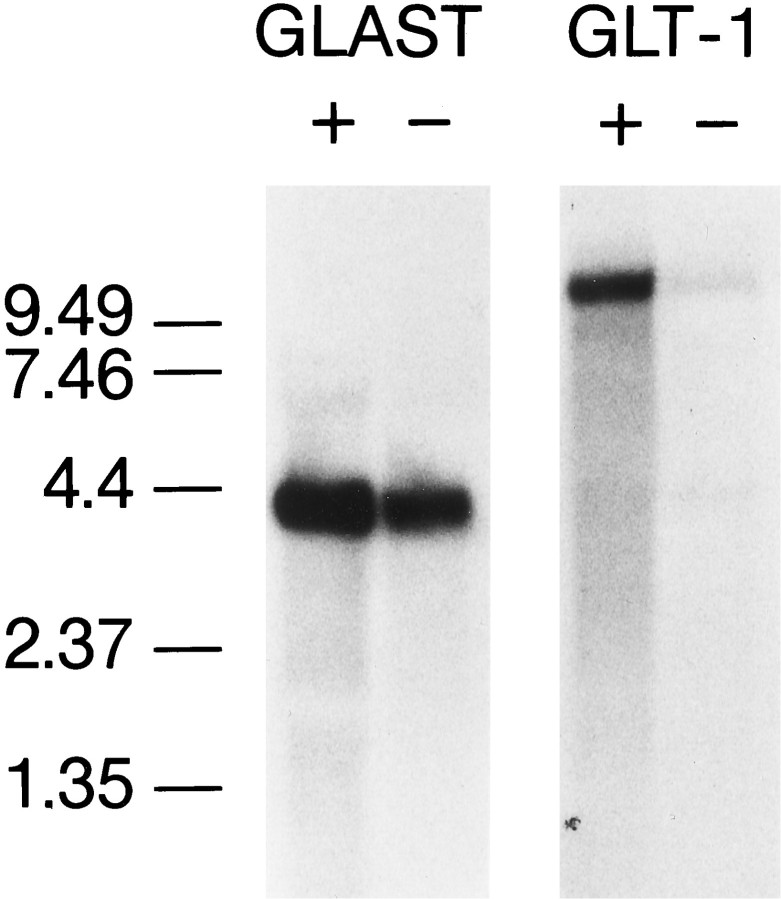
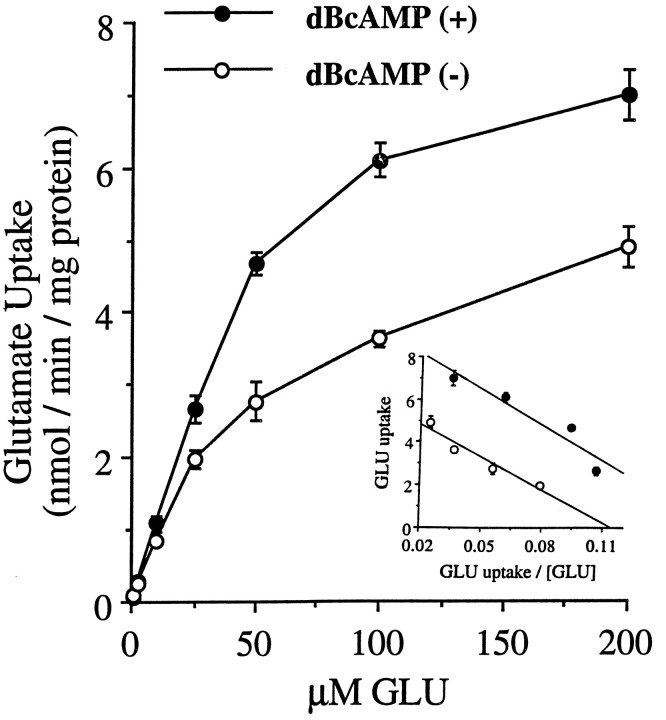
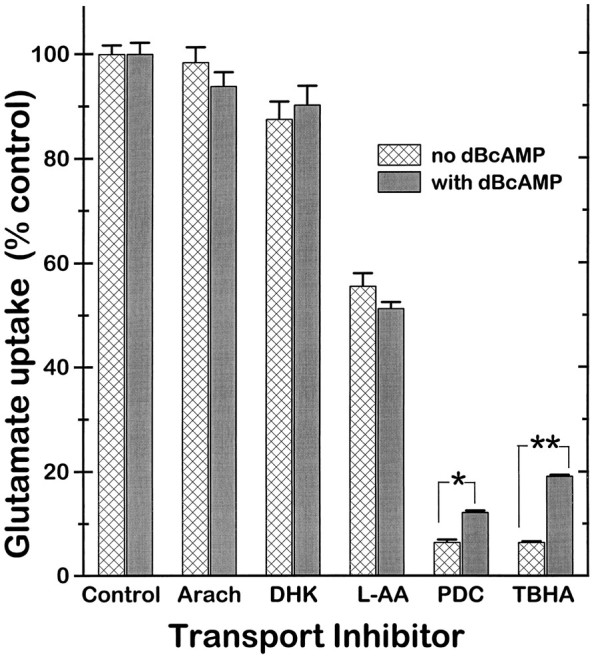
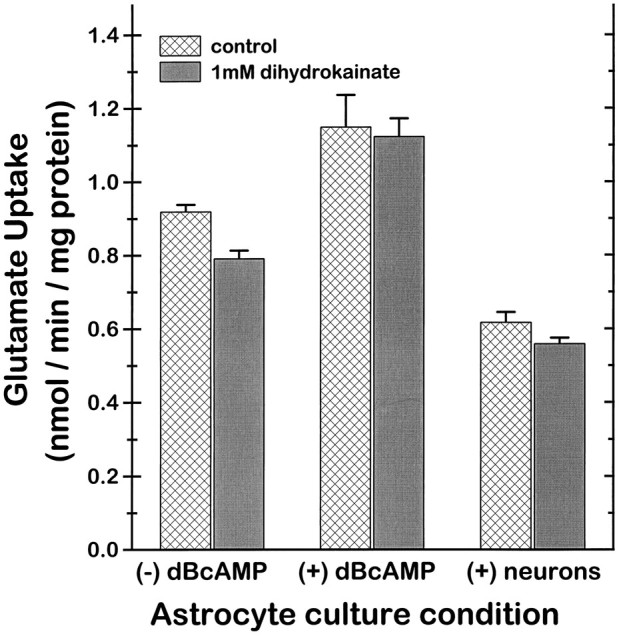
GLT-1, GLAST, and EAAC1 are high-affinity, Na(+)-dependent glutamate transporters identified in rat forebrain. The expression of these transporter subtypes was characterized in three preparations: undifferentiated rat cortical astrocyte cultures, astrocytes cocultured with cortical neurons, and astrocyte cultures differentiated with dibutyryl cyclic AMP (dBcAMP). The undifferentiated astrocyte monocultures expressed only the GLAST subtype. Astrocytes cocultured with neurons developed a stellate morphology and expressed both GLAST and GLT-1; neurons expressed only the EAAC1 transporter, and rare microglia in these cultures expressed GLT-1. Treatment of astrocyte cultures with dBcAMP induced expression of GLT-1 and increased expression of GLAST. These effects of dBcAMP on transporter expression were qualitatively similar to those resulting from coculture with neurons, but immunocytochemistry showed the pattern of transporter expression to be more complex in the coculture preparations. Compared with astrocytes expressing only GLAST, the dBcAMP-treated cultures expressing both GLAST and GLT-1 showed an increase in glutamate uptake Vmax, but no change in the glutamate K(m) and no increased sensitivity to inhibition by dihydrokainate. Pyrrolidine-2,4-dicarboxylic acid and threo-beta-hydroxyaspartic acid caused relatively less inhibition of transport in cultures expressing both GLAST and GLT-1, suggesting a weaker effect at GLT-1 than at GLAST. These studies show that astrocyte expression of glutamate transporter subtypes is influenced by neurons, and that dBcAMP can partially mimic this influence. Manipulation of transporter expression in astrocyte cultures may permit identification of factors regulating the expression and function of GLAST and GLT-1 in their native cell type.


Figures

Fig. 1.
Fig. 1.
GLAST and GLT-1 expression in undifferentiated astrocyte cultures (not treated with dBcAMP). GLAST is expressed throughout the cultures (A), but GLT-1 is not (B). The two cells staining for GLT in Bhave a morphology atypical for astrocytes. No staining was observed in the absence of primary antibody (C); nuclei appear dark because of the phase-contrast optics.
Fig. 2.
Fig. 2.
GLAST and GLT-1 expression in process-bearing astrocyte cultures (treated with dBcAMP). Both GLAST (A) and GLT-1 (B) are expressed in cell bodies and processes throughout cultures. No staining was observed in the absence of primary antibody (C).
Fig. 3.
Fig. 3.
Immunostaining of neurons, astrocytes, and microglia in astrocyte–neuronal cocultures. Antibody to neurofilament protein (A) shows neurons arranged in loose clusters. The astrocyte layer is stained with glial fibrillary acidic protein (B) and shows cells with both polygonal and stellate shapes. Staining with OX42 (C) shows scattered microglia among and between the neuronal clusters. These cells exhibit both branched (arrowhead) and spherical (arrow) morphologies.
Fig. 4.
Fig. 4.
EAAC1, GLAST, and GLT-1 expression in cortical cultures containing glia and neurons. EAAC1 expression (A) was restricted to neuronal cell bodies and processes. GLAST (B) was expressed diffusely in the astrocyte layer. More focal and intense expression was observed in some cell bodies (large arrow) and in a scattered, punctate manner among the processes (small arrows). GLT-1 was strongly expressed by some, but not all, of the astrocytes (C). These cells exhibited a highly branched, stellate morphology. Foci of intense staining were observed in the same pattern as with GLAST: small cell bodies (white arrows) and scattered among the processes (small black arrows).
Fig. 5.
Fig. 5.
Western blots confirm that astrocyte GLT-1 expression is induced and GLAST expression is increased both by incubation with dBcAMP (0.15 mm) and by coculture with neurons. Numbers above the lanes denote μg protein loaded onto the lanes.
Fig. 6.
Fig. 6.
Northern blots show that GLAST and GLT-1 mRNA levels are both increased in astrocyte cultures treated with dBcAMP (+). Nontreated cultures (−) produced only a faint GLT-1 signal and expressed less GLAST mRNA than did the dBcAMP-treated cultures. The cyclophilin bands (not shown) had relative optical densities of 320 in the dBcAMP (+) cultures and 346 in the dBcAMP (−) cultures, confirming near equal loading of mRNA.
Fig. 7.
Fig. 7.
Glutamate (GLU) uptake in astrocyte cultures with and without treatment with dBcAMP.Vmax for glutamate uptake is significantly greater in cultures treated with dBcAMP, whereasKm is nearly identical. Insetshows Eadie Hofstee plot of the data. With dBcAMP:Vmax = 9.42 nmol/min/mg protein;Km = 56 μm;r2 = 0.90. Without dBcAMP:Vmax = 5.81 nmol/min/mg protein;Km = 51 μm;r2 = 0.93; n = 8.
Fig. 8.
Fig. 8.
Effects of glutamate uptake inhibitors on astrocytes cultured with and without dBcAMP. PDC and TBHA exhibited significantly less inhibition on dBcAMP-treated cultures expressing both GLAST and GLT-1 than on nontreated cultures expressing only GLAST. Glutamate = 10 μm, inhibitors at 1 mm. Uptake is expressed as percent of the control (no inhibitor) uptake rate for the corresponding culture type. For cultures not treated with dBcAMP (expressing only GLAST), the control uptake rate was 0.923 ± 0.15 nmol/min/mg protein; for cultures treated with dBcAMP (expressing GLAST plus GLT-1), the control rate was 1.15 ± 0.024 nmol/min/mg protein. Arach, Arachidonic acid; **p < 0.001, *p < 0.05 by ANOVA with Bonferroni correction for multiple comparisons;n = 8–18, pooled from three studies.
Fig. 9.
Fig. 9.
DHK had negligible effects on glutamate uptake in any of the three culture preparations studied. () dBcAMP, Without dBcAMP; (+) dBcAMP, cultured with 0.15 mm dBcAMP for 10 d; (+) neurons, cultured with a neuronal layer plated onto the astrocytes for 10 d (n = 10, pooled from replicate studies). Values are normalized to total protein content of the culture wells, such that the apparently lower uptake rate in the astrocyte–neuronal cocultures compared with the astrocyte monocultures may reflect the contribution of neuronal protein to this denominator. p > 0.05 for all pairwise comparisons between control and DHK conditions within each culture type.

References

    1. Arriza JL, Fairman WA, Wadiche JI, Murdoch GH, Kavanaugh MP, Amara SG. Functional comparisons of three glutamate transporter subtypes cloned from human motor cortex. J Neurosci. 1994;14:5559–5569. - PMC - PubMed
    1. Bjørås M, Gjesdal O, Erickson JD, Torp R, Levy LM, Ottersen OP, Degree M, Storm-Mathisen J, Seeberg E, Danbolt NC. Cloning and expression of a neuronal rat brain glutamate transporter. Mol Brain Res. 1996;36:163–168. - PubMed
    1. Bristol LA, Rothstein JD. Glutamate transporter gene expression in amyotrophic lateral sclerosis motor cortex. Ann Neurol. 1996;39:676–679. - PubMed
    1. Cammer W. Glutamine synthetase in the central nervous system is not confined to astrocytes. J Neuroimmunol. 1990;26:173–178. - PubMed
    1. Castellano B, Gonzalez B, Jensen MB, Pedersen EB, Finsen BR, Zimmer J. A double staining technique for simultaneous demonstration of astrocytes and microglia in brain sections and astroglial cell cultures. J Histochem Cytochem. 1991;39:561–568. - PubMed

Publication types

MeSH terms

LinkOut - more resources