. 1997 Feb 1;17(3):1147-67.
doi: 10.1523/JNEUROSCI.17-03-01147.1997.

Song- and order-selective neurons in the songbird anterior forebrain and their emergence during vocal development

Affiliations

Song- and order-selective neurons in the songbird anterior forebrain and their emergence during vocal development

A J Doupe. J Neurosci. .

Abstract

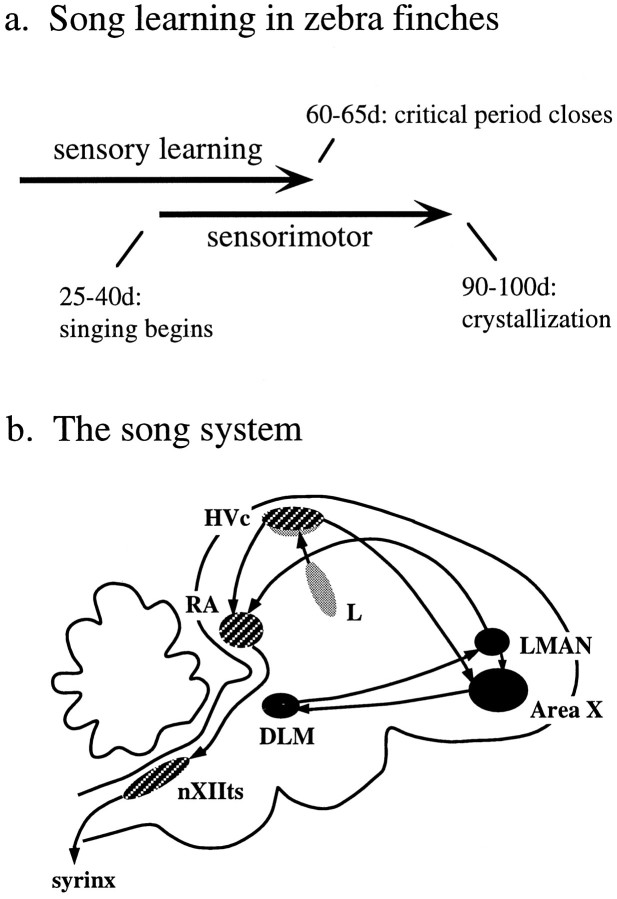
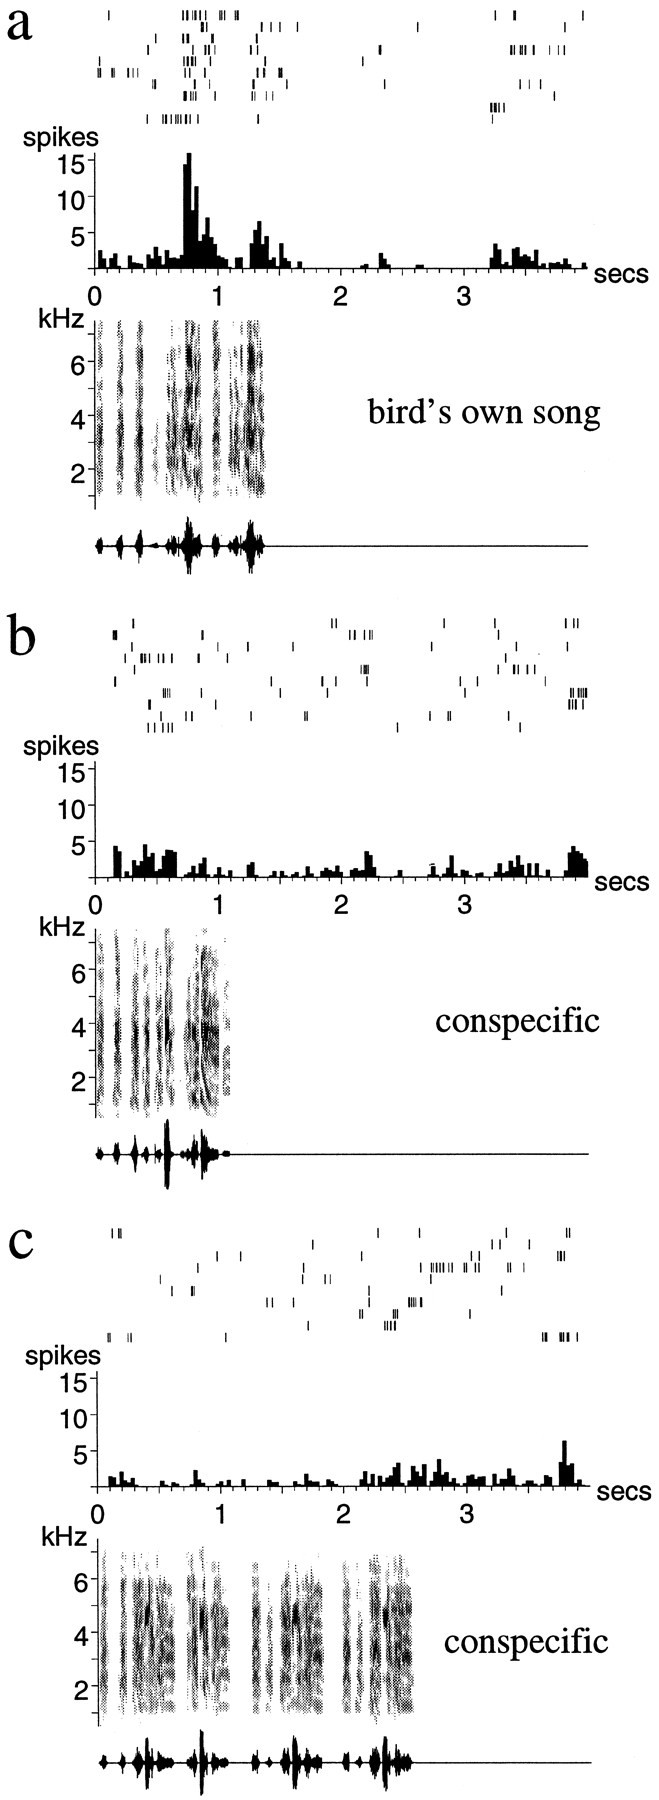
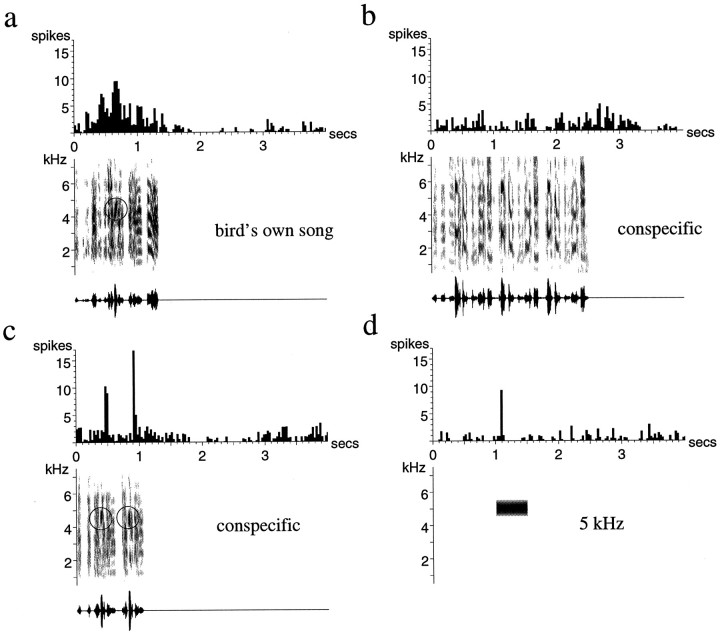
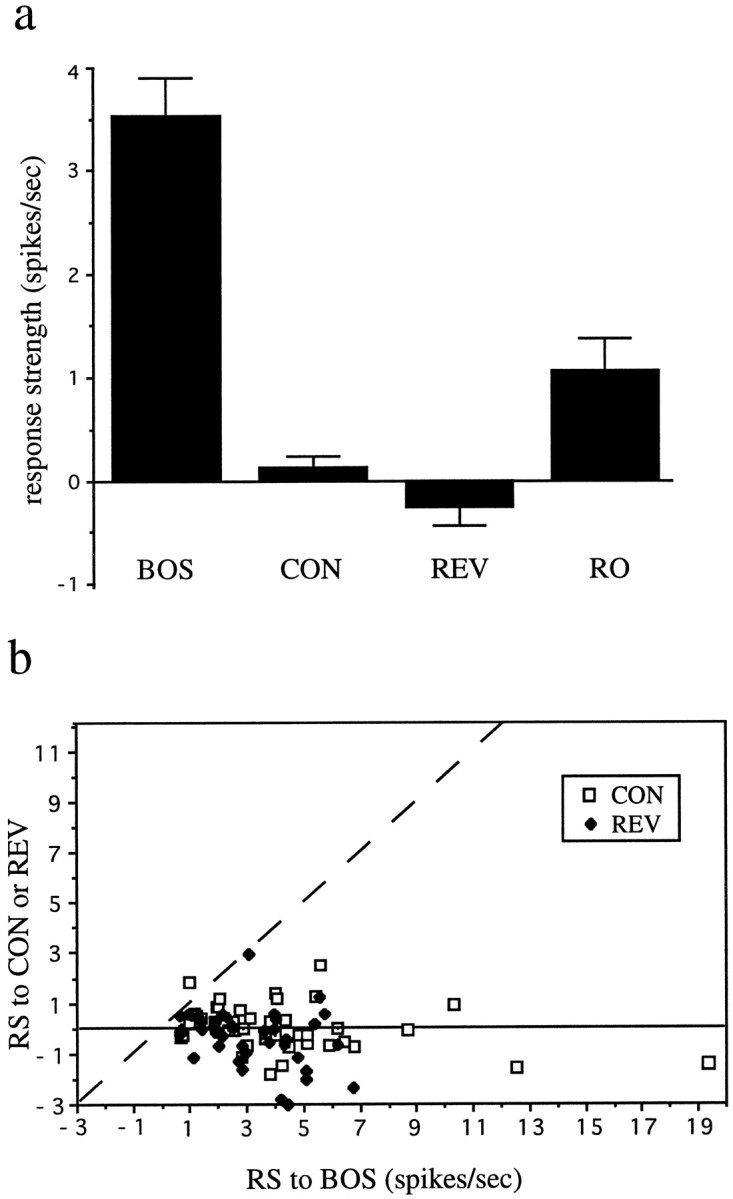
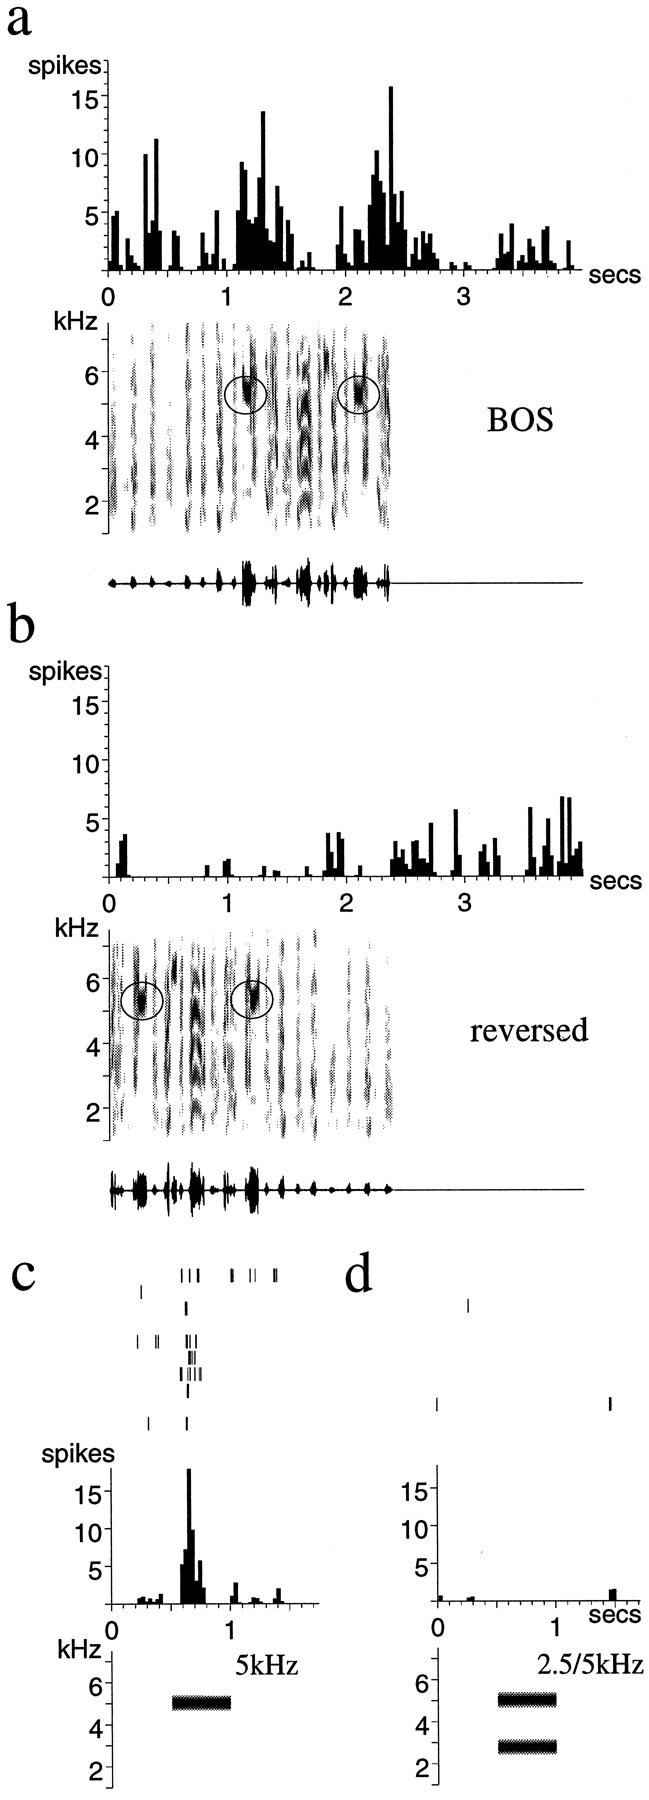
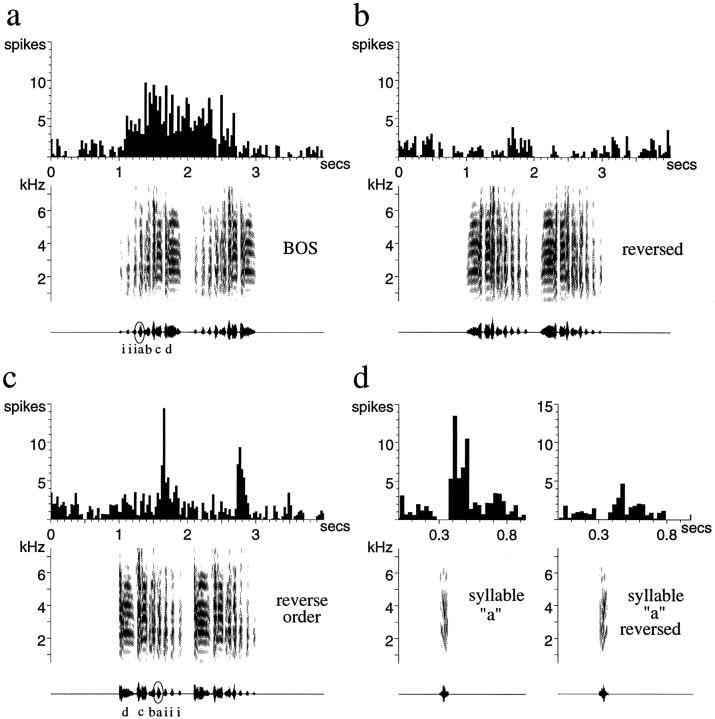
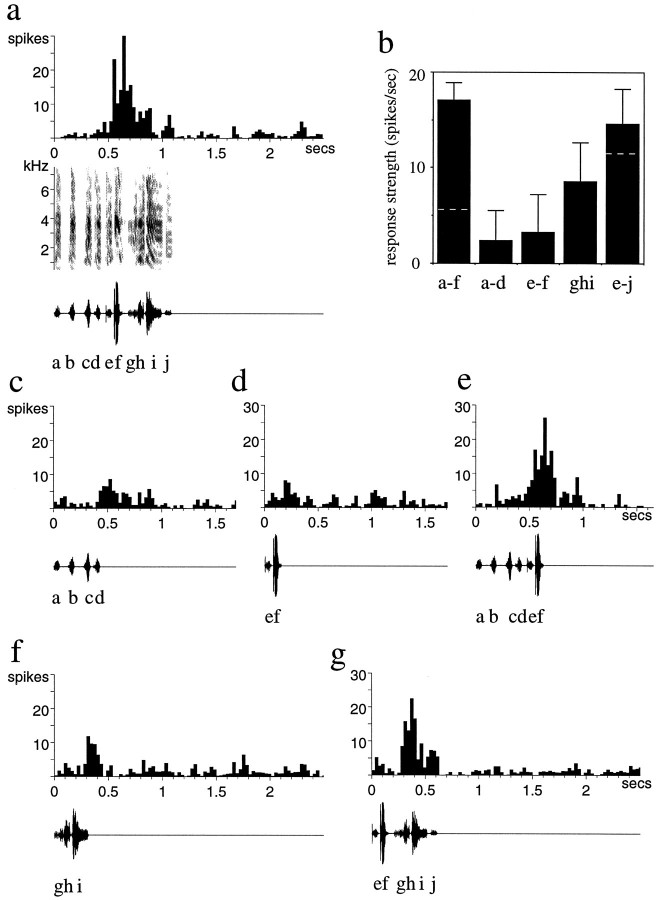
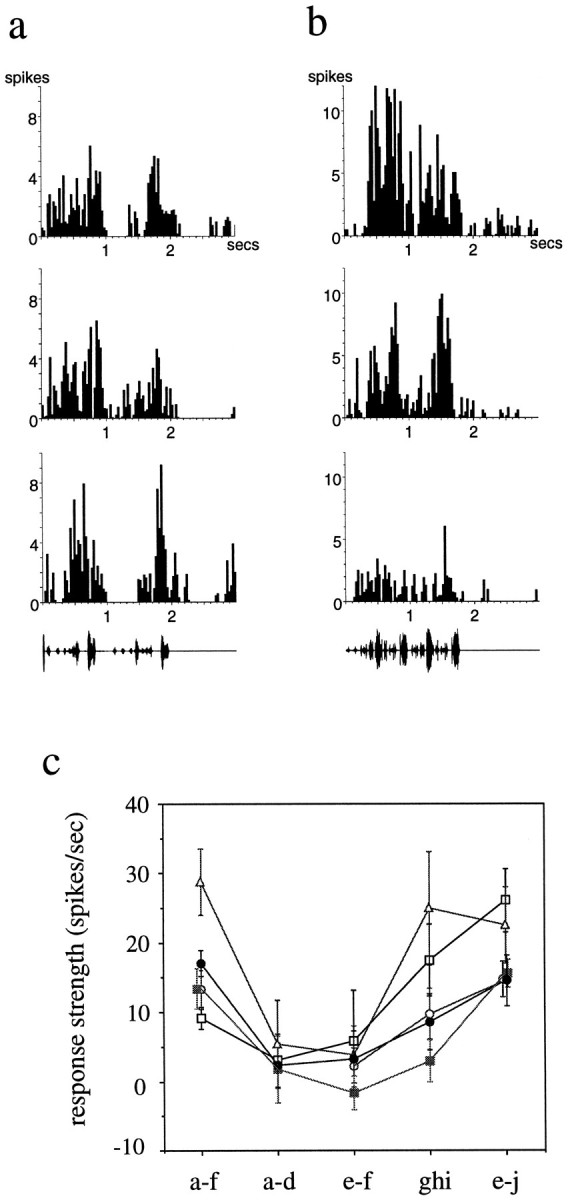
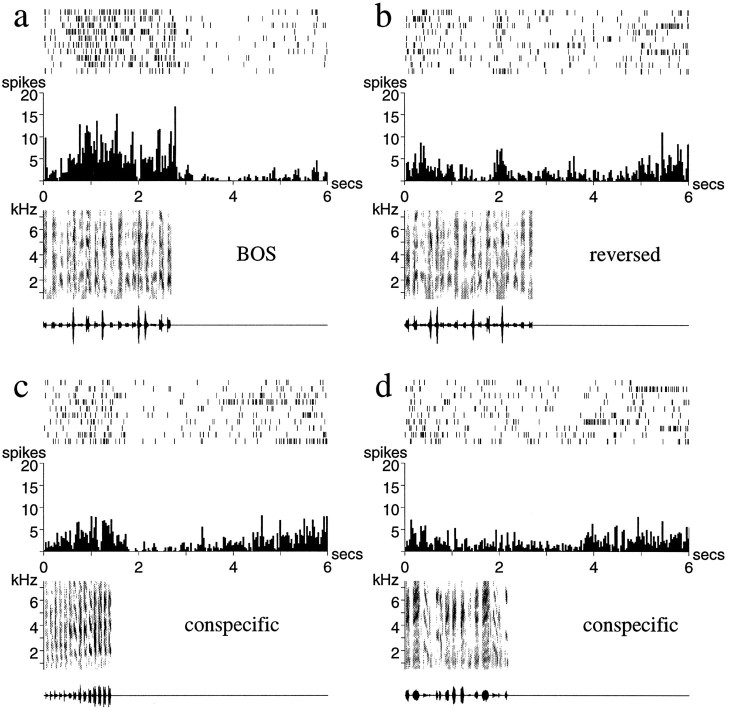
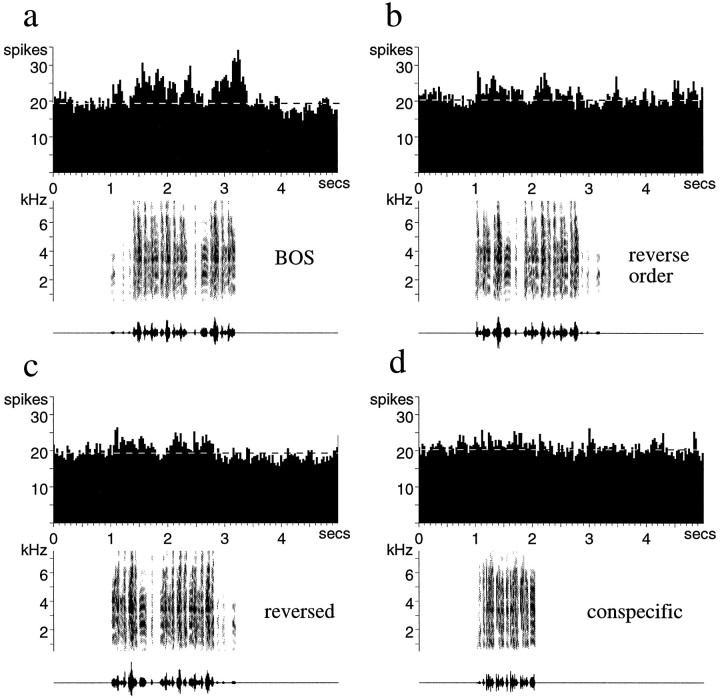
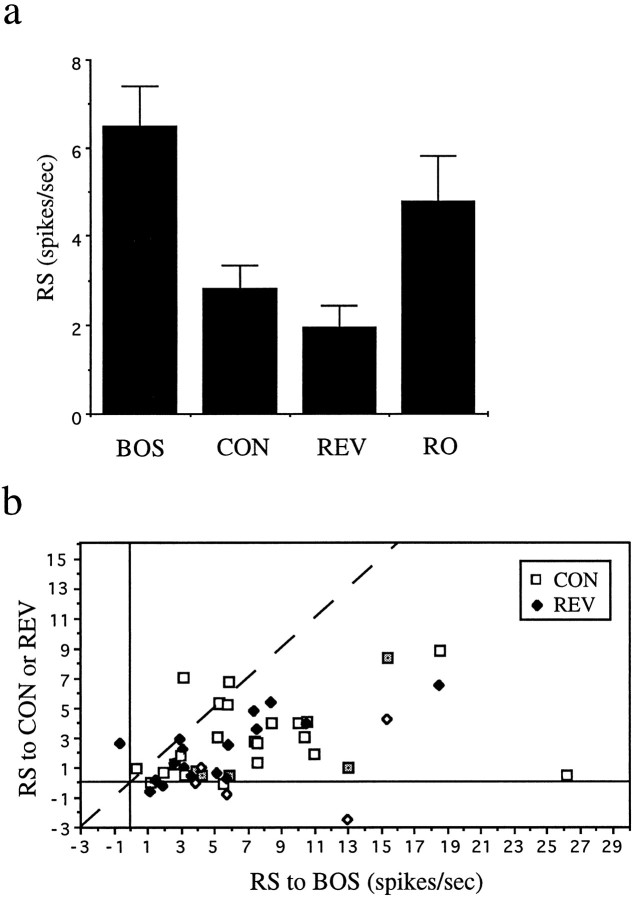
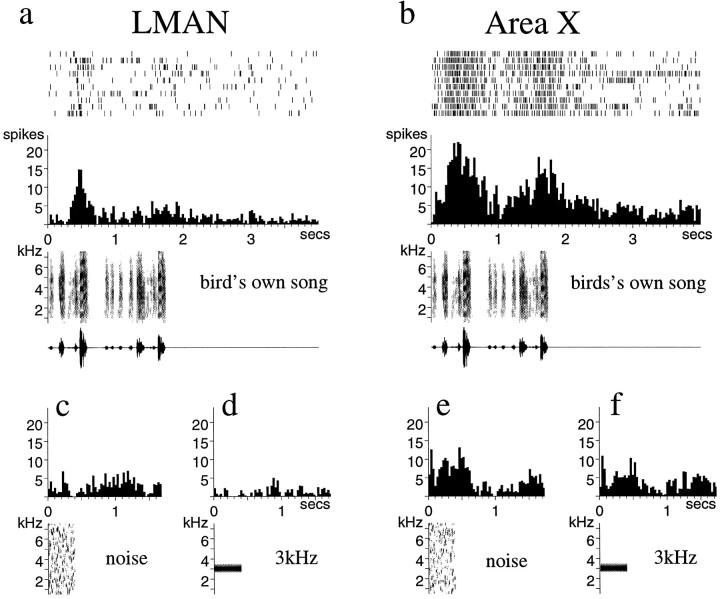
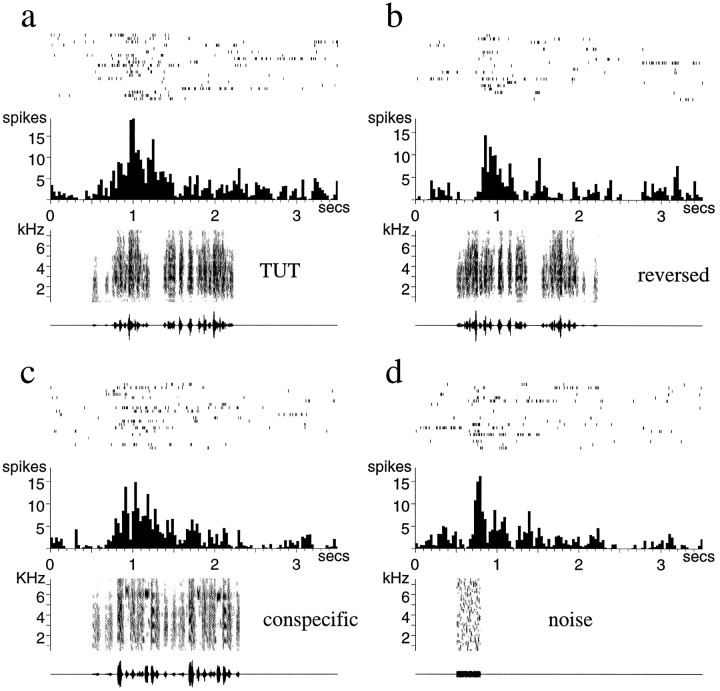
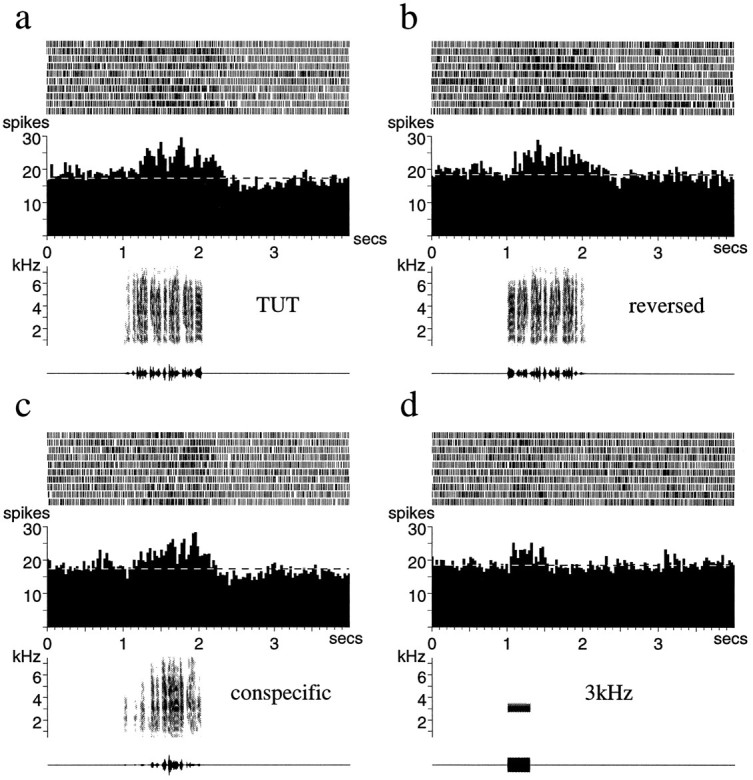
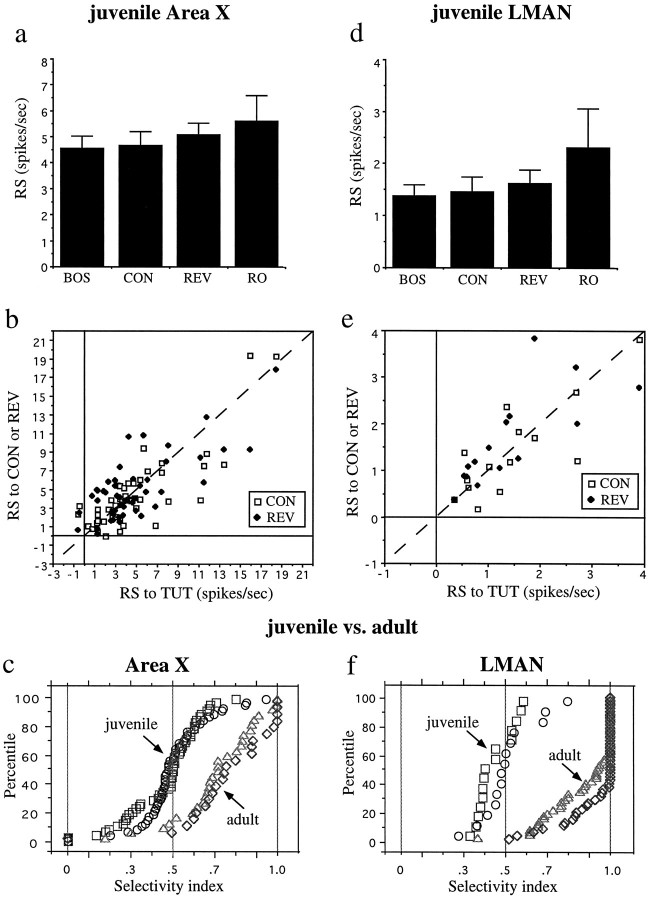
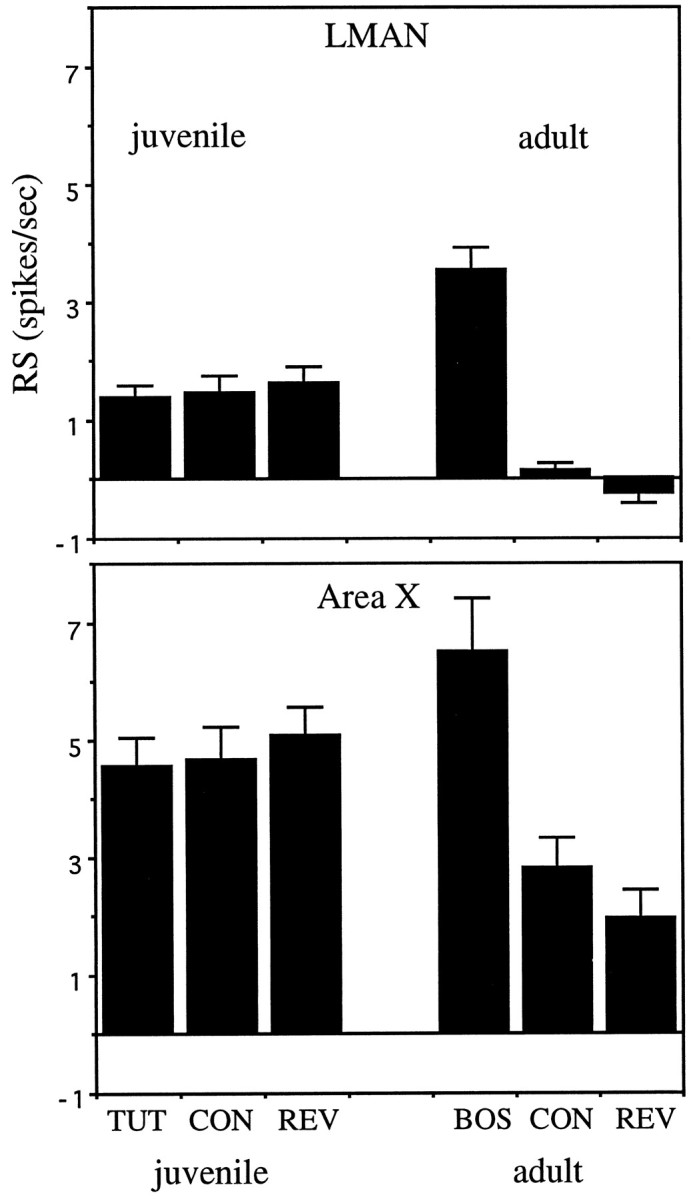
Auditory experience is critical for vocal learning in songbirds as in humans. Therefore, in a search for neural mechanisms for song learning and recognition, the auditory response properties of neurons in the anterior forebrain (AF) pathway of the songbird brain were investigated. This pathway plays an essential but poorly understood role during the period of song development when auditory feedback is most crucial. Single-unit recordings demonstrated that both the lateral magnocellular nucleus of the anterior neostriatum (LMAN) and Area X (X) contain auditory neurons in adult male finches. These neurons are strongly selective for both spectral and temporal properties of song; they respond more robustly to the bird's own song (BOS) than to songs of conspecific individuals, and they respond less well to the BOS if it is played in reverse. In addition, X neurons are more broadly responsive than LMAN neurons, suggesting that responses to song become progressively more refined along this pathway. Both X and LMAN of young male finches early in the process of song learning (30-45 d old) also contain song-responsive auditory neurons, but these juvenile neurons lack the song and order selectivity present in adult birds. The spectral and temporal selectivity of the adult AF auditory neurons therefore arises during development in neurons that are initially broadly song-responsive. These neurons provide one of the clearest examples of experience-dependent acquisition of complex stimulus selectivity. Moreover, the auditory properties of the AF circuit suggest that one of its functions may be to mediate the auditory learning and feedback so essential to song development.


Figures

Fig. 1.
Fig. 1.
a, The time line of song learning for zebra finches. b, Schematic of the song system. The cross-hatched nuclei, HVc, RA, and the tracheosyringeal portion of the hypoglossal nucleus (nXIIts) form part of the descending motor pathway for song. The nuclei X, DLM, and LMAN, shown in solid black, form a pathway indirectly connecting HVc to the RA and play a special role during song learning. The primary sources of auditory input to the song system are the field L complex (L) and its projections to the “shelf” underlying HVc (stippled areas).
Fig. 2.
Fig. 2.
Auditory responses of a single unit in LMAN of an adult zebra finch. a, The response to the BOS;b, c, responses to two different conspecific songs (songs of other individual zebra finches). The strong response to the BOS is followed by a period (∼1.5 sec) of inhibition. Note that there is considerable trial-to-trial variability in the reproducibility and exact timing of the stimulus-evoked spikes. The conspecific song in b elicits a weak response, whereas the song in c inhibits the spontaneous firing of the neuron. Below each spike raster and peristimulus time histogram are shown the sonogram (frequency vs time plot, with energy in each frequency band indicated by the darkness of the signal) and the oscillogram (amplitude waveform) of the song stimulus used.
Fig. 3.
Fig. 3.
A single unit in LMAN of an adult zebra finch.a, Response to the BOS; b,c, responses to two different conspecific songs;d, response to a 5 kHz tone burst. The conspecific song in c elicits a phasic response 60 msec after each of two syllables that contain primarily a loud sound in the 4.5–5 kHz frequency range (circled). The BOS (a) also contains a note in that range (circled), and a 5 kHz tone burst elicits a response as well (d).
Fig. 4.
Fig. 4.
Summary data for adult LMAN neurons.a, Histogram of mean of RS values of all LMAN neurons recorded to the BOS, conspecific song (CON), BOS reversed (REV), and BOS in reverse order (RO). Error bars indicates SEM. b, For each individual LMAN unit for which these stimuli were tested, the RS values (RS) to the BOS is plotted versus the RS to CON (open squares) or the RS to REV (solid diamonds). The dashed line indicates the points where responses to the stimuli plotted on each axis are equal.
Fig. 5.
Fig. 5.
Temporal response properties of a single unit in LMAN of an adult zebra finch. The response to the BOS (a) is much stronger than the response to the same song reversed (b), which even elicits some inhibition. Both songs contain a syllable with significant power in the 5–5.2 kHz range (circled). The same neuron responds to a 5 kHz tone burst played in isolation (c), whereas a 2.5 and 5 kHz tone combination elicits no response (d). Histograms of the response to 10 stimulus presentations are shownabove sonograms and oscillograms of the song stimulus; in c and d, spike rasters are also shown to demonstrate the long and scattered response latency of LMAN neurons as well as the variability of the response.
Fig. 6.
Fig. 6.
Responses of adult LMAN neurons to different temporal manipulations of the BOS. This single unit responds strongly to the BOS, especially the first motif (a), and very little to the BOS reversed (b). The introductory notes (i) and syllables of each of the two motifs of song are labeled with lower case letters. c, The BOS played in reverse order, which maintains the order within each syllable while reversing the sequence, elicits a phasic response after each occurrence of syllable a. d, Syllable a also elicits a response when played in isolation (d,left panel, shown on an expanded time base); reversing this syllable eliminates that response (d, right panel).
Fig. 7.
Fig. 7.
A combination-sensitive neuron in adult LMAN.a, The response of the neuron to the entire BOS, the syllables of which are indicated with lower case lettersbelow the oscillogram, is shown. b, The mean RS (error bars indicate SEM) to each of the indicated syllable combinations is shown. The dashed white lines on the two outermostbars indicate the linear sum of the responses to the syllable combinations that are the components of that stimulus.cg, The neuron’s response to the indicated combinations of syllables (additional description in Results) is shown. Note that the RS to e–j in comparison with the linear sum of the RS to e–f and ghi does not seem as strongly nonlinear as the a–f combinations. This is attributable in part to a different temporal pattern of responses (see Results) and in part to the underestimate of firing rate caused by normalizing RS to the entire syllable combination played (which is longer for e–j than for ghi and, thus, underestimates the enhanced response; f vs g).
Fig. 8.
Fig. 8.
a, The similar (although not identical) pattern of responses to the BOS from three different single units in adult LMAN of one bird is shown. b, Another example of three LMAN units from a different bird is shown.c, The mean RS values to each of the syllable combinations for 5 different single LMAN units within the same bird are shown (for 1 unit, combination a–d was not tested). The unit shown in detail in Figure 7 is represented by the solid dots.
Fig. 9.
Fig. 9.
Auditory responses of a single unit in X. The response to the BOS (a), to the BOS reversed (b), and to two different conspecific songs (c, d). Note that the stimuli inb and especially c elicit responses, including poststimulus inhibition (c), but that these responses are lower in magnitude and less sustained than the response to the BOS.
Fig. 10.
Fig. 10.
Responses of a rapidly firing single unit in X. The response to the BOS (a) is stronger than the response to the BOS in reverse order song (b), BOS reversed (c), and conspecific song (d). The mean spontaneous firing rate of the neuron during each set of trials is indicated by the dashed white line on each histogram.
Fig. 11.
Fig. 11.
Summary data for adult X neurons.a, Histogram of mean RS of all X neurons to the BOS, CON, REV, and RO. Error bars indicate SEM. b, For each individual X unit for which these stimuli were tested, the RS to the BOS is plotted versus RS to CON (open squares) or RS to REV (solid diamonds). Stippled squaresand open diamonds represent data from Bengalese finches. The dashed line indicates the points where responses to the stimuli plotted on each axis are equal.
Fig. 12.
Fig. 12.
Single LMAN and X units recorded from the same bird. All histograms to the left of center are from LMAN, and those to the right are from X.a and b, Response of each neuron to the BOS; c, e, responses to a broad-band noise burst; d, f, responses to a 3 kHz tone burst. Note that the LMAN neuron does not respond significantly to either simple acoustic stimulus, whereas the X neuron responds to both with an on and an offset response as well as a more maintained response to the broad-band noise burst.
Fig. 13.
Fig. 13.
Auditory responses of a single LMAN unit from a juvenile zebra finch. a, Response to the tutor song played forward, whereas the next two panels show the very similar responses to the tutor song reversed (b) and to a conspecific song (c). The very long latency response of the same juvenile LMAN neuron to a broad-band noise burst is seen ind.
Fig. 14.
Fig. 14.
Auditory responses of a single X unit from a juvenile zebra finch. The response to the tutor song forward (TUT) (a), the tutor song reversed (b), a conspecific song (c), and a 3 kHz tone burst (d). Note the long latency and the maintained response to this simple stimulus. The mean spontaneous firing rate of the neuron during each set of trials is indicated by the dashed white line on each histogram.
Fig. 15.
Fig. 15.
Summary data for juvenile X and LMAN neurons. Histograms of mean RS of all juvenile X neurons (a) or LMAN neurons (d) to the tutor song forward (TUT), conspecific song (CON), tutor song reversed (REV), and tutor song in reverse order (RO). Error bars indicates SEM. For all individual juvenile X (b) and LMAN units (e) for which these stimuli were recorded, the RS to TUT is plotted versus the RS to CON (open squares) or RS to REV (solid diamonds). The cumulative percentage of cells at each SI for both adult and juvenile neurons in X (c) and LMAN (f); squares, juvenileSI(BOSvsCON); circles, juvenile SI(BOSvsREV);triangles, adultSI(BOSvsCON); diamonds, adultSI(BOSvsREV).
Fig. 16.
Fig. 16.
Summary comparison of AF neuron selectivity in juveniles and adults. Top, Mean RS to the BOS (for adults) or TUT (for juveniles), reversed BOS or tutor song, and CON for all neurons recorded in LMAN. Bottom, The same mean RS for all neurons in X. Error bars indicate SEM.

References

    1. Aamodt SM, Kozlowski MR, Nordeen EJ, Nordeen KW. Distribution and developmental change in [3H]- MK-801 binding within zebra finch song nuclei. J Neurobiol. 1992;23:997–1005. - PubMed
    1. Akutagawa E, Konishi M. Two separate areas of the brain differentially guide the development of a song control nucleus in the zebra finch. Proc Natl Acad Sci USA. 1994;91:12413–12417. - PMC - PubMed
    1. Arnold A. The effects of castration on song development in zebra finches, Poephila guttata. J Exp Zool. 1975;191:261–278. - PubMed
    1. Basham ME, Nordeen EJ, Nordeen KW. Blockade of NMDA receptors in the anterior forebrain impairs sensory acquisition in the zebra finch. Neurobiol Learn Mem. 1996;66:295–304. - PubMed
    1. Boehner J. Early acquisition of song in the zebra finch, Taeniopygia guttata. Anim Behav. 1990;39:369–374.

Publication types

LinkOut - more resources